


Data Visualization
Latest graphics associated with COVID-NET

Graphics from previous weeks are available under: Archived COVID-NET graphics below. Additional COVID-NET hospitalization data, including rates for different age groups and by surveillance site, are available on the COVID-NET interactive data page.
Latest graphics associated with publications
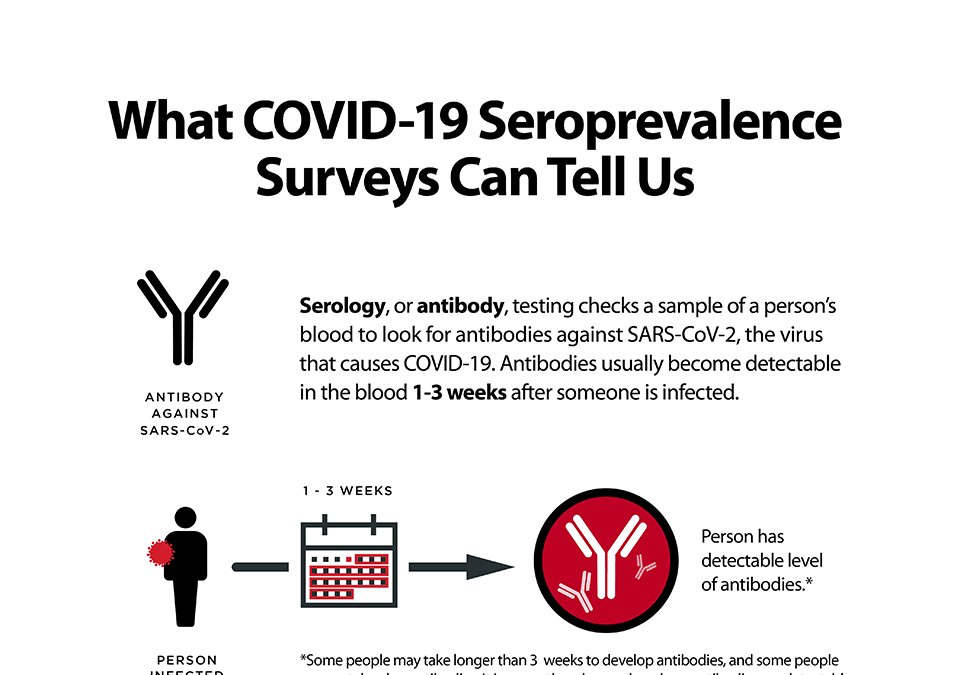
Seroprevalence surveys are investigations that involve the use of serology test (also known as antibody tests) to better understand how many SARS-CoV-2 infections have occurred at different points in time, in different locations, and in different populations in the United States.

A recently published study identified 186 cases of multisystem inflammatory syndrome in children (MIS-C) across pediatric health centers in 26 states from March through May, 2020. Read the study online: https://www.nejm.org/doi/full/10.1056/NEJMoa2021680external icon
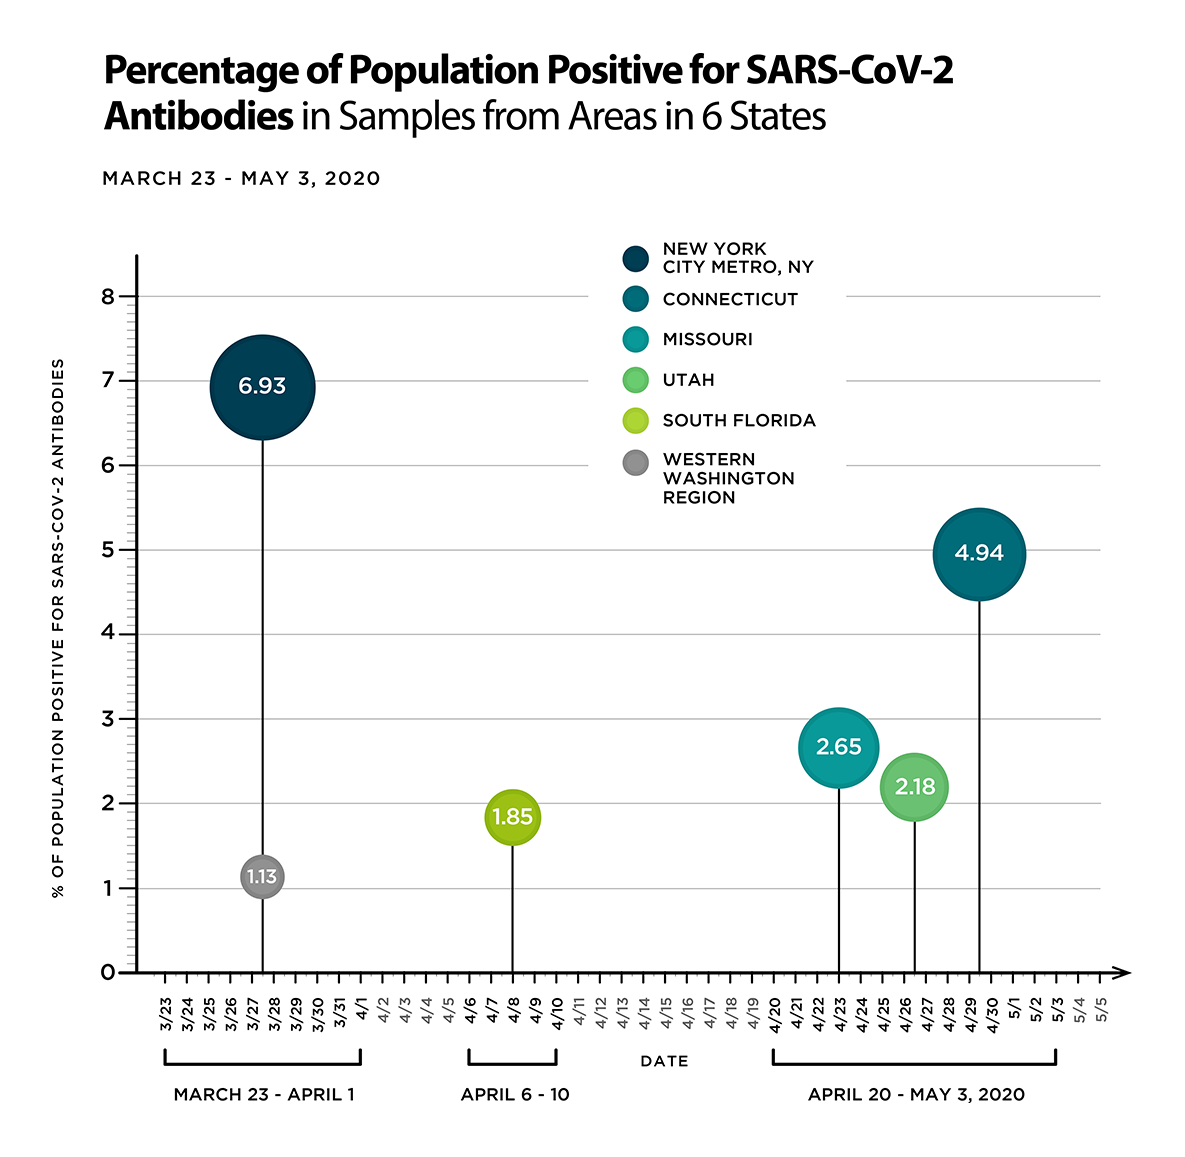
CDC is partnering with commercial laboratories to conduct a large-scale geographic seroprevalence survey that has tested de-identified clinical blood specimens from 6 sites. Read more about this survey: https://www.cdc.gov/coronavirus/2019-ncov/cases-updates/commercial-lab-surveys.html
Latest graphics associated with COVID MMWR Reports
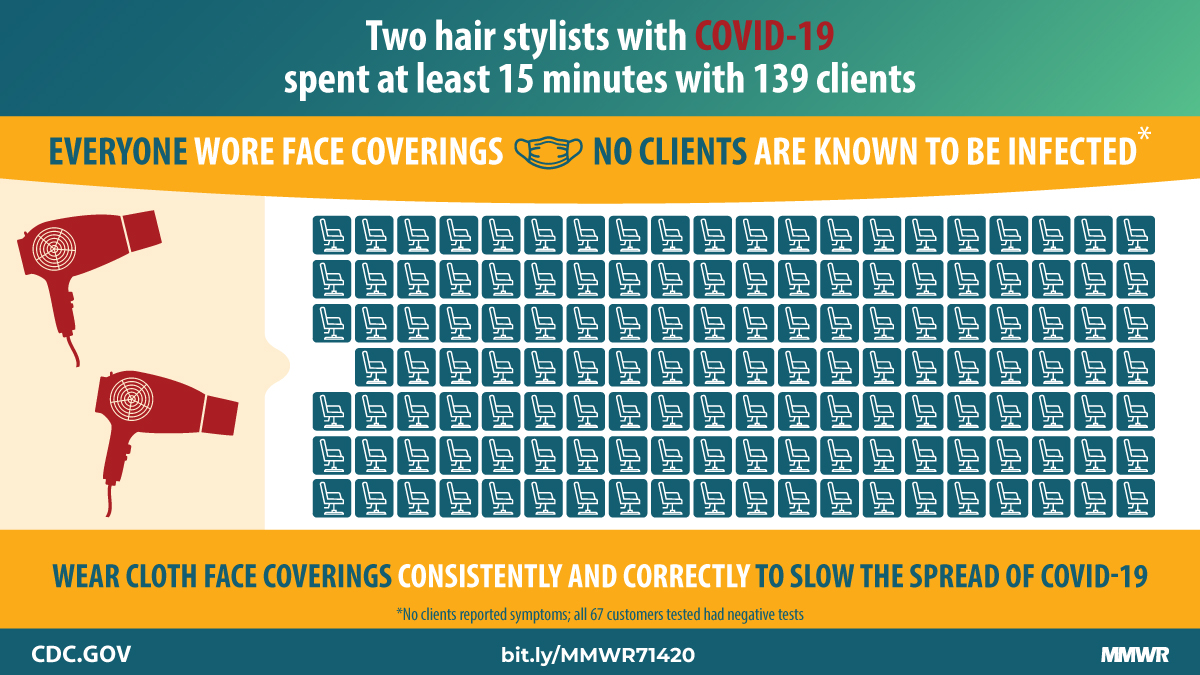
CDC report found that adherence to the community’s and company’s face-covering policy likely mitigated spread of SARS-CoV-2. Read the full report.

Data for 220 hospitalized and 311 nonhospitalized COVID-19 patients from six metropolitan Atlanta hospitals and associated outpatient clinics found that older age, black race, diabetes, lack of insurance, male sex, smoking, and obesity were independently associated with hospitalization. Read the full report.

In the 10 weeks following declaration of the COVID-19 national emergency, ED visits declined 23% for heart attack, 20% for stroke, and 10% for hyperglycemic crisis. Read the full report.

Among 23 states reporting COVID-19 outbreaks in meat and poultry processing facilities, 16,233 cases in 239 facilities occurred, including 86 (0.5%) COVID-19–related deaths. Read the full report.

In a random sample of Indiana residents aged ≥12 years, the estimated prevalence of current or previous COVID-19 infection in late April 2020 was 2.79%. Among persons with active infection, 44% reported no symptoms. Read the full report.

In a multistate telephone survey of symptomatic adult outpatients who had a positive test result for COVID-19, one in five persons aged 18–34 years with no chronic medical conditions had not returned to their usual state of health 2–3 weeks after testing. Read the full report.
View this graphic in Spanishimage icon.

From May 1 through June 30, 2020, 15 cases of methanol poisoning were reported in Arizona and New Mexico, associated with swallowing alcohol-based hand sanitizers. Four patients died, and three were discharged with visual impairment. Read the full report.
View this graphic in Spanishimage icon.

An outbreak of COVID-19 at a meat processing facility infected over 900 workers in 5 weeks. Read the full report.

During June 24–30, 2020, U.S. adults reported considerably elevated adverse mental health conditions associated with COVID-19. Younger adults, racial/ethnic minorities, essential workers, and unpaid adult caregivers reported having experienced disproportionately worse mental health outcomes. Read the full report.
View this graphic in Spanishimage icon.

During March 8–July 15, 2020, 818 (26%) of 3,142 U.S. counties were identified as COVID-19 hotspots; these counties included 80% of the U.S. population. Read the full report.
View this graphic in Spanishimage icon.

Mass testing finds widespread transmission of COVID-19 in prisons and jails. Twelve times more cases were found using mass testing compared with earlier symptom-based testing.
Read the full report.
Archived COVIDView graphics

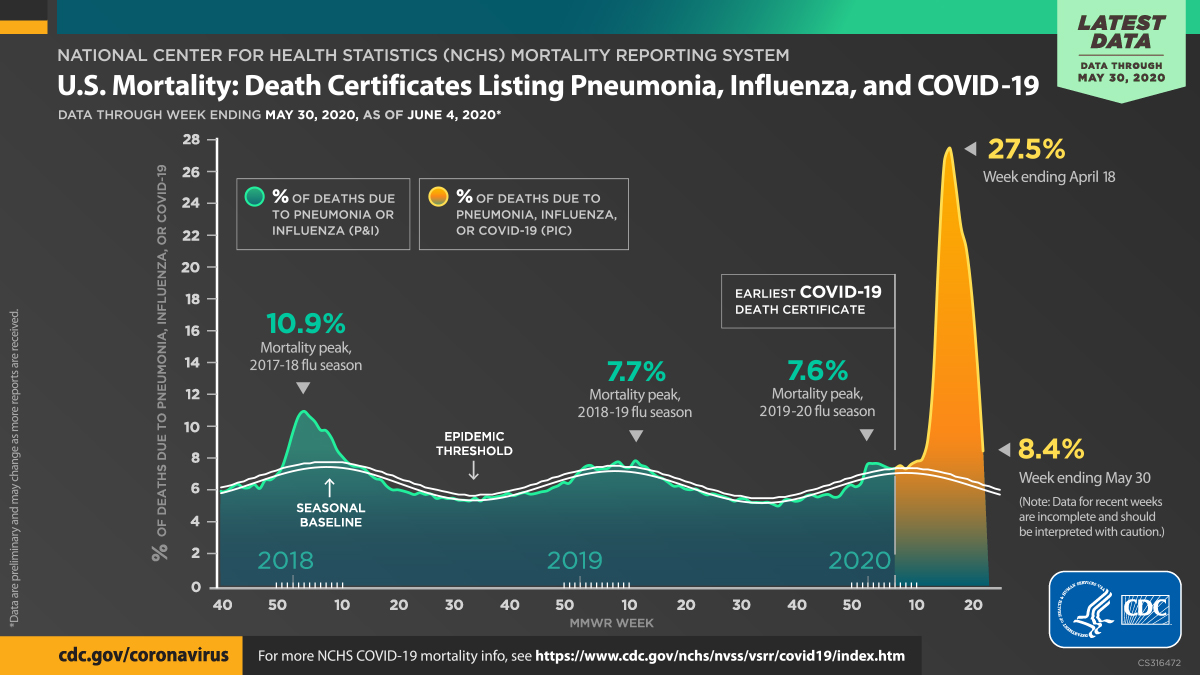
As of May 30, U.S. Mortality: Death Certificates Listing Pneumonia, Influenza, and COVID-19 (Animated GIF)


As of May 30, U.S. Mortality: Death Certificates Listing Pneumonia, Influenza, and COVID-19 (Static Image)

As of May 2, U.S. Mortality: Death Certificates Listing Pneumonia, Influenza, and COVID-19 (Animated GIF)

As of May 2, U.S. Mortality: Death Certificates Listing Pneumonia, Influenza, and COVID-19 (Static Image)

As of April 24, U.S. Mortality: Death Certificates Listing Pneumonia, Influenza, and COVID-19 (Animated GIF)

As of April 24, U.S. Mortality: Death Certificates Listing Pneumonia, Influenza, and COVID-19 (Static Image)

Archived COVID-NET graphics


As of September 5, age-adjusted hospitalization rates are highest among certain racial and ethnic minority groups, according to CDC’s COVID-NET. More information available in CDC’s COVID-View Report.

As of September 5, age-adjusted hospitalization rates are highest among certain racial and ethnic minority groups, according to CDC’s COVID-NET. More information available in CDC’s COVID-View Report.


As of August 8, age-adjusted hospitalization rates are highest among certain racial and ethnic minority groups, according to CDC’s COVID-NET. More information available in CDC’s COVID-View Report.

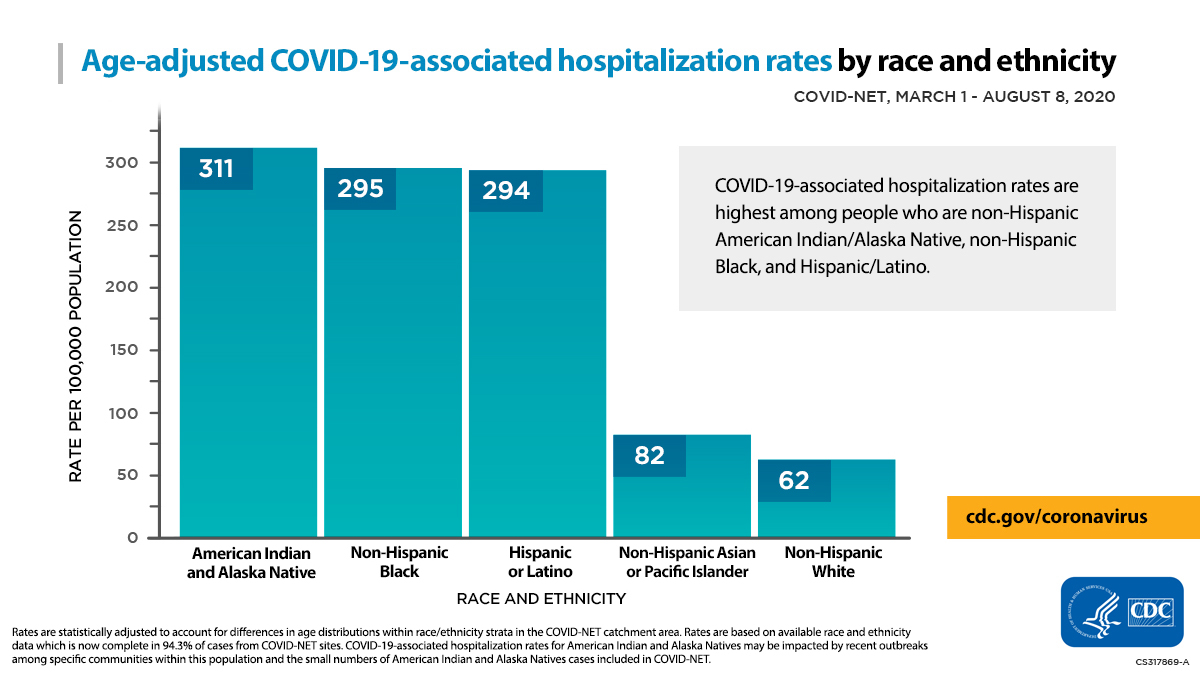
As of August 8, age-adjusted hospitalization rates are highest among certain racial and ethnic minority groups, according to CDC’s COVID-NET. More information available in CDC’s COVID-View Report.


As of July 18, age-adjusted hospitalization rates are highest among certain racial and ethnic minority groups, according to CDC’s COVID-NET. More information available in CDC’s COVID-View Report.

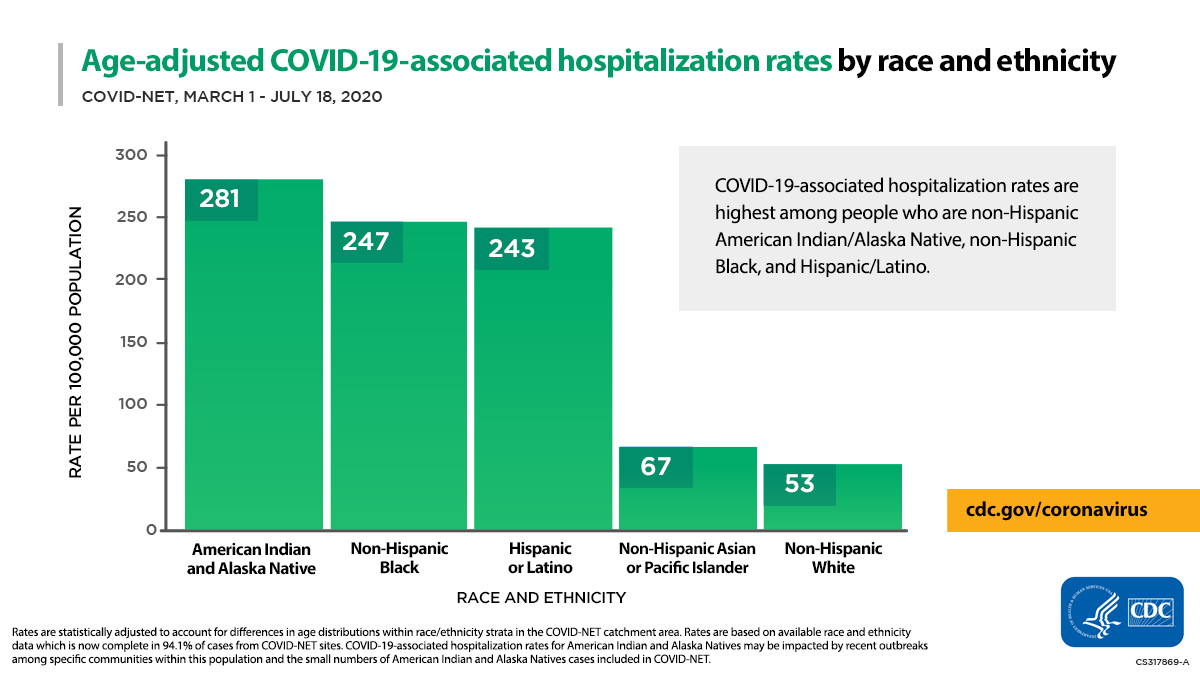
As of July 18, age-adjusted hospitalization rates are highest among certain racial and ethnic minority groups, according to CDC’s COVID-NET. More information available in CDC’s COVID-View Report.

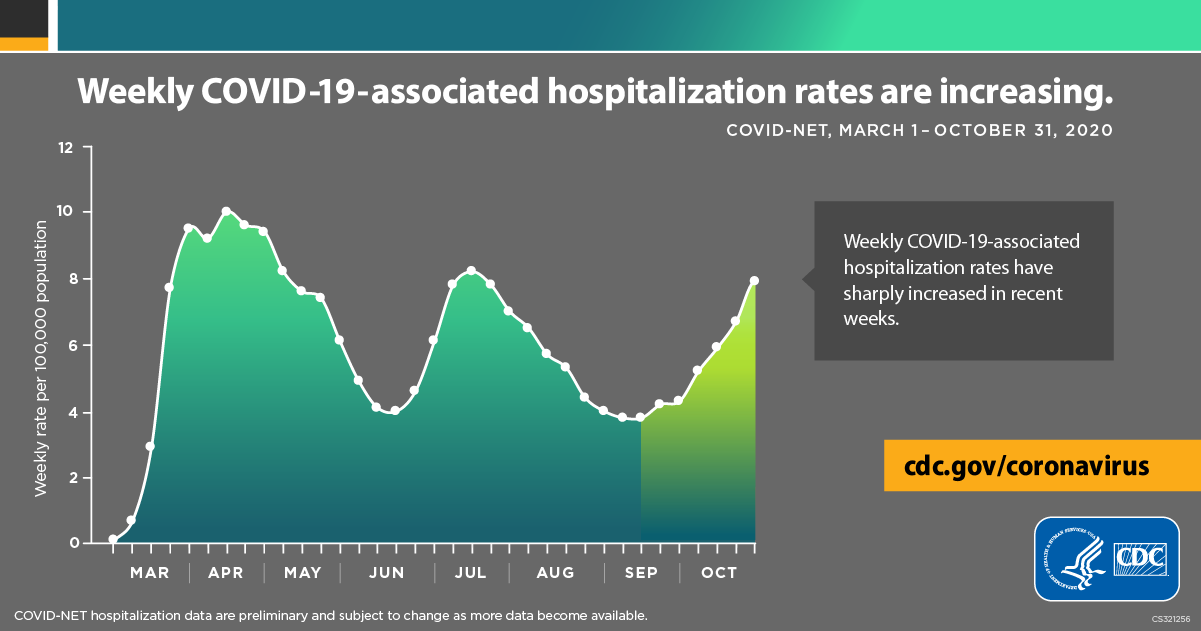
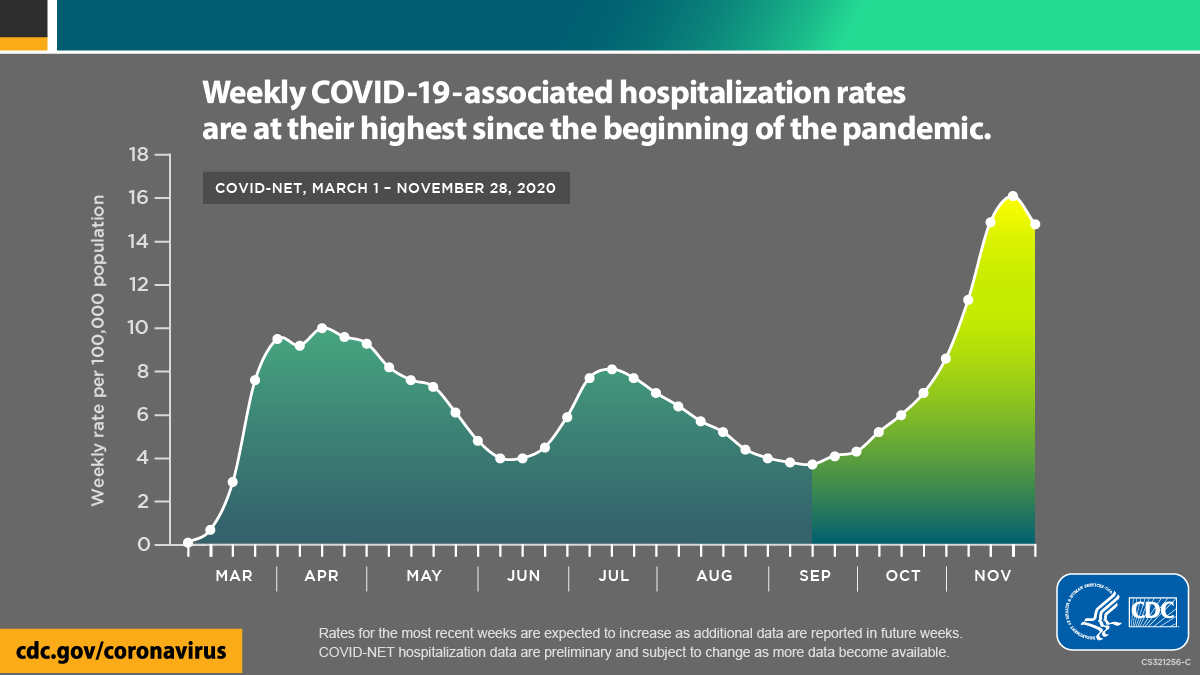
Since July 20, weekly COVID-19-associated hospitalization rates have increased, according to CDC’s COVID-NET. More information available in CDC’s COVID-View Report.

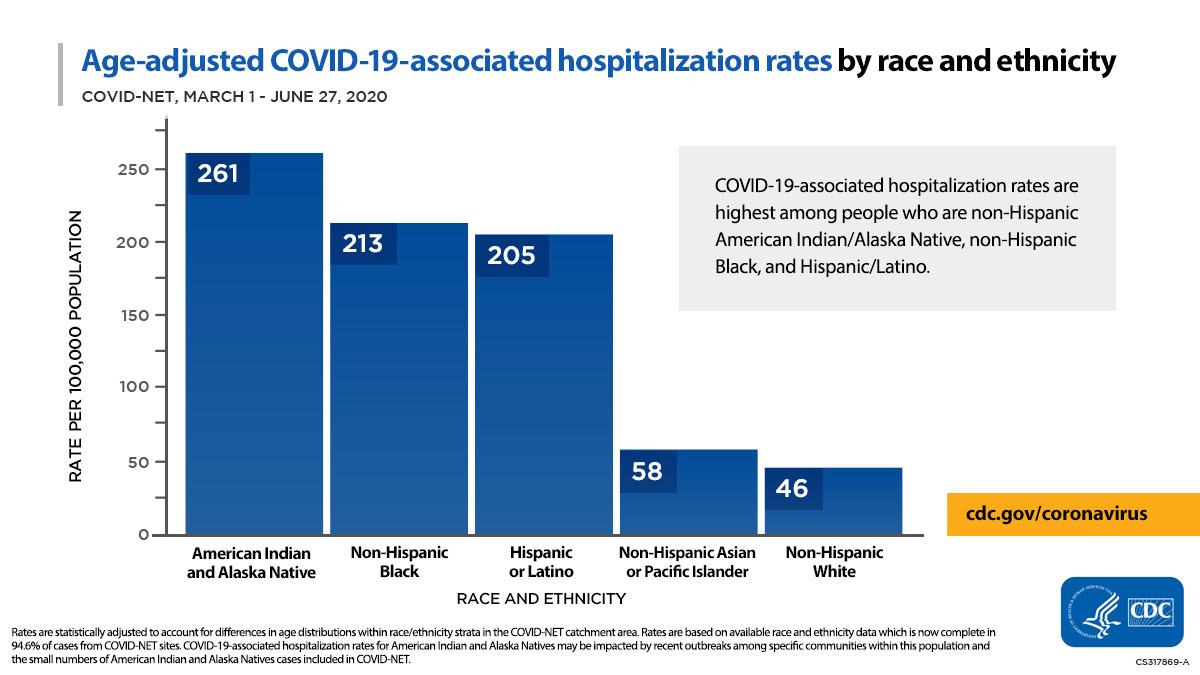
As of June 27, age-adjusted hospitalization rates are highest among certain racial and ethnic minority groups, according to CDC's COVID-NET. More information available in CDC's COVID-View Report. (Animated GIF)

As of June 27, age-adjusted hospitalization rates are highest among certain racial and ethnic minority groups, according to CDC's COVID-NET. More information available in CDC's COVID-View Report. (Static image)

As of June 6, age-adjusted hospitalization rates are highest among certain racial and ethnic minority groups, according to CDC’s COVID-NET. More information available in CDC’s COVID-View Report. (Animated GIF)

As of June 6, age-adjusted hospitalization rates are highest among certain racial and ethnic minority groups, according to CDC’s COVID-NET. More information available in CDC’s COVID-View Report. (Static image)
As of May 23, age-adjusted hospitalization rates are highest among certain racial and ethnic minority groups, according to CDC’s COVID-NET. More information available in CDC’s COVID-View Report.
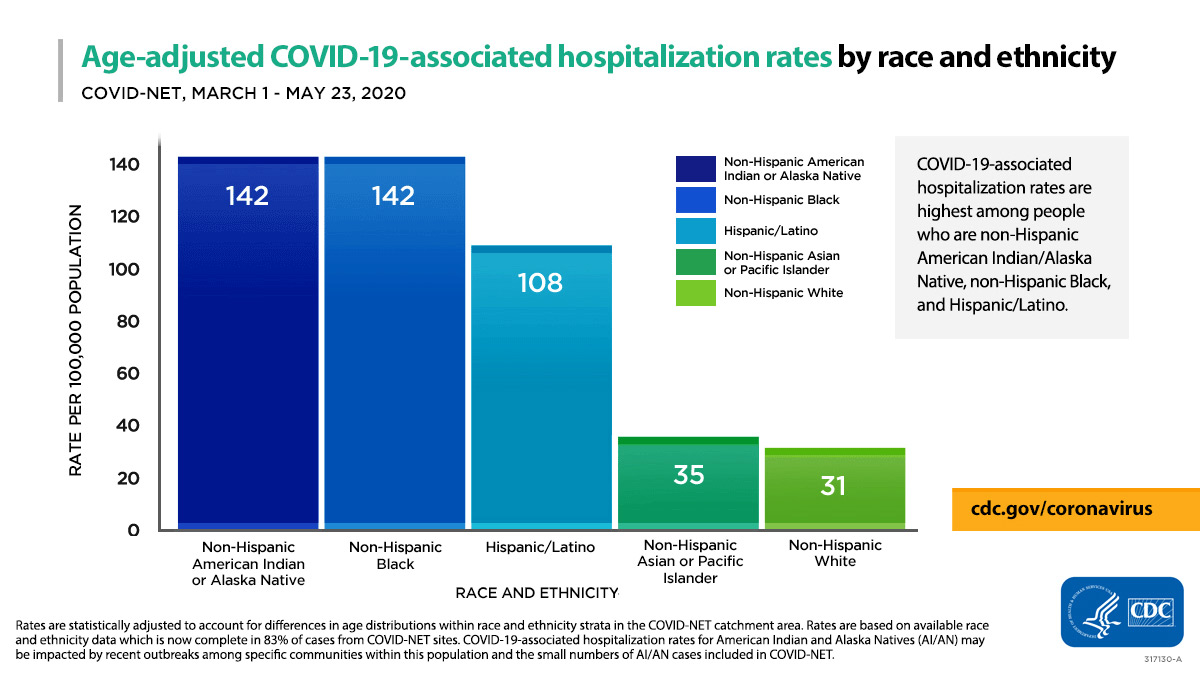
As of May 23, age-adjusted hospitalization rates are highest among certain racial and ethnic minority groups, according to CDC’s COVID-NET. More information available in CDC’s COVID-View Report.
As of April 18, when comparing to residents who live in COVID-NET counties, non-Hispanic Black people were disproportionately hospitalized with COVID-19 (Animated GIF).

As of April 18, when comparing to residents who live in COVID-NET counties, non-Hispanic Black people were disproportionately hospitalized with COVID-19 (Static Image).

As of April 11, when comparing to residents who live in COVID-NET counties, non-Hispanic Black people were disproportionately hospitalized with COVID-19 (Animated GIF).
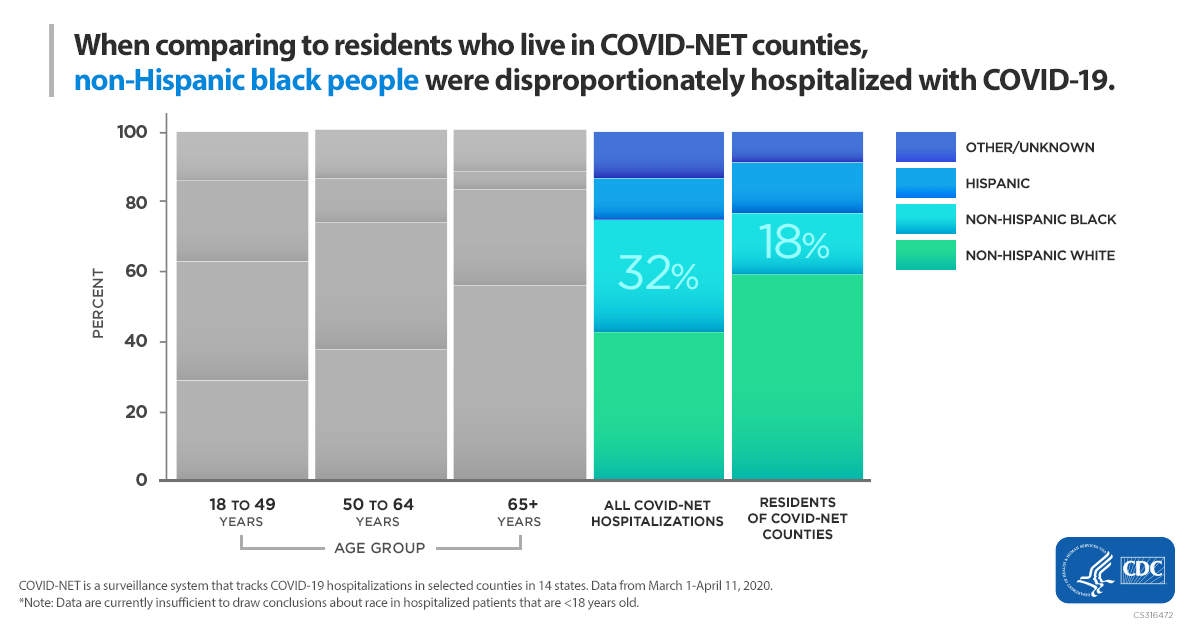
As of April 11, when comparing to residents who live in COVID-NET counties, non-Hispanic Black people were disproportionately hospitalized with COVID-19 (Static Image).
Archived COVID MMWR graphics

Visits to emergency departments for non-COVID-19 reasons dropped significantly compared to the same time period last year. Read the full report.

A May 2020 survey of public attitudes, behaviors, & beliefs regarding COVID-19 recommendations found widespread support of stay-at-home orders & nonessential business closures. Read the full report.
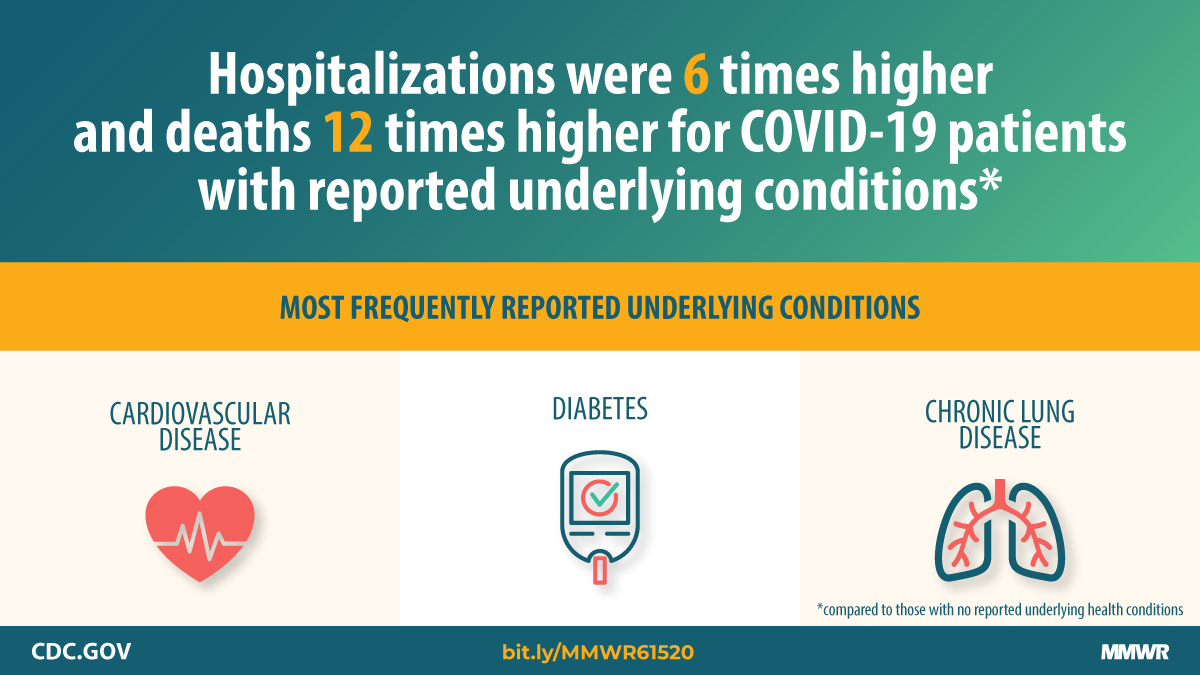
Surveillance data indicates that COVID-19 may lead to severe outcomes among those with underlying health conditions. Read the full report.

Young, healthy adults with COVID-19 may have mild or no symptoms. Read the full report.

Survey identifies gaps in knowledge about safe preparation, use and storage of cleaners and disinfectants. Read the full report.

COVID-19 spread easily at church events and then in the community in Arkansas. Read the full report.

A skilled nursing facility in Los Angeles took action to stop a COVID-19 outbreak. Read the full report.

COVID-19 Spreads Easily Following Exposure at a Choir Practice. Read the full report.
How COVID-19 can spread in a community (Video)

Non-Hispanic black people disproportionately affected by COVID-19 hospitalizations in CDC data.

Rates of hospitalization for COVID-19 increase with age.