
The California Current Marine Heatwave Tracker – An experimental tool for tracking marine heatwaves
California Current Project
What is a marine heatwave?
Marine heatwaves, or MHWs, occur when ocean temperatures are much warmer than usual for an extended period of time; they are specifically defined by differences in expected temperatures for the location and time of year.1 MHWs are a growing field of study worldwide because of their effects on ecosystem structure, biodiversity, and regional economies.
In 2014 a large MHW was identified as it began dominating the northeast Pacific Ocean. Eventually known as “the blob” (Fig. 3A.), this basin-scale MHW was unique in the history of monitoring in the California Current, and persisted until mid-2016. Researchers documented many ecological effects associated with the blob, including unprecedented harmful algal blooms, shifting distributions of marine life, and changes in the marine food web.
For recent comparison, the Northeast Pacific Marine Heatwave of 2019, also known as NEP19 (Fig. 3B) was the third largest and longest event recorded in the northern Pacific Ocean since 1982, when satellite-based remote sensing of sea surface temperatures began in a consistent fashion. NEP19 lasted 239 days and covered approximately 8.5 million km2 at its peak (Fig. 4, 5; archived images can be found here); it officially fell below our heat wave classification thresholds, and ended in terms of its surface expression, on January 17, 2020.
To further investigate past MHW events, access this table of detailed information (i.e., size, duration, distance from shore) or yearly animations.
What are the latest conditions?
(last updated 11/17/2020)
We continue tracking heatwave NEP20b, which reached a maximum size of ~9.1 million km2 in late September 2020, but has decreased in size over the last two weeks to its present area of ~7 million km2 (Fig. 2). At its maximum size, NEP20b was the 2nd largest MHW (by a very slight margin) seen in this region since satellite monitoring and analysis began in 1982 (Fig. 4).
NEP20b directly followed NEP20a, which was mainly centered to the northwest with temperatures exceeding 2.0 SD above normal. NEP20a reached a maximum size of ~4 million km2 on April 26, 2020, making it the 9th largest MHW over the past 38 years (Fig. 5). After April, however, NEP20a lost strength and eventually split into smaller fragments. NEP20b arose from one of these fragments in early June, growing steadily and re-encompassing the area once occupied by NEP20a in early August, 2020. Over the last month, NEP20b has continuously decreased in size due to cooling coastal region, but still consists of a considerably large pool of anomalously warm water just outside the US West Coast exclusive economic zone (EEZ; blue dashed line in Fig. 1). An animation of marine heatwave development during 2020 can be viewed here.
The smaller yet intensely warm area we have been tracking within the southern California Bight has now shrunk and cooled considerably in the last two weeks, splitting off from the main portion of NEP20b (Fig. 1) and leaving mostly cool or average water temperatures in this region. We continue to monitor the area, duration, and coastal proximity of surface water temperatures for these features in the northeast Pacific and communicate with other researchers and policy-makers to understand the array of possible west coast impacts.
What is the MHW Tracker?
Developed by oceanographers from NOAA Fisheries’ Southwest Fisheries Science Center as an experimental tool for natural resource managers, the California Current MHW Tracker is a program designed to understand, describe, and provide a historical context for the 2014-16 blob.2 It also produces a range of indices that could help forecast or predict future MHWs expected to impact our coast.
Because the blob dramatically affected natural resources, including economically valuable fisheries, predictive forecasts will help natural resource managers, businesses, and coastal communities anticipate changes and mitigate possible damages in the future.
The California Current MHW Tracker automatically analyzes sea surface temperature anomalies (SSTa) from 1984- present, with a particular focus on detecting the presence of significant ”blob-class” events. Sea surface temperature (SST) data were obtained from a variety of different platforms (satellites, ships, buoys) on a regular global grid at a resolution of 1/4°.
We found that blob-class MHWs can be classified based on their strength (>1.29 times the standard deviation of the SSTa field; e.g., the top 90% of the data), along with their areal extent, and duration. The original 2014-16 blob had contiguous patches which lasted more than six months and were >4,500,000 km2 in area. Based on our thresholding criteria, we suggest that the MHWs most likely to cause impacts to the west coast will be roughly 3 x the area of Alaska, come within 250 km of the coast, and last at least three months.
Project leads
Andrew Leising and Steven Bograd (SWFSC)
-
- 1. Hobday, A. J., Alexander, L. V., Perkins, S. E., Smale, D. A., Straub, S. C., Oliver, E. C., ... & Holbrook, N. J. (2016). A hierarchical approach to defining marine heatwaves. Progress in Oceanography, 141, 227-238.
- 2. Leising, A., et al. (in review)
- 3. Jacox, M. G., Hazen, E. L., Zaba, K. D., Rudnick, D. L., Edwards, C. A., Moore, A. M., & Bograd, S. J. (2016). Impacts of the 2015–2016 El Niño on the California Current System: Early assessment and comparison to past events. Geophysical Research Letters, 43(13), 7072-7080.
- 4. Jacox, M. G., Alexander, M. A., Mantua, N. J., Scott, J. D., Hervieux, G., Webb, R. S., & Werner, F. E. (2018). Forcing of multiyear extreme ocean temperatures that impacted California current living marine resources in 2016. Bulletin of the American Meteorological Society, 99(1), S27-S33.

Figure 1: Provisional daily interpolated standardized sea surface temperature anomalies (SSTa) in the California Current ecosystem. Dark outline shows the current extent of the Northeast Pacific Marine Heatwave of 2020, or NEP20, off the US West Coast and Gulf of Alaska, as delineated by values of the normalized SSTa > 1.29 standard deviations from normal. Blue dashed line represents the US West coast EEZ. An animation of daily images through 2020 can be viewed here. SST data from NOAA's Coral Reef Watch program (https://coralreefwatch.noaa.gov/satellite/index.php), with the SST anomaly calculated using climatology from NOAA's OISST dataset. Note: this image is considered provisional and is subject to change, as it uses a different SST data source than the complete MHW reanalysis (see Figure 2).
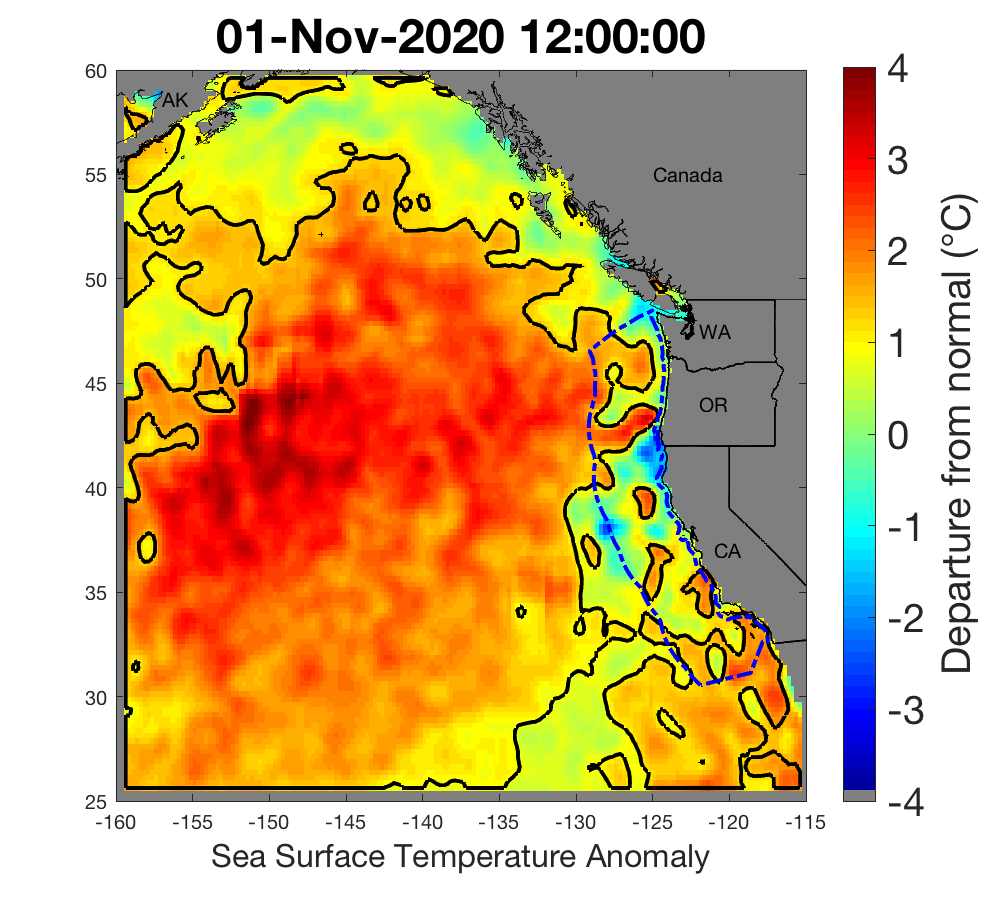
Figure 2: Science-quality (delayed 3-weeks), daily interpolated standardized sea surface temperature anomalies (SSTa) in the California Current ecosystem available for analysis of MHW presence. Figure details as in Figure 1 (above). SST data from NOAA's Optimum interpolation Sea Surface Temperature analysis (OISST; https://www.ncdc.noaa.gov/oisst), with the SST anomaly calculated using climatology from NOAA's AVHRR-only OISST dataset. NOTE: These data are currently not available.

Figure 3A.(left): The MHW known as "the blob" at its near maximum areal extent in September 2014; 3B.(right) The 2019 MHW (NEP19) at its near maximum areal extent in August 2019. Figure details as in Figure 1.

Figure 4: Retrospective analysis of sea surface temperature anomalies in the California Current region, 1982-2020. Figure shows the relatively higher strength, size, and duration of MHW events during 2014-2016 time period, as well as the most recent 2019 MHW. Horizontal line represents the area threshold for finding features likely to impact the coastal region; colors indicate relative size of simultaneously tracked MHWs, with Black = largest, Magenta = 2nd largest, and Green = 3rd largest.

Figure 5a: Retrospective analysis of sea surface temperature anomalies in the California Current region during the last 6 months. Line colors as in Figure 4; however, dotted lines indicate provisional data calculated from the Coral Reef Watch SST product, rather than the OISST data (only available 3-weeks post real-time). Figure 5b. Intensity of the largest MHW over the past 6 months (dotted line based on provisional data, as noted above). Intensity is calculated as the average standardized SSTa over the entire area of a feature; units are multiples of the SSTa SD).