
The Employment and Training Administration (ETA) Performance website will assist you in understanding how the workforce system measures, reports, and evaluates performance under the Workforce Innovation and Opportunity Act (WIOA). ETA oversees the performance accountability provision of WIOA to obtain valid, accurate, and comparable results across states to inform policy and program decision making. ETA coordinates with the Department of Education on the establishment of WIOA indicators of performance, manages the Workforce Data Quality Initiative (WDQI), and oversees the maintenance of wage record exchange systems for state and other grantees to verify performance outcomes. The Performance website provides content on these three primary focus areas and resources to help grantees and stakeholders access information on WIOA results, reporting, and guidance.
What's New?
-
Invitation to participate in an Applied Data Analytics Training Program
-
WIPS Updates: Newsletter, Logical Rules, Valid Values, & Release Notes (October 5, 2020)
-
Overview: Validating Required Performance Data Submitted by DOL Grantees: This webinar introduces the concept of data validation and its application for DOL-funded grant recipients as outlined in TEGL 23-19. ETA staff highlight the impacts of data validation requirements for WIOA titles I and III, as well as Trade Adjustment Assistance (TAA).
-
Announcing 60-day Public Comment Period for WIOA Joint ICR
The Department of Labor’s (DOL) Employment and Training Administration (ETA) is soliciting comments concerning a proposed extension for the authority to conduct the information collection request (ICR) titled, “Workforce Innovation and Opportunity Act (WIOA) Common Performance Reporting OMB Control No. 1205-0526.” The complete Federal Register Notice can be accessed at https://www.govinfo.gov/content/pkg/FR-2020-07-09/pdf/2020-14790.pdf
Contents of the ICR:
- Supporting Statement
- WIOA Statewide Performance Report Template and WIOA Local Performance Report Template (ETA-9169)
- WIOA Joint Participant Individual Record Layout (PIRL) (ETA-9170)
- WIOA Eligible Training Provider (ETP) Performance Report Specifications and WIOA Eligible Training Provider (ETP) Performance Report Definitions (ETA-9171)
-
TEGL 23-19: Guidance for Validating Required Performance Data Submitted by Grant Recipients of U.S. Department of Labor (DOL) Workforce Programs
-
TEN 25-19: Understanding Postsecondary Credentials in the Public Workforce System
-
TEN 24-19: Eligible Training Provider Reporting and Data Publication
WIOA Performance Results at a Glance
|
Participants Served |
||||
|---|---|---|---|---|
|
|
WIOA Adult |
WIOA Dislocated Worker |
WIOA Youth |
Wagner-Peyser |
|
Total |
640,822 |
413,948 |
154,120 |
3,807,065 |
|
Received Training |
158,225 |
68,076 |
53,804 |
N/A |
|
Primary Indicators of Performance |
||||
|
Employment Rate in the 2nd Quarter after Exit* |
71.3% |
70.9% |
73.1% |
68.3% |
|
Employment Rate in the 4th Quarter after Exit* |
70.9% |
71.7% |
72.6% |
67.9% |
|
Median Earnings in the 2nd Quarter after Exit |
$6,170 |
$7,377 |
$3,326 |
$5,789 |
|
Credential Attainment Rate** |
62.3% |
66.6% |
62.6% |
--- |
|
Measurable Skill Gains** |
48.0% |
43.5% |
47.0% |
--- |
*This indicator also includes those who entered into a training or education program for the Youth program.
**Credential Rate and Measurable Skill Gains do not apply to the Wagner-Peyser program.
Source: PY 2018 WIOA National Performance Summary (April 21, 2020)
Note: The Effectiveness in Serving Employers indicator of performance has not yet been defined. The Departments of Labor and Education are currently piloting three approaches with states and will establish an official indicator in subsequent guidance. For information on these pilot measures and the other indicators please refer to the Primary Indicators of Performance resource page.
WIOA Success Story Feature of the Month

Heidi came to the Michigan Works! Service Center in Coldwater after experiencing a downsizing from a company she had been employed at for ten years. Heidi had experience in proteins and agriculture, so staff from Michigan Works! Southwest discussed a variety of positions, including those available at Clemens Food Group. At the time, she was hesitant to get back into supervision but stated that she would consider it if the right position came along. Staff submitted her resume to the Food Safety Director at Clemens for a Food Safety Quality Assurance position. Heidi had several interviews and was even invited for a panel interview at the Clemens plant in Pennsylvania. Heidi received an offer for a full-time position as a Food Safety Quality Assurance Supervisor, making $27.51 per hour.
“From the beginning, my experience with Michigan Works! Southwest was nothing short of empowering and positive,” states Heidi. “With Clemens Food Group coming to Coldwater, it was my ambition to seek employment with a new, successful and growing local business.” It had been several years since Heidi last interviewed for a position. Delighted at the opportunity but nervous at the prospect of an interview, Michigan Works! Southwest set up a series of mock interviews designed to practice and prepare her job-seeking skills. “They were absolutely crucial and helpful during the entire process,” continues Heidi. “Thanks to Michigan Works! Southwest, I am thriving along with my new employer. They were always encouraging and available for questions whenever I needed them. I could never imagine going through this experience without Michigan Works! Southwest and want to extend my sincerest appreciation for what they do.”
Trends in Program Participants
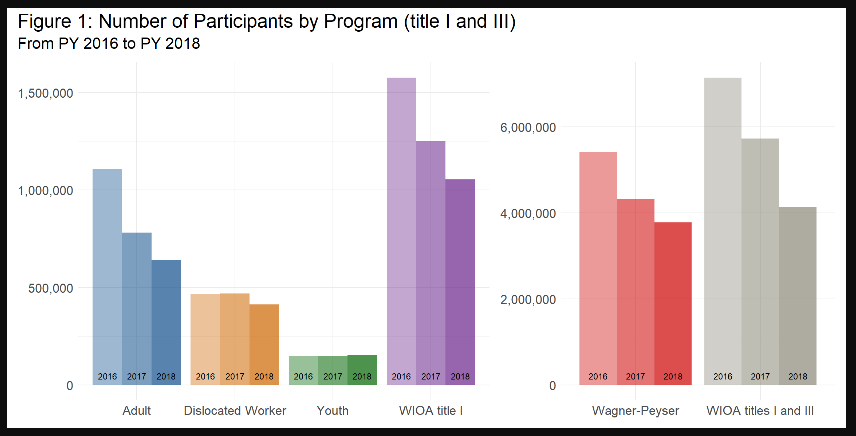
Figure 1 shows the changes in the number of participants for each program from PY 2016 through PY 2018. The WIOA Adult, Dislocated Worker, Youth, and Wagner-Peyser programs served over 5 million participants in PY 2018. The downward trend in participants continues in PY 2018 for the Adult, Dislocated Worker, and Wagner-Peyser programs. This trend is consistent with the trend in the national unemployment rate during this period. The WIOA Youth program, which is less tied to economic conditions, had an increase in participants in PY 2018.