Jumbo Content

Video Gallery

Videos (49)


[22-Nov-20] Keeping the PACE with NASA’s Plankton, Aerosol, Cloud, ocean Ecosystem Mission
 Credit: NASA’s Goddard Space Flight Center
[17-Jul-20] PACE: Persistence and Perseverance Despite Pandemic
 Credit: Ocean Carbon & Biogeochemistry 2020 Summer Webinar Series
[30-Jun-20] How Ocean Color Remote Sensing Contributes to Aquatic Biological and Biogeochemical Studies
Computer rendering of the OCI in operation. The OCI tilt will help avoid sun glint.
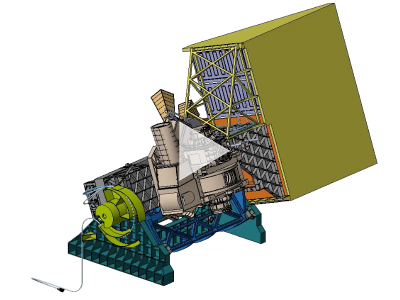
[27-Jun-20] OCI Tilt
PACE enters its integration and testing phase of development. Credit: Michael Starobin (NASA)
[04-Jun-20] NASA Ocean Ecosystem Mission Ready to Make Waves
NASA ocean color scientists, Dr. Ivona Cetinić and Aimee Neeley, demonstrate a hands-on activity on the transmission, absorption, and scattering of different colors of visible light. Credit: NASA GSFC
[15-May-19] Beyond Blue: Why Ocean Color Really Matters Webinar 2
Project Scientist Dr. Jeremy Werdell and Mission Systems Engineer Gary Davis discuss why PACE is designed to look at the ocean, tiny airborne particles, and clouds together. Credit: NASA GSFC
[30-Apr-19] Beyond Blue: Why Ocean Color Really Matters Webinar 1
A digital rendering shows the instruments and associated equipment that will be included on board the PACE spacecraft. Credit: NASA
[13-Dec-18] PACE Spacecraft In Orbit Over Earth
 Credit: NASA
[13-Dec-18] Beauty Shot of the PACE Spacecraft
In this video, the PACE spacecraft is seen from afar, and then grows larger as the viewer is brought closer to the satellite. Credit: NASA
[13-Dec-18] PACE Spacecraft Approach
In this animation, a digital model of the PACE spacecraft is shown rotating on a blank background. Credit: NASA’s Conceptual Image Laboratory
[13-Dec-18] Rotating PACE Spacecraft
PACE in orbit. Credit: <a href="http://svs.gsfc.nasa.gov/4700">NASA Scientific Visualization Studio</a>
[06-Dec-18] PACE Satellite in Orbit
This animation shows how the SSO-A Smallsat Express will deploy a record-breaking 64 satellites.
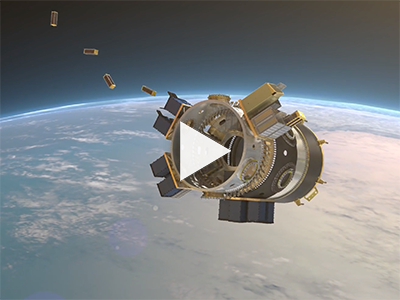
[01-Dec-18] SSO-A Smallsat Express Deployment
The SeaHawk CubeSat travels from Clyde Space Ltd in Glasgow, Scotland to the launch provider, Spaceflight Industries, in Seattle, WA. Credit: NASA GSFC
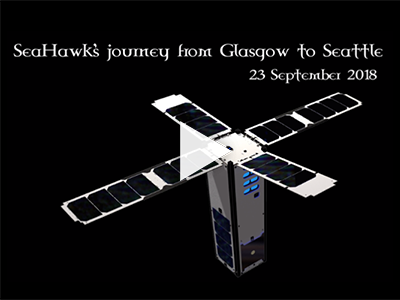
[14-Nov-18] SeaHawk → Seattle
Joaquim Goes, Research Professor at Columbia University's Lamont-Doherty Earth Observatory in New York City joins Hari Sreenivasan discuss invasive algal blooms on SciTech Now. Credit: PBS
[02-Oct-18] Invasive Algal Blooms Discussed on SciTech Now
The EXPORTS research vessels set sail for the Twilight Zone (that area between 650 and 3300 feet below the surface) to study the fate and carbon cycle impacts of microscopic underwater organisms. Credit: Kathryn Mersmann (NASA GSFC)
[08-Aug-18] Setting Sail for the Twilight Zone
This montage of ocean color and other coastal observations was created by NASA for World Oceans Month 2018. Credit: NASA Ocean
[12-Jun-18] Colorful Coastlines: Coastal Images from NASA Satellites
Global animation delineating the dominant type of phytoplankton in the ocean. Credit: The Darwin Project (MIT)
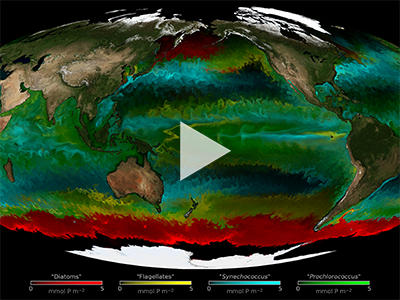
[08-May-18] Modeled Phytoplankton Distribution
This visualization follows sea salt, dust, and smoke from July 31 to November 1, 2017, to reveal how these particles are transported across the map. This visualization is a result of combining NASA satellite data with mathematical models that describe the underlying physical processes. Credit: NASA GSFC
[01-May-18] Hurricanes and Aerosols Simulation
Gene Feldman and Compton Tucker and SVS data visualizer, Alex Kukesi show how the "Living Planet" visualization was created. Credit: NASA GSFC
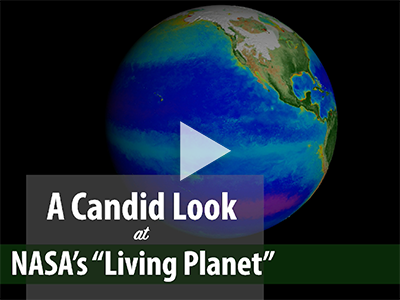
[09-Feb-18] A Candid Look at NASA’s "Living Planet"
On a BBC news video, Dr. Jeremy Werdell is interviewed about a new NASA visualization featuring 20 years of ocean color data. Credit: Paul Blake (BBC)
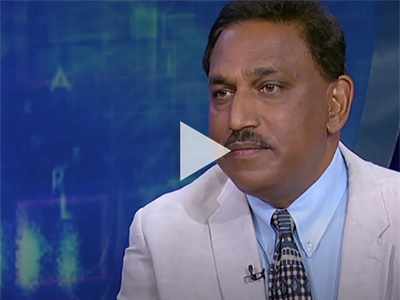
[28-Nov-17] Dr. Werdell - Ocean Color Interview (BBC)
This data visualization represents 20 years worth of data taken by SeaStar/SeaWiFS, Aqua/MODIS, and Suomi NPP/VIIRS satellite sensors, showing the abundance of life both on land and in the sea. Credit: NASA GSFC
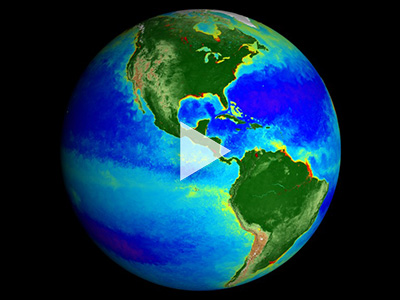
[17-Nov-17] Earth: Our Living Planet
In this video, PACE Project Scientist Dr. Jeremy Werdell comments on the new time-lapse of life on our entire planet over the last two decades, and discusses how NASA data are being used to study the health of ocean ecosystems. Credit: NASA GSFC
[17-Nov-17] Project Scientist Comments on New NASA Timelapse
This animation captures a decades-long view of life on Earth in a captivating few minutes. Credit: NASA GSFC
[14-Nov-17] Our Living Planet From Space
This data visualization shows the Earth’s biosphere from September 1997 through September 2017. It represents twenty years of data taken primarily by SeaStar/SeaWiFS, Aqua/MODIS, and Suomi NPP/VIIRS satellite sensors, and shows the abundance of life both on land and in the sea. Credit: NASA GSFC
[14-Nov-17] 20 Years of Global Biosphere
This video is part of a NASA Earth campaign focused on our Living Planet. Credit: NASA
[13-Nov-17] Changing Colors of Our Living Planet
NASA satellites collect vital data for research and can help keep an eye on tiny marine life from space. Credit: NASA GSFC
[03-Nov-17] Biodiversity
Aerosols are particles or droplets in the atmosphere. Their chemical and physical properties can have significant influences on climate and the energy budget of Earth. PACE will help monitor aerosols in the atmosphere. Credit: NASA GSFC
[03-Nov-17] Aerosols
NASA missions monitor the ocean from space to protect fisheries and human health. The detection of harmful algal blooms, like red tides, will help us avoid their negative impacts. Credit: NASA GSFC
[29-Oct-17] Harmful Algal Blooms
PACE will collect measurements in a number of areas that will contribute to fisheries management, which is vital for food security. Credit: NASA
[18-Oct-17] Fisheries Food Security
PACE will reveal new information about Earth. Credit: PACE Mission
[15-Mar-17] PACE - Observing Our Home Planet
The PACE mission will look "beyond the rainbow" to reveal new information about microscopic organisms known as phytoplankton. Credit: PACE Mission
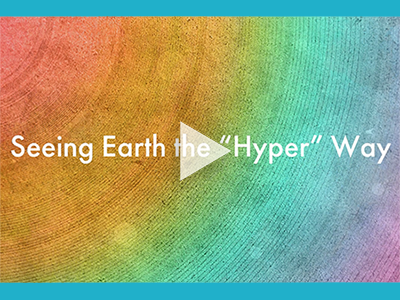
[08-Mar-17] Seeing Earth the "Hyper" Way
The HyperPro radiometer is deployed off the R/V <em>Falkor</em>. Credit: Schmidt Ocean Institute/Kirsten Carlson
[24-Feb-17] Deploying the HyperPro Radiometer
Retrieving the HyperPro radiometer. Credit: Schmidt Ocean Institute/Kirsten Carlson
[24-Feb-17] HyperPro Radiometer Retrieval
As the Sea to Space cruise wraps, take a look back at the wide-ranging specialties of the team as they discuss goals, highlights, and the challenges overcome. Credit: SOI
[19-Feb-17] Wrapping Up
Learn how the Sea to Space data will work with measurements taken from satellites to increase our understanding of fundamental processes important to life on Earth. Credit: Schmidt Ocean Institute
[13-Feb-17] Phytoplankton Up Close
Recovering samples and equipment in rough seas. Credit: SOI
[10-Feb-17] Equipment Recovery in Rolling Seas
Drawings, paintings, lasers and virtual reality: Take a tour of the instruments used on the Sea to Space Particle Investigation. Credit: SOI
[05-Feb-17] Drawings, Painting, and Lasers - Oh My!
Scientists lower a Wirewalker, an instrument designed to take numerous water-column measurements such as temperature, salinity, and oxygen. Credit: NASA Earth
[30-Jan-17] Wirewalker Deployment
An introduction to the Sea to Space expedition. Credit: SOI
[29-Jan-17] Introduction to Sea to Space
An introduction to phytoplankton and their important roles in Earth’s ecosystem. Credit: PACE Mission
[05-Jan-17] Phytoplankton Add Color to Our Ocean
Observing ocean life from shore, to ship, to satellite. Credit: PACE Mission
[01-Dec-16] How Do We Sense Life in the Ocean?
Jeremy Werdell, oceanographer at NASA’s Goddard Space Flight Center, discusses the importance of microscopic plankton in the global carbon cycle. Credit: Goddard Media Studios. Music: Molecular by Mark Hawkins
[07-Nov-16] Carbon and Climate Soundbite
This video introduces the PACE Mission. Credit: NASA GSFC Scientific Visualization Studio
[23-Feb-16] PACE Mission Introduction
Earth's oceans show a decline in microscopic plant life. Credit: Goddard Media Studios
[23-Sep-15] Earth's Oceans Show Decline in Microscopic Plant Life
Researchers find that populations of microscopic marine plants - phytoplankton - have decreased by 1% per year in the northern hemisphere. Credit: Goddard Media Studios
[12-Sep-14] Phytoplankton Levels Dropping
This video shows changes in chlorophyll (milligrams per cubic meter) over time based on data from NASA's Aqua/MODIS instrument. Credit: NASA
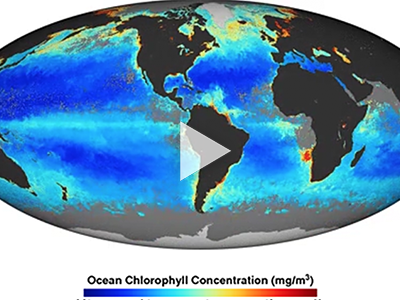
[03-Jan-12] Ocean Chlorophyll Concentration (2009-2012)
Particles affect how the atmosphere reflects and absorbs visible and infrared light. Higher Aerosol Optical Depth values indicate hazy conditions while low values correspond to clear skies.
[02-Jan-12] Global Monthly Aerosol Optical Depth (2000-2015)
Cloud Fraction maps show what fraction of an area was cloudy on average for each month. Colors range from blue (no clouds) to white (very cloudy).
[01-Jan-12] Global Monthly Cloud Fraction (2000-2015)