- Search
- The Impacts of Climate Change on Human Health in the United States: A Scientific Assessment
- Featured Publications
- All Publications
- contributors
Figure : change-in-number-of-extreme-precipitation-events
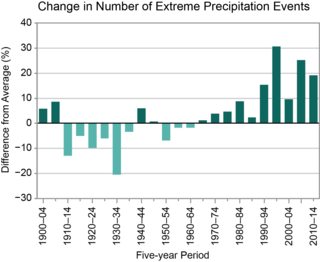
Change in Number of Extreme Precipitation Events
Figure 1.2
Cooperative Institute for Climate and Satellites - NCKenneth E. Kunkel
This figure appears in chapter 1 of the The Impacts of Climate Change on Human Health in the United States: A Scientific Assessment report.
Time series of 5-year averages of the number of extreme 2-day duration precipitation events, averaged over the United States from 1900 to 2014. The number is expressed as the percent difference from the average for the entire period. This is based on 726 stations that have precipitation data for at least 90% of the days in the period. An event is considered extreme if the precipitation amount exceeds a threshold for a once-per-year recurrence. (Figure source: adapted from Mellilo et al. 2014)dd5b893d-4462-4bb3-9205-67b532919566
Copyright protected. Obtain permission from the original figure source.
The time range for this figure is January 01, 1900 (00:00 AM) to December 31, 2014 (23:59 PM).
This figure was created on October 29, 2014.
The spatial range for this figure is 24.50° to 49.38° latitude, and -124.80° to -66.95° longitude.
Provenance
This figure was derived from Climate Change Impacts in the United States: The Third National Climate AssessmentThis figure was derived from dataset Global Historical Climatology Network - Daily
Alternatives : JSON YAML Turtle N-Triples JSON Triples RDF+XML RDF+JSON Graphviz SVG
