


Get daily satellite images and information about melting on the Greenland ice sheet. We post analysis periodically as conditions warrant.

Click an image for a high-resolution version.
 Scientists
 Research Grants
 Scientific Publications
 Informatics Research
 NSIDC Scientific Expeditions
On Thin Ice:
Expedition to a Crumbling Ice Shelf
 Scientists blog from Antarctica and provide a glimpse of what it's like to do research in the field. Read their blog ...
Current Conditions
Icelights: Answers to your burning questions about ice and climate
![]() What's hot in the news around climate and sea ice and what are scientists talking about now? Read more...
What's hot in the news around climate and sea ice and what are scientists talking about now? Read more...
What is the Cryosphere?
When scientists talk about the cryosphere, they mean the places on Earth where water is in its solid form, frozen into ice or snow. Read more ...


Get daily satellite images and information about melting on the Greenland ice sheet. We post analysis periodically as conditions warrant.
Click an image for a high-resolution version.
Daily melt extent mapping is suspended for the winter. Calibration of yearly melt detection requires analysis of the springtime snow conditions by a separate program. See our March 18, 2013 post for more discussion of melt calibration.
Our interactive chart supports a retrospective look at past Greenland melt seasons. This will remain available for our users.
We will resume the daily image updates in April 2021.
The 2020 melt season in Greenland is over, finishing thirteenth for cumulative melt-day extent in the 42-year satellite record. Melt extent was greater than any year prior to 2002, with about 70 percent of the ice sheet experiencing some melting. Melting was moderately intense in the northeastern region but less so in the southwest, where in recent high-melt years the ice sheet has been losing mass and exposing bare ice. Much of the upper elevation areas of the ice sheet saw no melting this year. The balance between snow and rain input and melt runoff indicates a small net loss of ice this year. This does not include the imbalance caused by ice flow.

Figure 1. The top left map of the Greenland Ice Sheet shows the total number of surface melt days from January 1 through October 31, 2020. The top right map shows the difference between total 2020 melt days and the number of 1981 to 2010 average melt days from April 1 through October 31. The lower graph shows daily area in square kilometers of surface melting from April 1 to October 31, 2020, with daily melt extent trends for the preceding four years.
Credit: National Snow and Ice Data Center/T. Mote, University of Georgia
High-resolution image

Figure 2. This graph shows the cumulative melt day area for Greenland for 2020, 2019, 2018, and 2012, as well as the 1981 to 2010 average and typical ranges of cumulative melt day area.
Credit: National Snow and Ice Data Center
High-resolution image
The total aerial extent of surface melting (total melt-day extent) through October 31 is slightly above the 1981 to 2010 average at 23.10 million square kilometers (8.92 million square miles) for 2020 versus 22.00 million square kilometers (8.49 million square miles) for the 1981 to 2010 average. Melting was intense in the northeastern section of the ice sheet, with 20 to 25 additional melt days than average, and moderately intense in the southwestern section of the ice sheet with 10 to 20 additional melt days (Figure 1). The peak melt day for 2020 was on July 10, when 551,000 square kilometers (213,000 square miles), or 34 percent of the ice sheet surface, melted. There were two later melt events of note, on August 20 when extensive areas in northwestern Greenland melted totaling just over 20 percent of the ice sheet, and a late event on October 17, limited to the southwestern ice sheet totaling under 3 percent of the ice. Overall the pace of melt during the 2020 season was close to average until late June when a moderately prolonged period of above-average melt added to the cumulative total, bringing it to the upper part of the interquartile range (Figure 2). Thus, the 2020 total melt extent tracked at a level larger than about 75 percent of past years in the satellite record after late June.
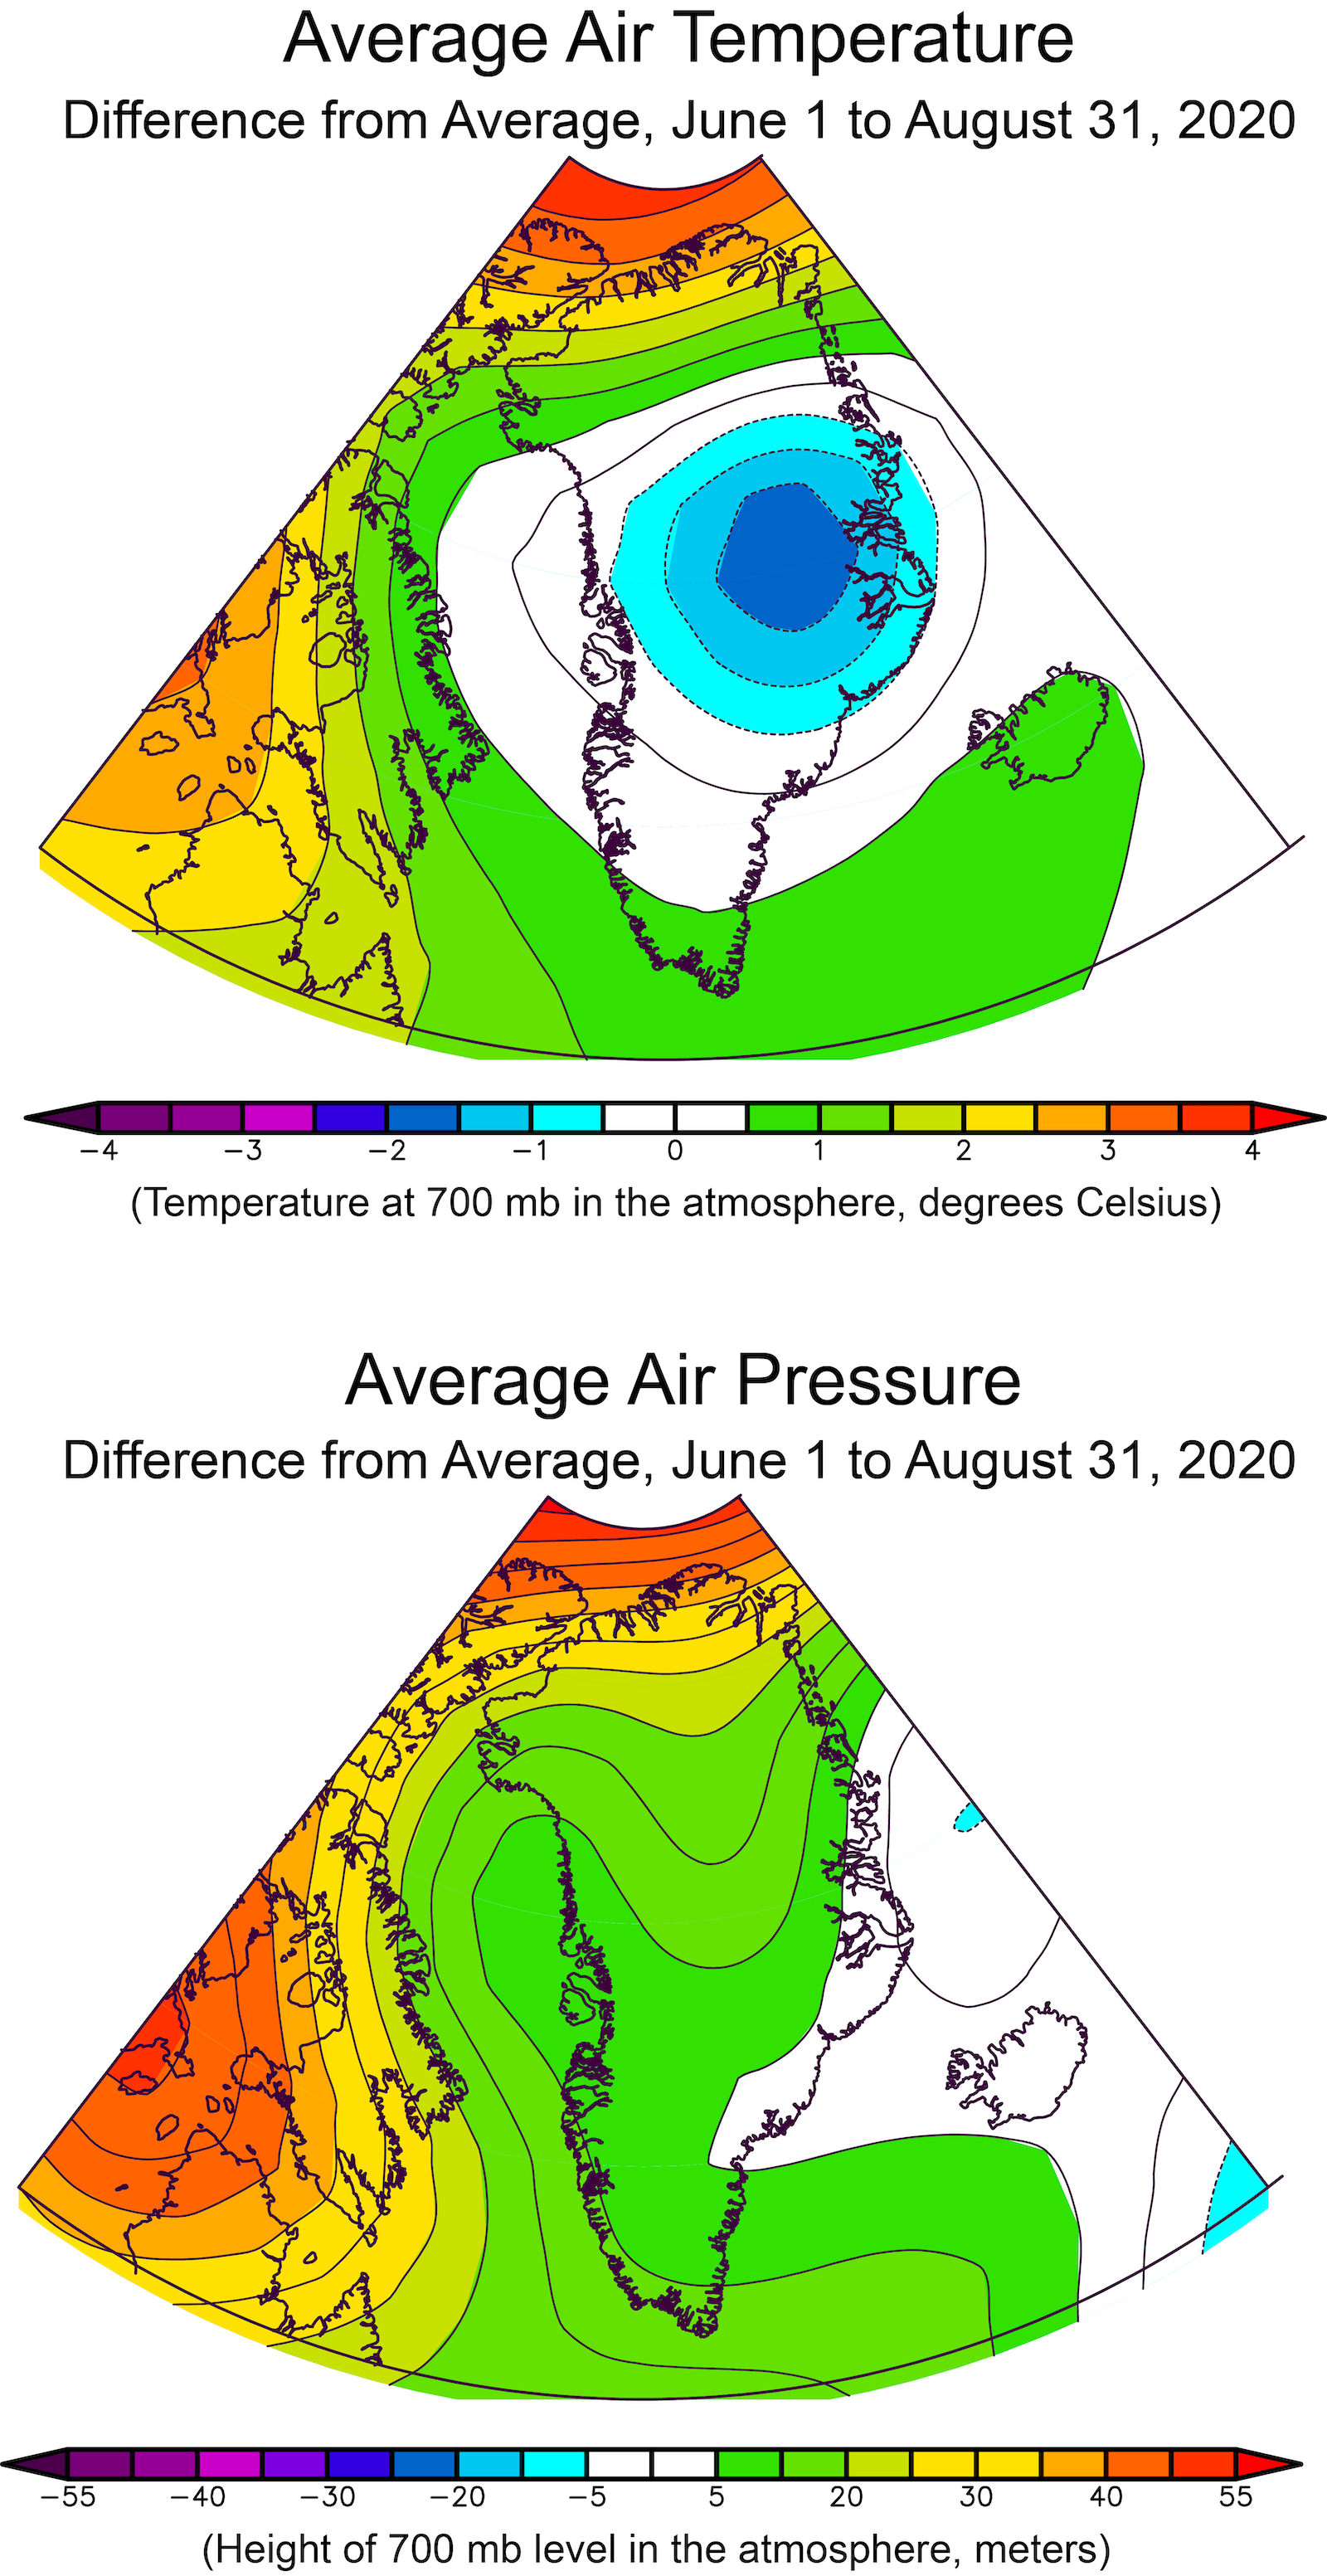
Figure 3. The top plot shows average air temperature as a difference from the 1981 to 2010 average at the 700 mb level, or about 10,000 feet above sea level, from June 1 through August 31, 2020. The bottom plot shows height difference from average for the 700 mb pressure level in the atmosphere for the same period.
Credit: National Centers for Environmental Prediction (NCEP) Reanalysis data, National Center for Atmospheric Research
High-resolution image

Figure 4. Cumulative degree days (the sum of the difference between the freezing point, 0 degrees Celsius, and the maximum temperature each day for the spring-summer melt season for two automatic weather stations in Greenland, at Nuuk (NUK_L) and Thule (THU_L).
Credit: Programme for Monitoring of the Greenland Ice Sheet (PROMICE)
High-resolution image
Air temperatures above Greenland were generally near average over the summer months this year (Figure 3). Higher-than-average temperatures, with up to 3 degrees Celsius (5 degrees Fahrenheit) were limited to the far northern flank of the ice sheet, and significantly lower-than-average temperatures of 1.5 to 2 degrees Celsius (3 to 4 degrees Fahrenheit) near the Scoresby Sund in east-central Greenland. Though local surface winds can be quite high under certain conditions, air pressure patterns over the ice sheet indicated generally light regional winds that favored a westward to southwestward flow. Air off the far northern Atlantic Ocean in the Norwegian Sea swept in across the ice sheet. This pattern of temperature and pressure was remarkably consistent through all the individual months of June, July, and August.
A look at weather station data along Greenland’s west coast reflects the regional temperature trends (Figure 4). Nuuk, the capital of Greenland on the central southwestern coast, had summer temperatures very close to average for that region. Thule, near a large US military base in northwestern Greenland, had a much warmer than average summer, but was still cooler than Nuuk, which is nearly 1,500 kilometers (580 miles) to its south.

Figure 5a. This graph shows surface mass balance (SMB) for Greenland’s 2019 to 2020 autumn-winter-spring season (red line) relative to a 1981 to 2010 reference period. SMB is the sum of snowfall and rainfall minus any evaporation or runoff. Several recent high-melt years are shown for comparison. The estimates come from a model based on daily weather measurements.
Credit: X. Fettweis, Université of Liège, Belgium/MARv3.11 regional climate model
High-resolution image

Figure 5b. This bar graph show net surface balance as a result of input vs output into the ice sheet for the 1978 to 2020 period based on reanalysis of weather data and snow-atmosphere model of process from MARv3.11. Net snow and rain input are shown in yellow, melt and evaporation loss in orange, and net surface balance in green. The 2020 season, which runs from September 1, 2019 to August 31, 2020 in this analysis, shows a net loss smaller than many recent years, but larger than most years in the previous century. The 10-year average line includes estimates from before 1978 on the left edge of the graph.
Credit: X. Fettweis, Université of Liège, Belgium/MARv3.11 regional climate model
High-resolution image
Net surface mass balance (SMB), which is the snow and rain input minus evaporation and melt runoff, was only slightly less than average at 314 billion tons, or 56 billion tons below the 1981 to 2010 average, according to the MARv3.11 climate model (Figure 5a). This can be compared to the major melt and ice loss years of 2012, 2019, and others in the last decade with values between 225 and 325 billion tons below average (Figure 5b). The 2020 regional pattern had low SMB all along the western side of the ice sheet but near average to slightly above average along most of the eastern coastal areas.

Figure 6. (a) White and colored areas show the extent of the region where early ice flow maps (1985-1990) can be compared with images acquired up to 30 years later. Observations around the ice sheet margin (b-d) show new details about how the ice sheet is responding (faster flow in red, slower in blue). Responses include narrowing of fast flow regions, rerouting of ice flow, and abandonment of some glacier outlets.
Credit: Moon, T. A., et al., 2020, Journal of Geophysical Research: Earth Surface
High-resolution image
With a growing record of satellite imagery and advances in image processing, scientists are now able to better explore the changes to Greenland’s coastal area in the last three decades. A new paper by our colleagues Twila Moon, Alex Gardner, Bea Csatho, Ivan Parmuzin, and Mark Fahnestock analyzes how ice outflow speed and surface melting have increased. Every year since 1998, the ice sheet has overall lost ice. Satellite sensor improvements, such as on Landsat 7 and 8, and improvements in image processing for ice flow mapping (see ITS_LIVE) have created an improved set of maps for documenting changes in Greenland’s ice outflow. These maps reveal substantial reconfigurations of several major glaciers (Figure 6). For many fast-flowing glaciers, the research team found that the central channel of fast flow has sped up, but the edges of the channel have slowed, effectively narrowing the width of the fast flow area. Researchers also see evidence for ice flow rerouting and even abandonment of some glacier outlets. While thinning ice and retreats from the ice edge change the ice sheet, the shape of the land beneath the ice remains mostly unchanged. In some areas the ice cannot flow over the landscape via the historical pathways. This reconfiguration of the ice sheet has important implications for other elements of the Greenland system, such as the flow of water beneath the ice sheet, and the movement of sediment and nutrients into the fjords. The new data collected by ITS_LIVE are allowing researchers to characterize and understand what rapid deglaciation looks like on scales that matter for wildlife, fisheries, infrastructure, and communities.
Moon, T. A., A. S. Gardner, B. Csatho, I. Parmuzin, and M. A. Fahnestock. 2020. Rapid reconfiguration of the Greenland Ice Sheet coastal margin. Journal of Geophysical Research: Earth Surface, 125, doi:10.1029/2020JF005585.
Tedesco, M. and X. Fettweis. 2020. Unprecedented atmospheric conditions (1948–2019) drive the 2019 exceptional melting season over the Greenland ice sheet. The Cryosphere, 14, 1209–1223, doi:10.5194/tc-14-1209-2020.
The 2020 Greenland Ice Sheet SMB simulated by MARv3.5.2 in real time
Polar Portal’s Greenland surface conditions
Programme for Monitoring of the Greenland Ice Sheet (PROMICE)
Jason Box, Geological Survey of Denmark and Greenland (GEUS) in Copenhagen, Denmark
Xavier Fettweis, Université of Liège in Belgium, providing the MARv3.11 model results
Twila Moon, National Snow and Ice Data Center
Thomas Mote, University of Georgia
![]() Home | Contact Us
Home | Contact Us
© 2019, National Snow and Ice Data Center :: Advancing knowledge of Earth's frozen regions

