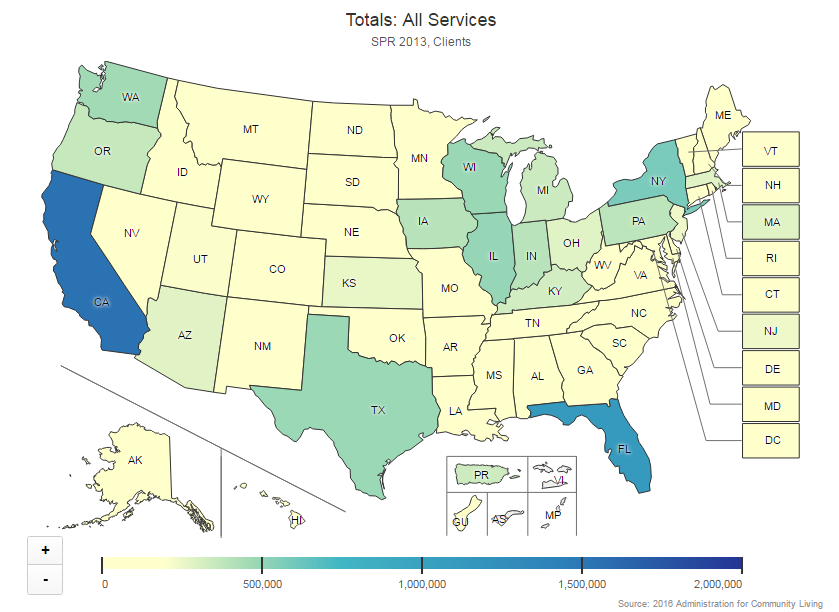
The following map illustrates an example of a variable that is heavily influenced by state populations.
California and Florida are a dark color associated with the high end of the variable scale while most of the states in the middle of
the country are a light color associated with the low end of the variable scale. Users should not assume that Florida and California are performing
significantly better than most of the other states.