- Region
- Data Type
- Focus Area

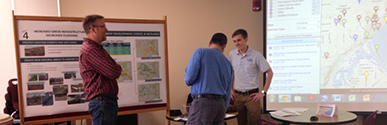
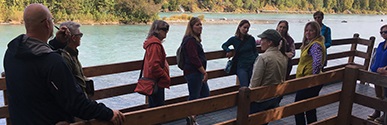
County departments identify specific actions to adapt to climate change through the Roadmap for Adapting to Coastal Risk training.

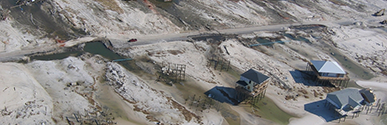
C-CAP data and additional land cover analysis highlight the loss of forests and related ecosystem services following Hurricane Katrina.
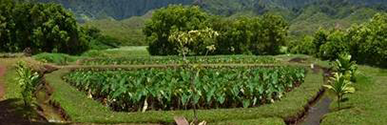
C-CAP data helped in the development of a conservation plan for the Yaquina watershed.

Using OpenNSPECT, managers in Puerto Rico assessed whether green infrastructure would help lessen sediment and runoff into coral-inhabited waters.
Monmouth University class uses ocean economy and sea level rise data to teach students about the economic benefits of the ocean, and the implications of human use.

The Sea Level Rise and Coastal Flooding Impacts Viewer illustrated informational pieces and their impact on resilience planning efforts, and it identified existin...

C-CAP data were used to produce additional land cover information to assess the risk of fire and the proximity to urban developments.

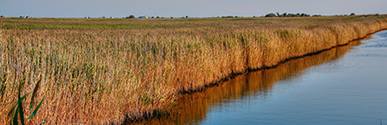
Gulf Coast models and data help managers detect wetland areas that need monitoring in the face of sea level rise.
New Jersey is engaging communities in hazard mitigation planning through the use of vulnerability assessment tools.

OpenNSPECT and the Habitat Priority Planner were used to assess land based threats and prioritize restoration areas.

Environmental science undergraduate students at Broward College examine global environmental change using NOAA’s Sea Level Rise Viewer.

The Sea Level Rise and Coastal Flooding Impacts Viewer data helped local planners identify the impacts of shoreline armoring on seagrass habitats.
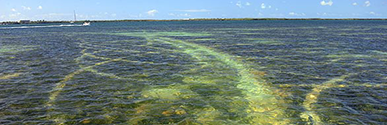
High-resolution imagery was used to assess and monitor the effect of boating activity on seagrass meadows in Redfish Bay.

An analysis of the economic benefits of the Millbridge public pier and boat launch helps the community and local industries justify spending to remedy the effects...
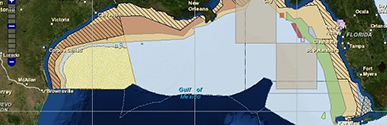
A new report provides a series of indicators to assess the status of the Gulf of Mexico socioecological system.
C-CAP data were used to produce additional land cover information to assess the impact of impervious surface on water supply.
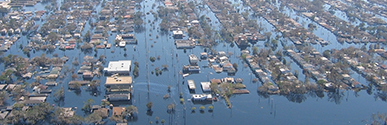
C-CAP data were used to evaluate the impacts of Hurricane Katrina in Breton Sound, Louisiana, and assess how this area had recovered almost one year later.

Researchers used land cover and change data for an ecosystem services valuation of the natural landscape.

NOAA Sea Level Rise and Coastal Flooding Impacts data helped perform an inundation vulnerability assessment in Virginia.

Coastal Flood Exposure Mapper was used in South Florida to communicate coastal flooding and climate risks to residents.

Florida regional planning councils build local and regional capacity for identifying hazard and climate vulnerabilities to better inform local planning efforts.

Coastal Flood Exposure Mapper was used to communicate coastal flooding and climate risks to residents.

The Coastal Resilience Long Island tool is being used by decision makers to gain a better understanding of ecological, social, and economic impacts from coastal h...

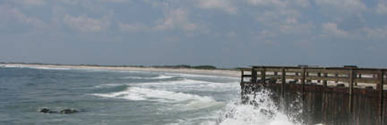
The Beachfront Vulnerability Index helps communities become more resilient to storm surge and erosion.
Coastal Inundation Mapping training provided partners with skills needed to recover from, and plan and prepare for, flood hazards.

A research reserve adapted tools and maps to help communities build resilience.

The Sea Level Rise Viewer and a NOAA resilience grant enabled partners in this port city to picture sea level rise risks and strengthen their resilience and recov...

A participatory process was used to map coastal-use data to reduce anthropogenic threats to coral reefs.
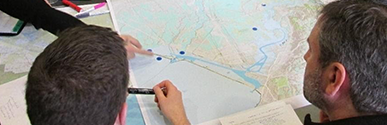
Participatory mapping incorporates traditional knowledge into coastal planning and restoration.
A custom Wetland Benefits Snapshot and sea level rise maps were used to educate residents of several counties in Maine, Massachusetts, and New Hampshire.

The Sea Level Rise Viewer helps communicate the importance of planning for future risks.

Benthic habitat maps were used to support conservation and restoration efforts in New York’s South Shore Estuary Reserve.

The Sea Level Rise Viewer and Digital Coast data helped in the development of a flood risk tool to serve the planning needs of local communities.
NOAA’s National Marine Fisheries Service uses data from MarineCadastre.gov as the authoritative source for creating GIS fisheries regulatory boundaries.

South Carolina Aquarium created an application based on the Sea Level Rise Viewer that allows the public to visualize the potential direct impacts of sea level ri...

A customized viewer was designed using inundation data provided by the Sea Level Rise and Coastal Flooding Impacts Viewer.

Researchers used C-CAP high-resolution land cover data to characterize the land adjacent to mangroves under study for carbon sequestration.

Four counties joined forces with other agencies and organizations to agree upon consistent methods for mapping sea level rise to better prepare for sea level rise...

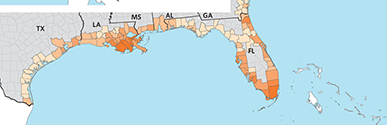
Researchers used Economics: National Ocean Watch (ENOW) data from the Ocean Jobs Snapshot to develop baseline economic profiles for 70 East Coast communities vuln...

Participatory mapping techniques helped establish a National Scenic Byway on Edisto Island, South Carolina.

New Hampshire communities used the Roadmap for Adapting to Coastal Risk to assess and address vulnerabilities and work toward reducing risk.
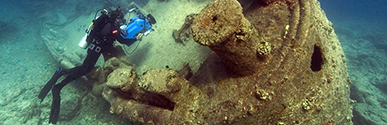
Benthic habitat data and imagery help monitor change in the Klawock Lagoon after the construction of a culvert to restore ocean access.
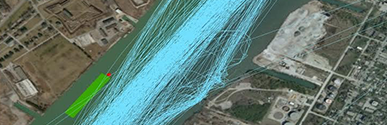
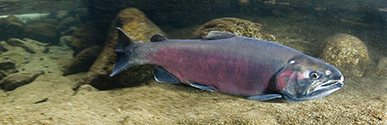
Vessel traffic data help in the establishment of fish spawning habitat for lake sturgeon, walleye, and other native fish.

Harbor planners used ENOW data to tailor their maritime economy profile and identify ocean-related businesses at a city level.
Great Lakes coastal zone management programs brought together partners to identify and evaluate potential habitat projects, along with data needs and gaps, throug...

Land cover change data and technical assistance from C-CAP were provided for the EPA’s Climate Change Indicators in the United States report.

Watershed managers in Puerto Rico used OpenNSPECT to evaluate how effectively hydroseeding restores highly erodible lands to protect corals.
The Coastal County Flood Exposure Snapshot is helping service organizations develop hazard preparation and recovery plans to assist vulnerable communities.

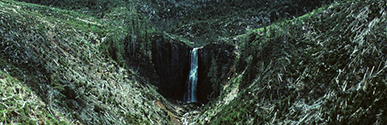
Pacific Historic Aerial Imagery from NOAA’s Office for Coastal Management helped identify sedimentation sources in Maui.
Sea level rise data helped users assess future population and areas most affected by sea level rise.

Topographic and bathymetric data collected using the Coastal Geospatial Services Contract support multiple partner needs.

An interactive mapping portal aids the Georgia Coastal Management Program in evaluating offshore projects and proposals, including energy projects.
Florida Ocean Alliance developed strategies to help strengthen the state’s blue economy.

OceanReports was used to better track an algal biomass for mariculture that does not require traditional infrastructure and gear.
A community open house helped local constituents understand flood-related impacts and costs as well as how to implement green infrastructure techniques to reduce ...
The Sea Level Rise and Coastal Flooding Impacts Viewer helped a barrier island community develop an adaptation plan to prepare for and adapt to sea level rise.
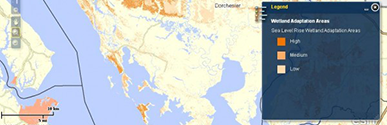
Maryland used the Sea Level Affecting Marshes Model (SLAMM) to identify high-priority conservation areas that allow for wetland migration and future wildlife habi...

The Sea Level Rise Viewer helped in identifying major metropolitan energy infrastructure at risk from climate change and sea level rise.

MarineCadastre.gov data sets used to visualize risks if the Mid- and South Atlantic coast is open to offshore drilling.

An up-to-date C-CAP land cover map and historical habitat data helped restoration planners in the lower Columbia River.

A coastal community identified areas vulnerable to flooding after recent events caused localized impacts.

Automatic Information System (AIS) data from MarineCadastre.gov helped identify wind planning area conflicts.

C-CAP high-resolution land cover data helped identify watersheds where human land-use activity contributes to sediment and contaminants that impact coral reefs.

Florida’s emergency responders and public health workforce explore data about the community to understand health and social equity implications of sea level rise ...

Researchers and land managers utilized NOAA land cover data to identify watershed stressors along Minnesota’s North Shore streams.
Mississippi’s Jackson County Utility Authority used the Sea Level Rise Viewer to identify a safe location for a new wastewater treatment facility.

The Coastal County Snapshots – Flood Exposure tool illustrates the importance of updating critical infrastructure maps for coastal parishes in Louisiana.

Coastal flood Web-mapping applications help coastal managers in New England visualize and enhance awareness of coastal flooding.

Inundation layers from the Sea Level Rise Viewer were incorporated into local hazard mitigation plans to help communities prepare for sea level rise and coastal i...

Lidar data, the Sea Level Rise Viewer, and other Digital Coast resources address the specific challenges of building climate resilience across diverse communities...

Coastal conservation groups used the NatureServe Vista decision-support system to create new maps that aid in preservation of Georgia’s coastal habitat.
High-resolution flood data incorporated into the Coastal Flood Exposure Mapper helps inform planning decisions.
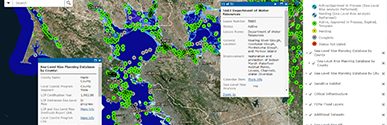
MarineCadastre.gov reduces the time and money it takes to compile spatial data for regional marine planning portals.

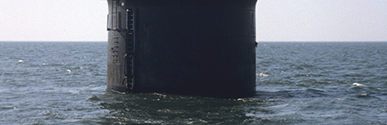
The Bureau of Ocean Energy Management uses vessel traffic data when determining stakeholders to be involved in conversations regarding offshore planning areas.

Three decision-support tools were used to demonstrate the innovative application and integration of tools for land-use planning and ecosystem management.

The Lower Columbia Estuary Partnership collaborated with C-CAP to obtain a more detailed and nationally standardized land cover product than originally planned fo...
C-CAP data were used to develop a decision-support framework and geospatial toolbox to prioritize wetland restoration efforts.
Benthic habitat data and imagery supported an ecosystem based management project in Humboldt Bay and restoration efforts in the Eel River Estuary.

With technical assistance from NOAA’s Coastal Change Analysis Program, the Lower Columbia Estuary Partnership developed a classification tailored to the Lower Col...

ENOW helped researchers analyze the spatial overlap of ecosystem services, environmental stressors, and human uses to guide prioritization in project planning.

High-resolution elevation data were used to create inundation maps for various flood levels at river forecast locations.
MARCO uses NOAA’s participatory mapping process to develop regional data and products about recreational ocean uses.

C-CAP data helped identify priority urban forests, which enhance the health of coastal ecosystems and the resilience of coastal communities.

C-CAP and lidar data were used to model potential future growth and land cover change.

N-SPECT was used to estimate the amount of sediment transported to Pelekane Bay.
Shoreline suitability models helped identify potentially successful locations for nature-based infrastructure in Casco Bay, Maine.
Washington State worked with C-CAP to improve wetland mapping and produce land cover data quickly and cost effectively.

High-resolution digital aerial imagery and topographic lidar support multiple applications throughout NOAA.

Emergency managers have easy access to charts and graphs that assess a county’s exposure to flooding, dependence on the ocean, and wetland benefits.

The City of Ocean Springs used the Sea Level Rise Viewer to engage residents in land-use planning decisions to mitigate future flood hazards.

This project examined conservation features and spatial data as part of a systematic planning strategy to build coral reef resilience through the effective manage...

A guide helps communities identify and prepare for coastal hazards that might impact their water-dependent businesses.

The Coastal Inundation Mapping training, Roadmap for Adapting to Coastal Risk approach, and other NOAA resources aided New York partners in mapping and assessing ...

Data from the Sea Level Rise and Coastal Flooding Impacts Viewer was used to assess vulnerability and provide recommendations at three publicly accessible waterfr...

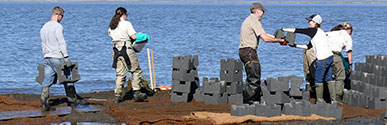
Communities in Puerto Rico learn green infrastructure techniques for enhancing resilience to hazards.
OpenNSPECT helped identify potentially restorable wetlands in an effort to manage and control nonpoint source pollution.

American Samoa can better manage and monitor water quality and other issues with high-resolution hydrographic data derived from Digital Coast lidar data.

C-CAP data and OpenNSPECT were used to identify erosion prone-areas on Lana‘i Island.

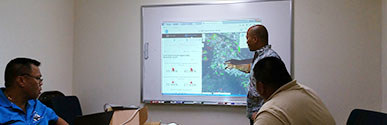
Teachers used Digital Coast resources to educate local students on climate change

MarineCadastre.gov and Coastal Change Analysis Program land cover data are helping to inform ecosystem restoration planning in the Gulf of Mexico.

Over 40 years of environmental studies are now available to aid regulatory review, ocean planning, and ocean research in U.S. waters.

Automatic Identification System data from MarineCadastre.gov helped determine where changes to shipping lanes might help reduce ship strikes on whales.
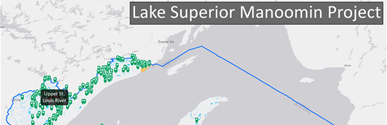
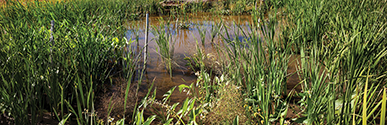
Organizations are working together with tribal communities to encourage the exchange of knowledge about and restoration of wild rice (manoomin).
Federal partnership produces better land cover maps for the conservation community on Guam.

A task force helped local constituents share ideas on flood reduction, visualize how to reduce flood-related impacts, and create a plan to implement green infrast...

An interactive ocean planning map helps stakeholders better understand the impacts of offshore renewable energy

NOAA data helped in the development of a tool to simplify comprehensive flood risk data for home buyers.

Data from the Sea Level Rise Viewer helped in the development of policies and programs to address sea level rise.
California developed its own version of the Sea Level Rise Viewer to plan with sea level rise in mind.

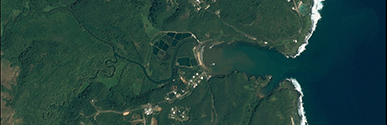
Lidar data modeling reveals clues about how American Samoan culture responded to environmental change and managed its resources over the past 2,700 years.

NOAA Sea Level Rise and Coastal Flooding Impacts data helped perform an inundation vulnerability assessment in Massachusetts.

Partners used the Sea Level Affecting Marshes Model to identify priority lands to conserve as sea level rises.
Alaska communities are beginning to use green infrastructure to build community resilience.

Lidar data replaced existing field-based methods used to measure bluff recession rates.

Coastal lidar and aerial photography made it possible to create a diked-land vulnerability inventory to help Oregon prepare for sea-level rise.

Participatory mapping methods were used to characterize ocean activities to help manage conflicts arising from multiple ocean uses and resulting threats to the ec...

The MarineCadastre.gov National Viewer enhanced communication in the development of “Wind Energy Areas.”
This tool brings together partners to improve coastal resilience by applying a unified process and standard methods.
The Land Cover Atlas is used to illustrate watershed conditions to developers to aid in making recommendations for water management.

A research team used Economics: National Ocean Watch data to help determine the value of Rhode Island’s blue economy and identify strategies to foster growth.
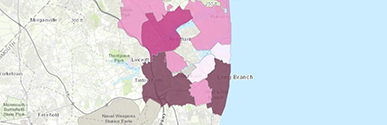
The NJ Flood Mapper has been widely adopted in Sandy’s aftermath to assess coastal vulnerability and plan for resilience.

The Sea Level Rise Viewer and C-CAP data aided the development of coastal flooding maps that present local communities with inundation scenarios.

Lidar data were used to generate maps showing the possible impacts of inundation using three different sea level rise scenarios.