2016 was the third year in a row that global average surface temperature set a new record, and the fifth time the record has been broken since the start of the twenty-first century. This animation shows the yearly history of Earth's temperature since the modern record began in 1880.
Three days of heavy rains devastated Louisiana in mid-August 2016. NOAA models find that warming due to greenhouse gases has made an event like that at least 40% more likely and 10% more intense.
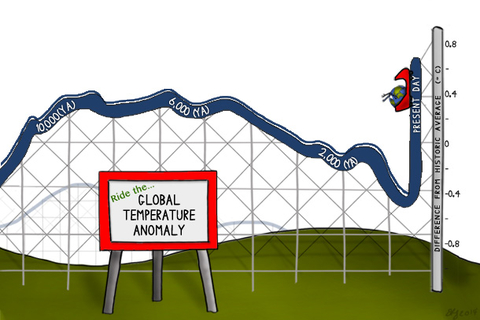
If we built a rollercoaster that matched the shape of a graph of Earth's temperature history since the end of the last ice age, the track up the latest hill would be nearly vertical.
Scientists estimated global average carbon dioxide concentration at 397.2 parts per million (ppm) in 2014, as the global growth rate of carbon dioxide continues to accelerate.
From soybeans and sunflowers in North Dakota to cotton and winter wheat in Texas, large stretches of croplands in the U.S. Great Plains rely exclusively on rain. Those croplands are likely to face longer dry spells by mid-century.
Some of the chemicals that replaced ozone-harming CFCs are long-lived greenhouse gases. At NOAA's lab in Boulder, Colorado, chemist Steve Montzka leads the effort to monitor the concentration of CFC-substitutes and their potential impact on global warming.
For 800,000 years before the twentieth century, carbon dioxide levels in Earth’s atmosphere never exceeded 300 parts per million. In March 2015, the monthly average went above 400 ppm for the first time.
Charles Keeling's measurements of carbon dioxide from the summit of Mauna Loa have become a landmark for mankind’s impact on the Earth. In this video, NOAA scientists talk about the history of the observations that allow us to connect Earth's warming climate to the greenhouse gases from burning fossil fuels.