From their perch on the space station, astronauts have spent 20 years sharing a story about Earth as they see it from above. Like the directors of a film, those astronaut storytellers have a crew working behind the scenes to help them tell the story. Meet the Earth Science and Remote Sensing Unit.

The explosive event lofted ash high above the Indonesian island of Lembata.

The storm is the second category 5 in the South Pacific this year.
Published Dec 16, 2020
Launch of the Mekong Air Quality Explorer tool demonstrates how NASA’s science, research, and data are being applied around the world to address real-life problems.
Published Dec 16, 2020 in Notes From the Field

The first and only total eclipse of 2020 stretched from the equatorial Pacific to the South Atlantic, passing through southern Argentina and Chile.
Published Dec 14, 2020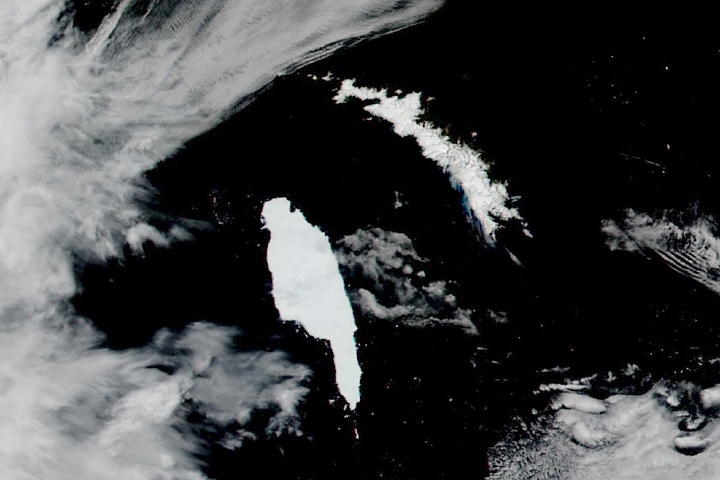
Antarctic iceberg A-68A has drifted menacingly close to a remote island in the southern Atlantic Ocean.
Published Dec 14, 2020
A serious drought has flared up across half of the United States—a familiar story for the past two decades.
Published Dec 14, 2020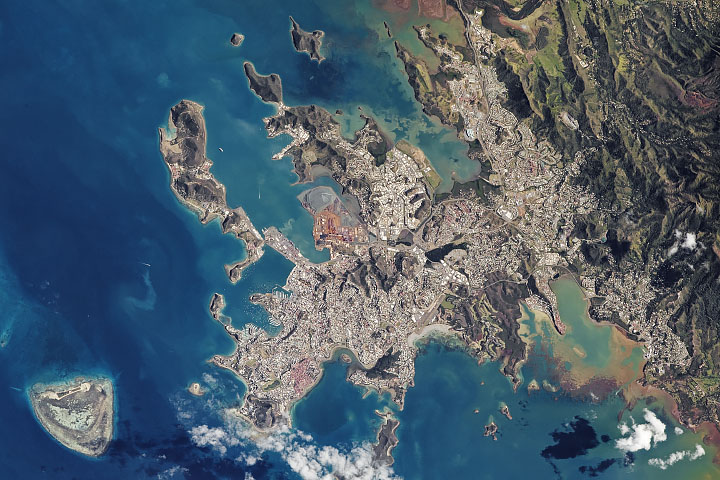
The capital city is the economic and tourist hub of New Caledonia.
Published Dec 13, 2020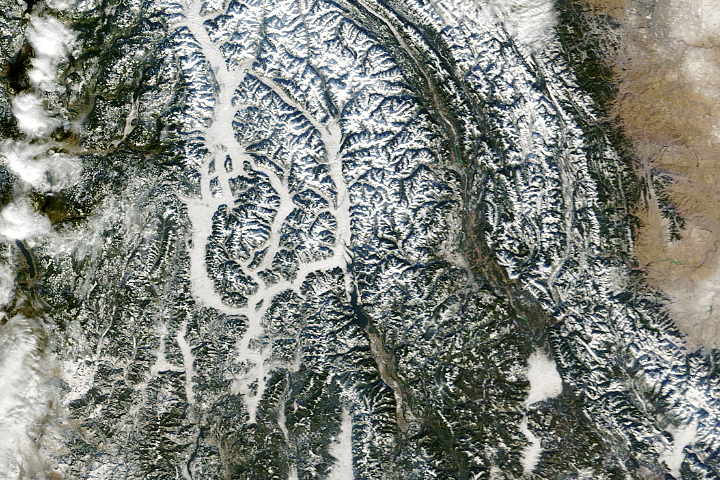
Clear skies over the Rocky Mountains helped a temperature inversion to form, which in turn led to cloud-filled valleys.
Published Dec 12, 2020
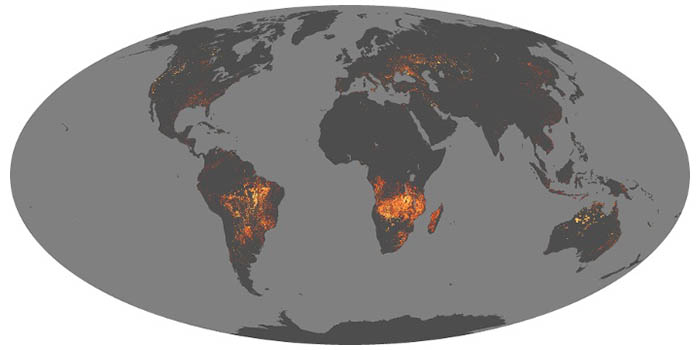
Fires have scorched half of a World Heritage Site and threatened local wildlife.
Published Dec 10, 2020Image of the Day Land Drought Fires Human Presence Temperature Extremes

The 2020 Atlantic hurricane season was supercharged, and not just in raw numbers.
Published Dec 9, 2020Image of the Day Atmosphere Land Water Severe Storms Remote Sensing

Early ice retreat amid warm Arctic air temperatures set the stage for the slow refreeze in 2020.
Published Dec 8, 2020Image of the Day Heat Water Snow and Ice Remote Sensing Sea and Lake Ice

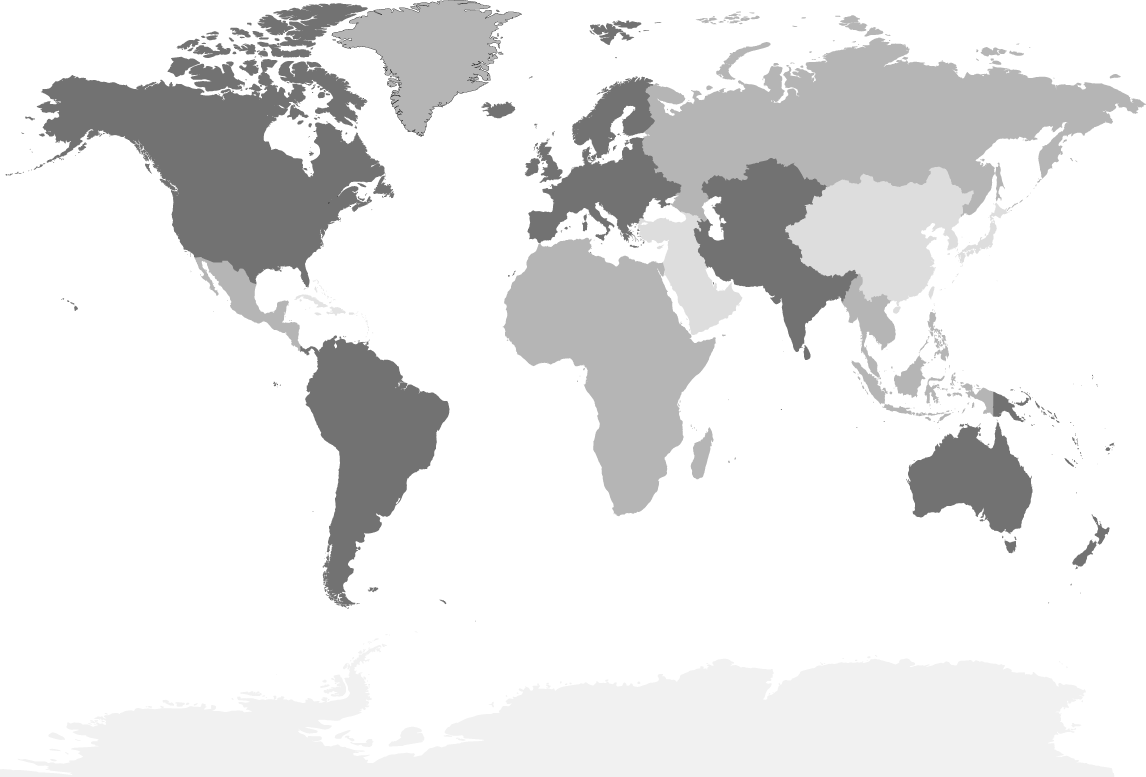
Land surface temperatures rise and fall with the heat of the Sun, and they represent how hot or cold the surface would feel to touch. These maps show daytime land temperatures as measured from space.
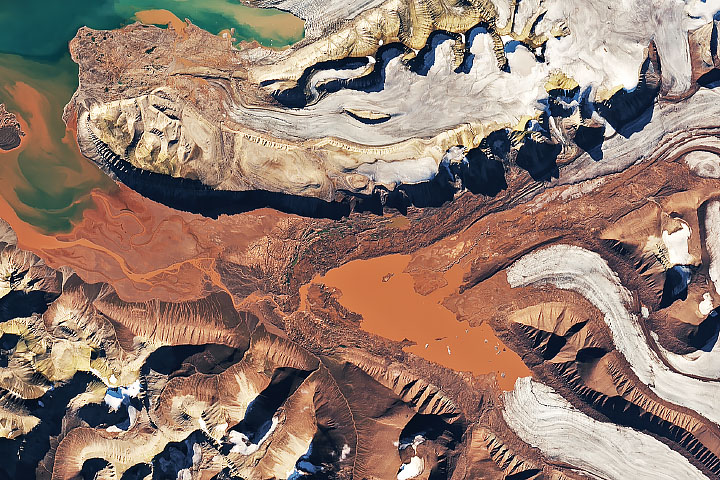
On the island of Spitsbergen, glaciers grind up sandstone, leaving an abundance of sediment that stains the meltwater.
Published Dec 8, 2020
What do you do when presented with a new satellite image? Here's what the Earth Observatory team does to understand the view.
Published Nov 18, 2013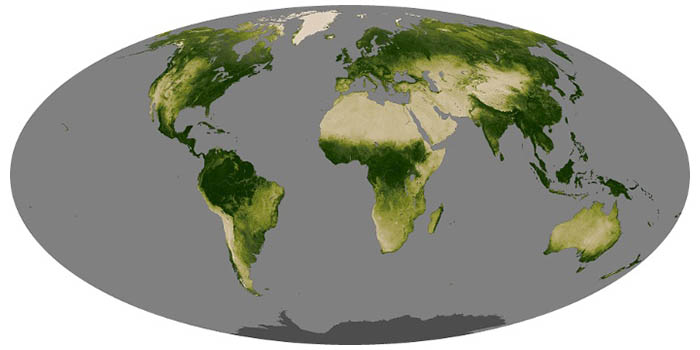
Greenness is an important indicator of health for forests, grasslands, and farms. The greenness of a landscape, or vegetation index, depends on the number and type of plants, how leafy they are, and how healthy they are.

Net radiation is the balance between incoming and outgoing energy at the top of the atmosphere. It is the total energy available to influence climate after light and heat are reflected, absorbed, or emitted by clouds and land.

An international team of scientists has used artificial intelligence and commercial satellites to identify an unexpectedly large number of trees spread across arid and semi-arid areas.
Published Dec 7, 2020
A sharp contrast in nighttime lights distinguishes the sparsely populated Tibetan Plateau from the fertile and densely inhabited Indo-Gangetic plain.
Published Dec 6, 2020
The state’s brutal fire season has not ended.
Published Dec 4, 2020
From their home on the International Space Station, astronauts have a view unlike anything most of us will ever see. Over 20 years, they have shot millions of photographs of Earth, and it is not just a hobby. It is an important scientific job, and one they need to be trained to do. Learn more about the challenges of watching Earth from above.
Published Nov 2, 2020
For 20 years, astronauts have been shooting photos of Earth from the space station. Like everything the astronauts do, they are trained for this job. And like everything they do, there is purpose and intention behind it.
Published Oct 20, 2020Have you ever wondered what it would be like to live in a different part of the world? What would the weather be like? What kinds of animals would you see? Which plants live there? By investigating these questions, you are learning about biomes.
Published Aug 28, 2020
Satellite images of Earth at night have been a curiosity for the public and a tool of fundamental research for at least 25 years. They have provided a broad, beautiful picture, showing how humans have shaped the planet and lit up the darkness.
Published Apr 12, 2017
These maps depict anomalies in land surface temperatures (LSTs); that is, how much hotter or cooler a region was compared to the long-term average. LST anomalies can indicate heat waves or cold spells.

A race is on to figure out whether COVID-19 will wax and wane with the seasons. Atmospheric and hydrologic models produced by NASA and other institutions may be key to that research.
Published Jul 14, 2020
In addition to making rain and snow, clouds can have a warming or cooling influence depending on their altitude, type, and when they form. These maps show what fraction of an area was cloudy each month.

A few decades ago, the idea of predicting a disease outbreak via satellite was science fiction. But today, researchers can use environmental data to predict when and where some diseases are likely to spread.
Published Jul 9, 2020
NASA satellites and sensors constantly take the pulse of our planet. Researchers apply those observations on local and regional scales to better manage things like food and water supplies, health, safety, land use, and ecosystems.
Published May 1, 2020
12 months of high-resolution global true color satellite imagery.
Published Oct 13, 2005