An official website of the United States government
An official website of the United States government
The .gov means it's official.
Federal government websites often end in .gov or .mil. Before sharing sensitive information,
make sure you're on a federal government site.
The site is secure.
The
https:// ensures that you are connecting to the official website and that any
information you provide is encrypted and transmitted securely.
The Current Employment Statistics (CES) program produces detailed industry estimates of employment, hours, and earnings of workers on nonfarm payrolls. CES State and Metro Area produces data for all 50 States, the District of Columbia, Puerto Rico, the Virgin Islands, and about 450 metropolitan areas and divisions. CES National Estimates produces estimates for the nation.
Each month, CES surveys approximately 145,000 businesses and government agencies, representing 697,000 individual worksites.
All States Diffusion Index, 1-month, total nonfarm
88.2(p) in Oct 2020
![]()
All MSAs Diffusion Index, 1-month, total nonfarm
73.7(p) in Oct 2020
![]()
11/20/2020
In October, unemployment rates were lower in 37 states and the District
of Columbia, higher in 8 states, and stable in 5 states. Nonfarm payroll
employment increased in 32 states, decreased in 2 states, and was
essentially unchanged in 16 states and the District.
HTML
|
PDF
|
RSS
|
Charts
12/03/2020
Jobless rates were higher in October than a year earlier in 384 of the 389 metropolitan
areas and lower in 5. Nonfarm payroll employment was down in 234 metropolitan areas over
the year and essentially unchanged in 155.
HTML
|
PDF
|
RSS
|
Charts
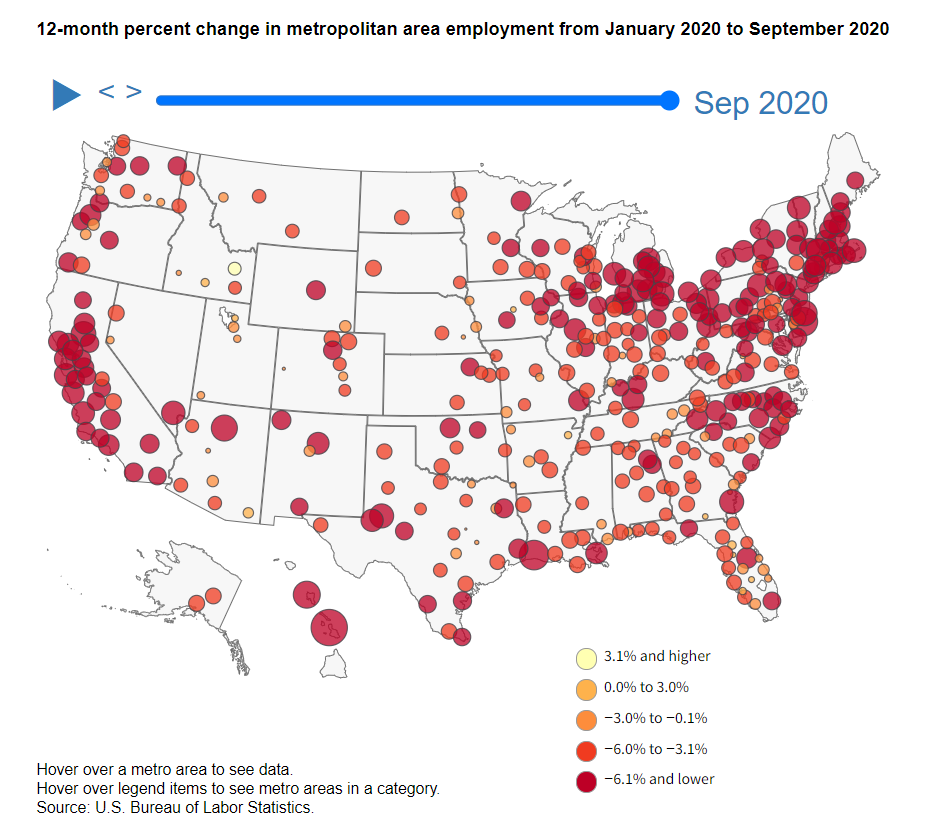
In September 2020, 251 metropolitan areas had over-the-year decreases in nonfarm payroll employment and 138 were essentially unchanged. The largest over-the-year percentage losses in employment occurred in Kahului-Wailuku-Lahaina, Hawaii (−29.6 percent), Lake Charles, Louisiana (−19.6 percent), and Ocean City, New Jersey (−18.3 percent). There were no significant job gains over this period. read more »

Did an industry composition effect slow the recovery of Alabama, Connecticut, Mississippi, New Mexico, West Virginia, and Wyoming following the Great Recession? read more »
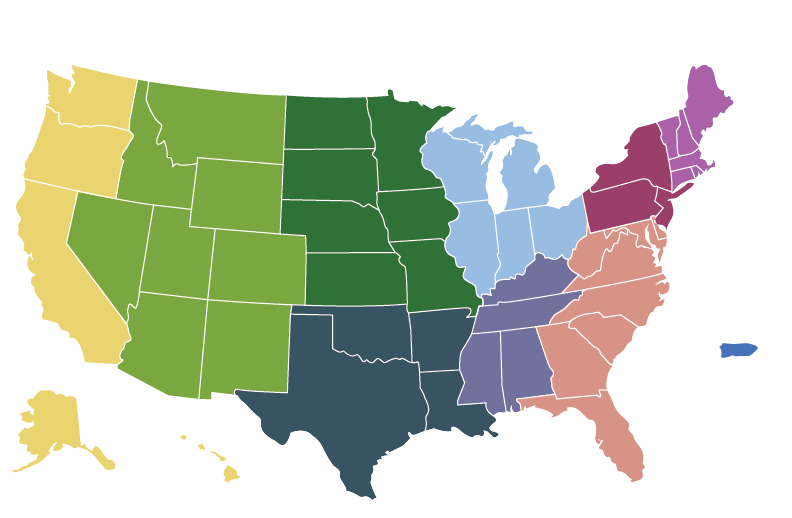
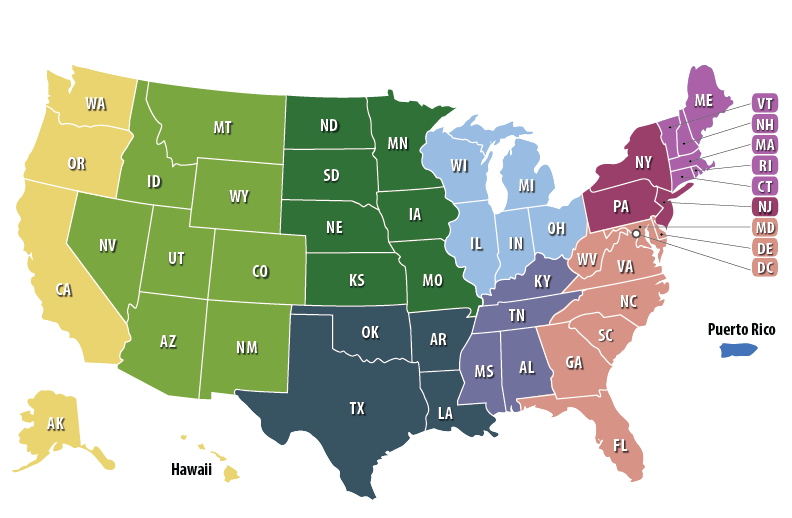
Click a state on the map for economic summaries produced by BLS Regional Information Offices.