Flood hazard information from FEMA has been combined with EIA's energy infrastructure layers as a tool to help state, county, city, and private sector planners assess which key energy infrastructure assets are vulnerable to rising sea levels, storm surges, and flash flooding. Note that flood hazard layers must be zoomed-in to street level before they become visible. For a full set of energy infrastructure layers refer to the U.S. Energy Mapping System.
Energy Infrastructure with FEMA National Flood Hazard
Full Screen
❖ Layer information and map data
Map questions, comments and suggestions: mapping@eia.gov
Map questions, comments and suggestions: mapping@eia.gov
| Related Maps | U | U.S. Energy Mapping System | S | State Energy Profiles | |
| D | Energy Disruptions | G | Gulf of Mexico Fact Sheet | ||
| F | Flood Vulnerability | P | Major Oil and Gas Plays |
Quick Guide
Areas where flood hazard information is available are shown in red.
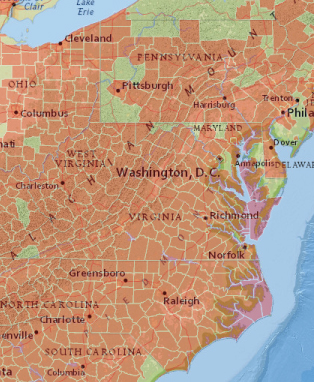
Flood hazard zones and energy infrastructure
(note: to see all map layers zoom-in to street level).

Click on a map symbol or designated area for additional details.