Geographic Information Systems Data Pathfinder


Visual representation of data layers or themes in a GIS. Credit: Government Accountability Office, 2012
- visualizations through interactive maps,
- data based on the location of features or variables represented,
- spatial analytic functions that focus on identifying trends and patterns across space and time, and
- applications that enable tools and services in user-friendly interfaces.
Remote sensing data and imagery from Earth observations can be visualized within a GIS to provide more context about any area under study. The need is growing for NASA Earth science data to be in GIS-ready formats for easy integration and analysis in the primary tools employed by user communities. Numerous geospatial web services and tools are available through NASA's Earth Observing System Data and Information System (EOSDIS) Distributed Active Archive Centers (DAACs) to access GIS-ready data. This data pathfinder provides direct links to those web services and tools for accessing and using NASA Earth science data.
If you don't see a dataset you need or need to locate other types of data in GIS-ready formats, contact us.
Working with Multidimensional Data in a GIS
Overview
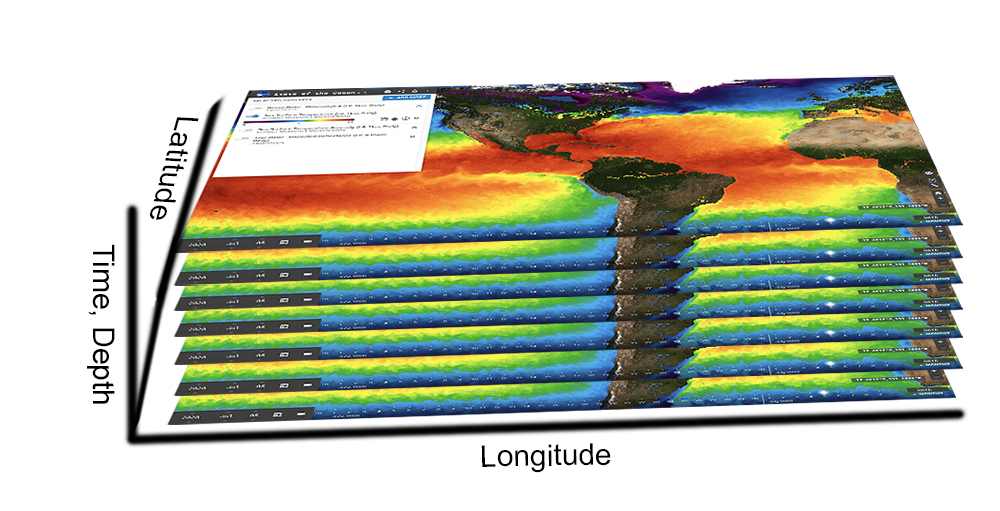
Multi-dimensional raster data which occurs over space (two dimensional), time, and/or height and depth (another dimension). Credit: NASA
In recent years, GIS software has increased support for scientific data formats in their platforms. In addition to correctly ingesting and reading these files, primary software platforms have developed new tools to aid in common workflows, management, analysis and distribution of multidimensional data.
In tools such as QGIS and ArcGIS, support for raster data is provided using a mosaic dataset. A mosaic dataset is a data model that acts as a shell to input a collection of multiple raster files, which include different file types, and is viewed as a single image. A multidimensional mosaic dataset stores information about the dimensions and variables as fields in the mosaic dataset footprint table. The underlying raster data does not have to be connecting or overlapping but can be isolated or intermittent datasets. In some GIS software platforms, a single mosaic dataset can then be used to query, process, analyze, and serve data.
Related Tutorials:
- ArcGIS: Adding NetCDF Data in ArcGIS
- ArcGIS: Creating a Mosaic Dataset
- ArcGIS: Working with Mosaic Datasets
- QGIS: Adding Data
- QGIS: Raster Mosaicing and Clipping
Working with Multidimensional Data in a GIS (ArcGIS Specific)
There are two ways to make a mosaic dataset that is multidimensional-aware. One option is to create a mosaic dataset by adding rasters using HDF, netCDF, or GRIB raster file types which will import dimensional data and variable information into the mosaic dataset. The other option is to build a multidimensional information table in order to generate required multidimensional fields, metadata, and structure to make the dataset interoperable. In order to do this you will need to have a field in your mosaic dataset footprint table that identifies the variable in each raster and there needs to be either a time or height field to define one or more dimensions.
If you need assistance in working with multidimensional data in GIS-ready formats, contact us.
Using NASA Data in a GIS
Adding a Raster Layer | Adding a Vector Layer | Adding a Web Map Service
There are a variety of GIS programs available to users. The following examples show screenshots from QGIS, a free and open source GIS program, yet other programs have similar options for adding layers.
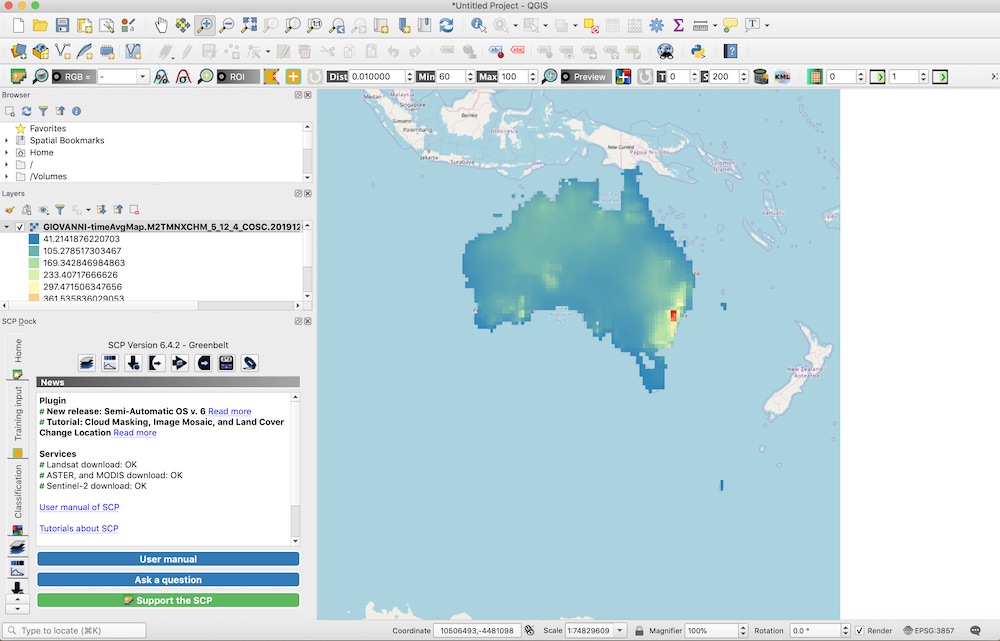
Adding a Raster Layer to a GIS
- Under Layer/Add Layer, select Add Raster Layer.

- Select the file and click add.
You may need to modify the projection or symbology, both of which are in the layer properties. Layer properties can be accessed by double-clicking on the layer or by selecting Layer/Layer properties. "Layer Properties" is the window title within QGIS and "Properties" in ArcGIS Pro.
- At this point, you can visualize your data.
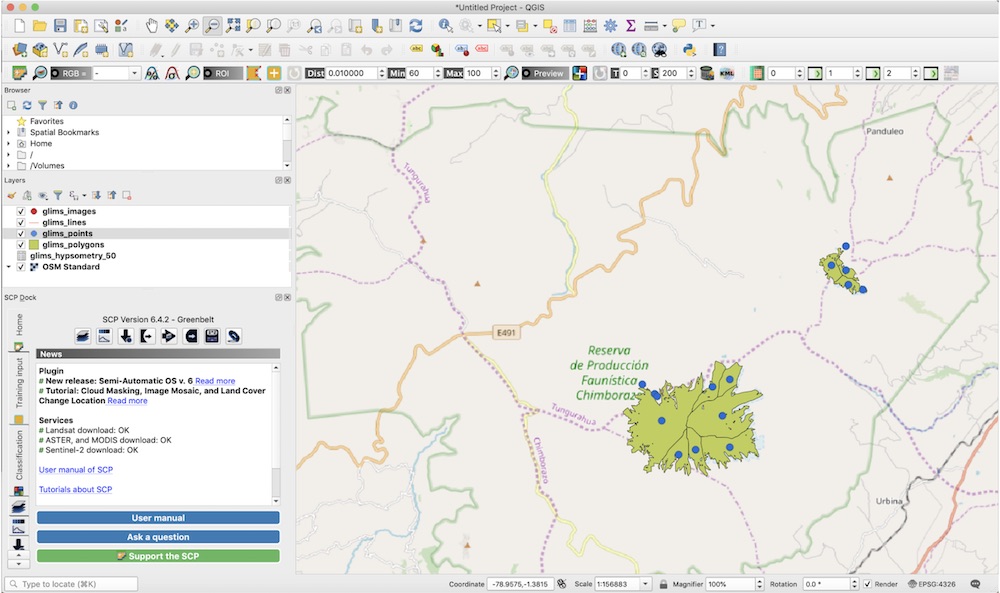
Adding a Vector Layer to a GIS
- Under Layer/Add Layer, select Add Vector Layer.

- Select the file and click add. Note: you can add the entire zip file and then select specific layers to add.
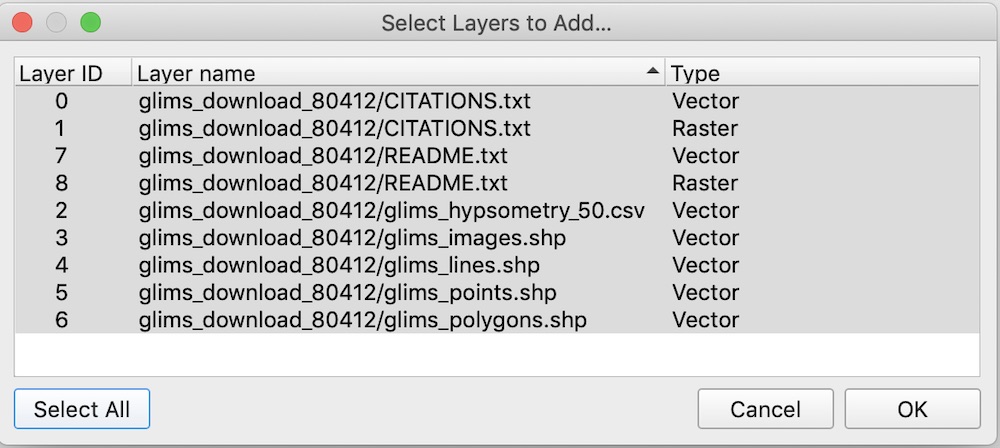
- At this point, you can visualize your data.

Adding a Web Service to a GIS
Some of the DAACs provide geospatial services, specifically web map services (WMS), web coverage services (WCS), and web feature services (WFS), providing access to a variety of GIS-ready datasets. Many of the URLs needed for data access are specific to the DAAC, and in some cases specific to the dataset. See Use Cases for Web Services to see examples for each service.
QGIS:
- Under Layer/Add Layer, select Add WMS/WMTS Layer.
- Click "New" to add a new end point using the specific URL then click "Connect" to access the services available.
ArcGIS Pro:
- Insert > Connections > New WMS Server to then add a new end point using the specific URL.
- Click "OK" to connect and access the services available.
Use Cases for Web Services
Web Feature Service | Web Coverage Service | Web Map Service
Web Feature Service from NASA's Socioeconomic Data and Applications Center (SEDAC)
Storm surge from hurricanes pose threats to human health and wildlife. In areas where Superfund sites may be inundated, the concern that toxins will be dispersed is great. However, the level of concern varies widely depending on the specific contaminants and their concentrations. The Environmental Protection Agency (EPA), therefore, must assess where superfunds exist and the vulnerability of those sites, as well as risk to surrounding communities, when a large storm surge is expected. Use case adapted from CNBC news article and EPA Hurricane Harvey Report.
Concerned about the approaching hurricane expected to hit the panhandle of Florida, you want to look at Superfund sites in the area and the population density surrounding those areas to assess potential effects. Through SEDAC's WFS, you can directly access the data within a GIS.
To add a WFS:
- Proceed to Layer and "Add a WFS Layer."
- Provide a name and insert this URL: https://sedac.ciesin.columbia.edu/geoserver/ows?version=1.1.0

- Click OK and then Connect.
- Features can now be added to the map viewer.
In this example, the following SEDAC layers were added:
- Agency for Toxic Substances and Disease Registry (ATSDR) Hazardous Waste Sites
- Gridded Population of the World, Version 4, Population Density

Web Coverage Service from NASA's Oak Ridge National Laboratory DAAC (ORNL DAAC)
According to the Global Annual Temperature Rankings Outlook from NOAA, this year (2020) is on track to be one of the warmest on record.
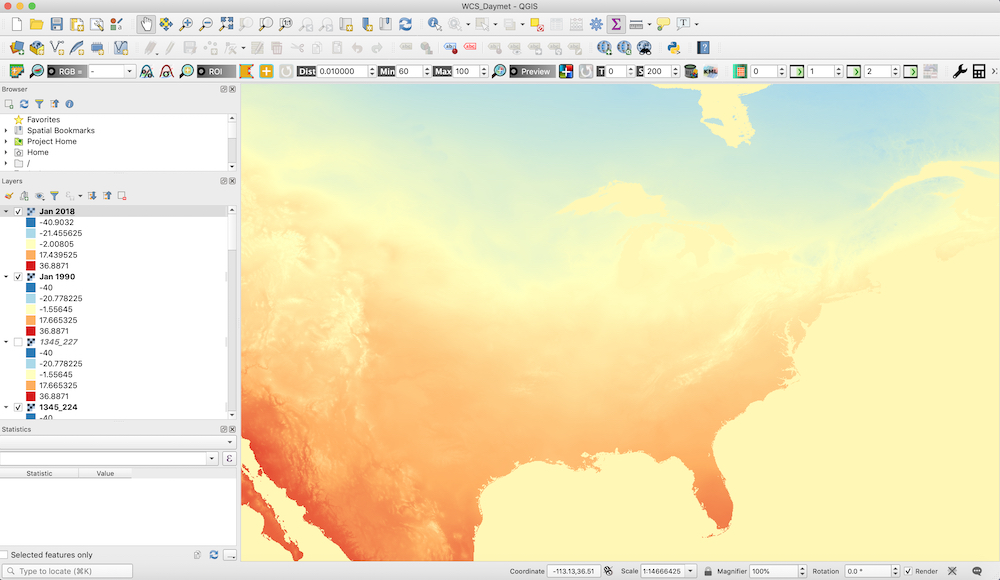
Concerned about a changing climate, you want to access climatological data, and generate an anomaly map for the month of January, 2020. Through ORNL DAAC's WCS, you can directly access, within a GIS, Daymet data (a collection of gridded estimates of daily weather parameters generated by interpolation and extrapolation from daily meteorological observations) to run raster-based functions to generate a 28-year time averaged map and then an anomaly map for 2020.
To add a WCS:
- Proceed to Layer and "Add a WCS Layer."
- Provide a name and insert this URL: https://webmap.ornl.gov/ogcbroker/wcs?

- Click OK and then Connect.
- Coverages can now be added to the map viewer.
In this example, the following ORNL DAAC layers were added:
- Daymet: Monthly Climate Summaries on a 1-km Grid for North America (January months from 1990-2018)
Web Coverage Service – SEDAC
Approximately half the nation's original wetland habitats have been lost over the past 200 years. In part, this has been a result of natural evolutionary processes, but human activities, such as dredging wetlands for canals or draining and filling for agriculture, grazing, or development, share a large part of the responsibility for marsh habitat alteration and destruction. Louisiana's wetlands today represent about 40 percent of the wetlands of the continental United States, but about 80 percent of the losses (from Louisiana Coastal Wetlands: A Resource at Risk).
Concerned about a changing climate, you want to conduct an analysis of coastal wetlands loss from sea level rise using estimates of wetland losses as a basis for identifying potential adaptation measures. Through SEDAC's WCS, you can directly access, within a GIS, elevation data, population density, and an urban extents grid.
To add a WCS:
- Proceed to Layer and "Add a WCS Layer."
- Provide a name and insert this URL: https://sedac.ciesin.columbia.edu/geoserver/wcs?

- Click OK and then Connect.
- Coverages can now be added to the map viewer.
In this example, the following SEDAC layers were added:
- Global Rural-Urban Mapping Project, Version 1 (GRUMPv1): Population Density Grid for the year 2000
- GRUMPv1 Urban Extents
- Global Shuttle Radar Topography Mission (SRTM) Elevation above Sea-level at 1 km resolution

Web Map Service – Global Imagery Browse Services (GIBS)
In a recent research article from the journal Global Ecology and Biogeography, titled The Global Fire-Productivity Relationship, it is noted that on a global scale, fire activity changes along the productivity/aridity gradient. This relation should be driven by differing relative roles of the main fire drivers (weather and fuel) along the productivity gradient. In moist regions around the globe, fire activity is believed to be driven by drought frequency, whereas in dry regions, fire is thought to be limited by the amount of fuel available.
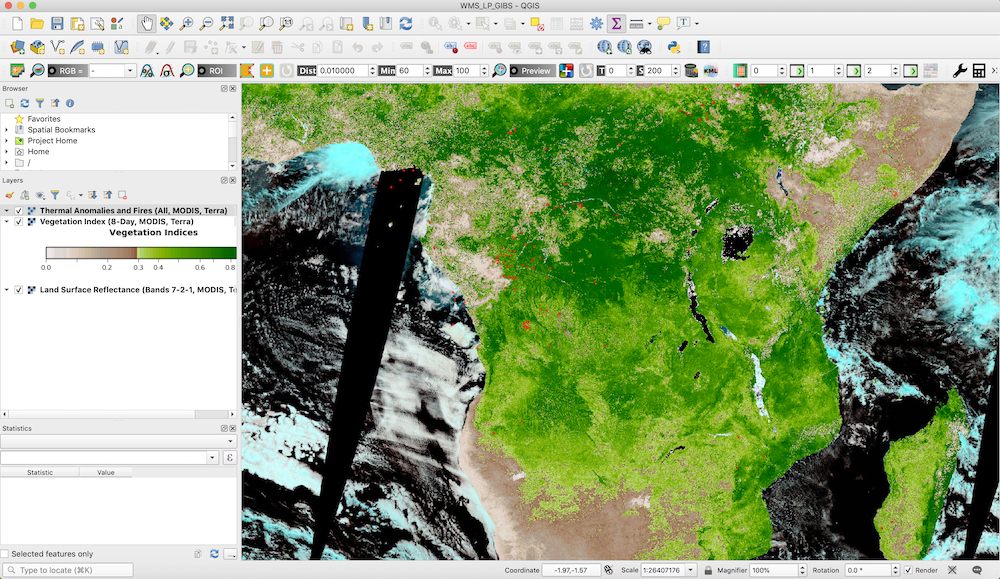
Concerned about a changing climate, you want to test these ideas by comparing global fire activity. Within a GIS using GIBS's WMS, you can directly access MODIS land surface reflectance (bands 7-2-1, useful for distinguishing burn scars from naturally low vegetation or bare soil), fire and thermal anomalies, and normalized difference vegetation index, among many other relevant layers.
To add a WMS:
- Proceed to Layer/Add Layer and "Add a WMS/WMTS Layer."
- Provide a name and insert this URL: https://gibs.earthdata.nasa.gov/wms/epsg4326/best/wms.cgi

- Click OK and then Connect.
- Imagery layers can now be added to the map viewer.
In this example, the following layers from GIBS were added:
- Thermal Anomalies and Fires (All (day/night) from the Moderate Resolution Imaging Spectroradiometer (MODIS) instrument on the Terra platform)
- 8-day Vegetation Index from Terra's MODIS instrument
- Land Surface Reflectance (bands 7, 2, 1) from Terra's MODIS instrument
Many of the imagery visualization layers provided through GIBS are time-varying imagery layers and the date/time can be changed directly through some GIS applications using the temporal controller or time slider functionality. GIBS provides instructions for enabling this capability, with a fixed temporal range or an animated one, within several GIS applications.
Some of the DAACs provide geospatial services, specifically WMS and WCS, providing access to a variety of GIS-ready datasets. They can be found on the geospatial services page.
Tools and Platforms to Discover NASA Data
NASA ArcGIS Online (AGOL)
 NASA ArcGIS Online (AGOL) provides the capability to create and share NASA Earth science data with the public and interagency partners by bringing data to end users in an easy to use, cloud-based web platform.
Worldview
NASA's Worldview visualization application provides the capability to interactively browse over 900 global, full-resolution satellite imagery layers and then download the underlying data. Many of the available imagery layers are updated within three hours of observation, essentially showing the entire Earth as it looks "right now." This supports time-critical application areas such as wildfire management, air quality measurements, and flood monitoring. Imagery in Worldview is provided by GIBS. Worldview now includes nine geostationary imagery layers from Geostationary Operational Environmental Satellite (GOES)-East, GOES-West and Himawari-8 available at ten-minute increments for the last 30 days. These layers include Red Visible, which can be used for analyzing daytime clouds, fog, insolation, and winds; Clean Infrared, which provides cloud top temperature and information about precipitation; and Air Mass RGB, which enables the visualization of the differentiation between air mass types (e.g., dry air, moist air, etc.). These full disk hemispheric views allow for almost real-time viewing of changes occurring around most of the world.
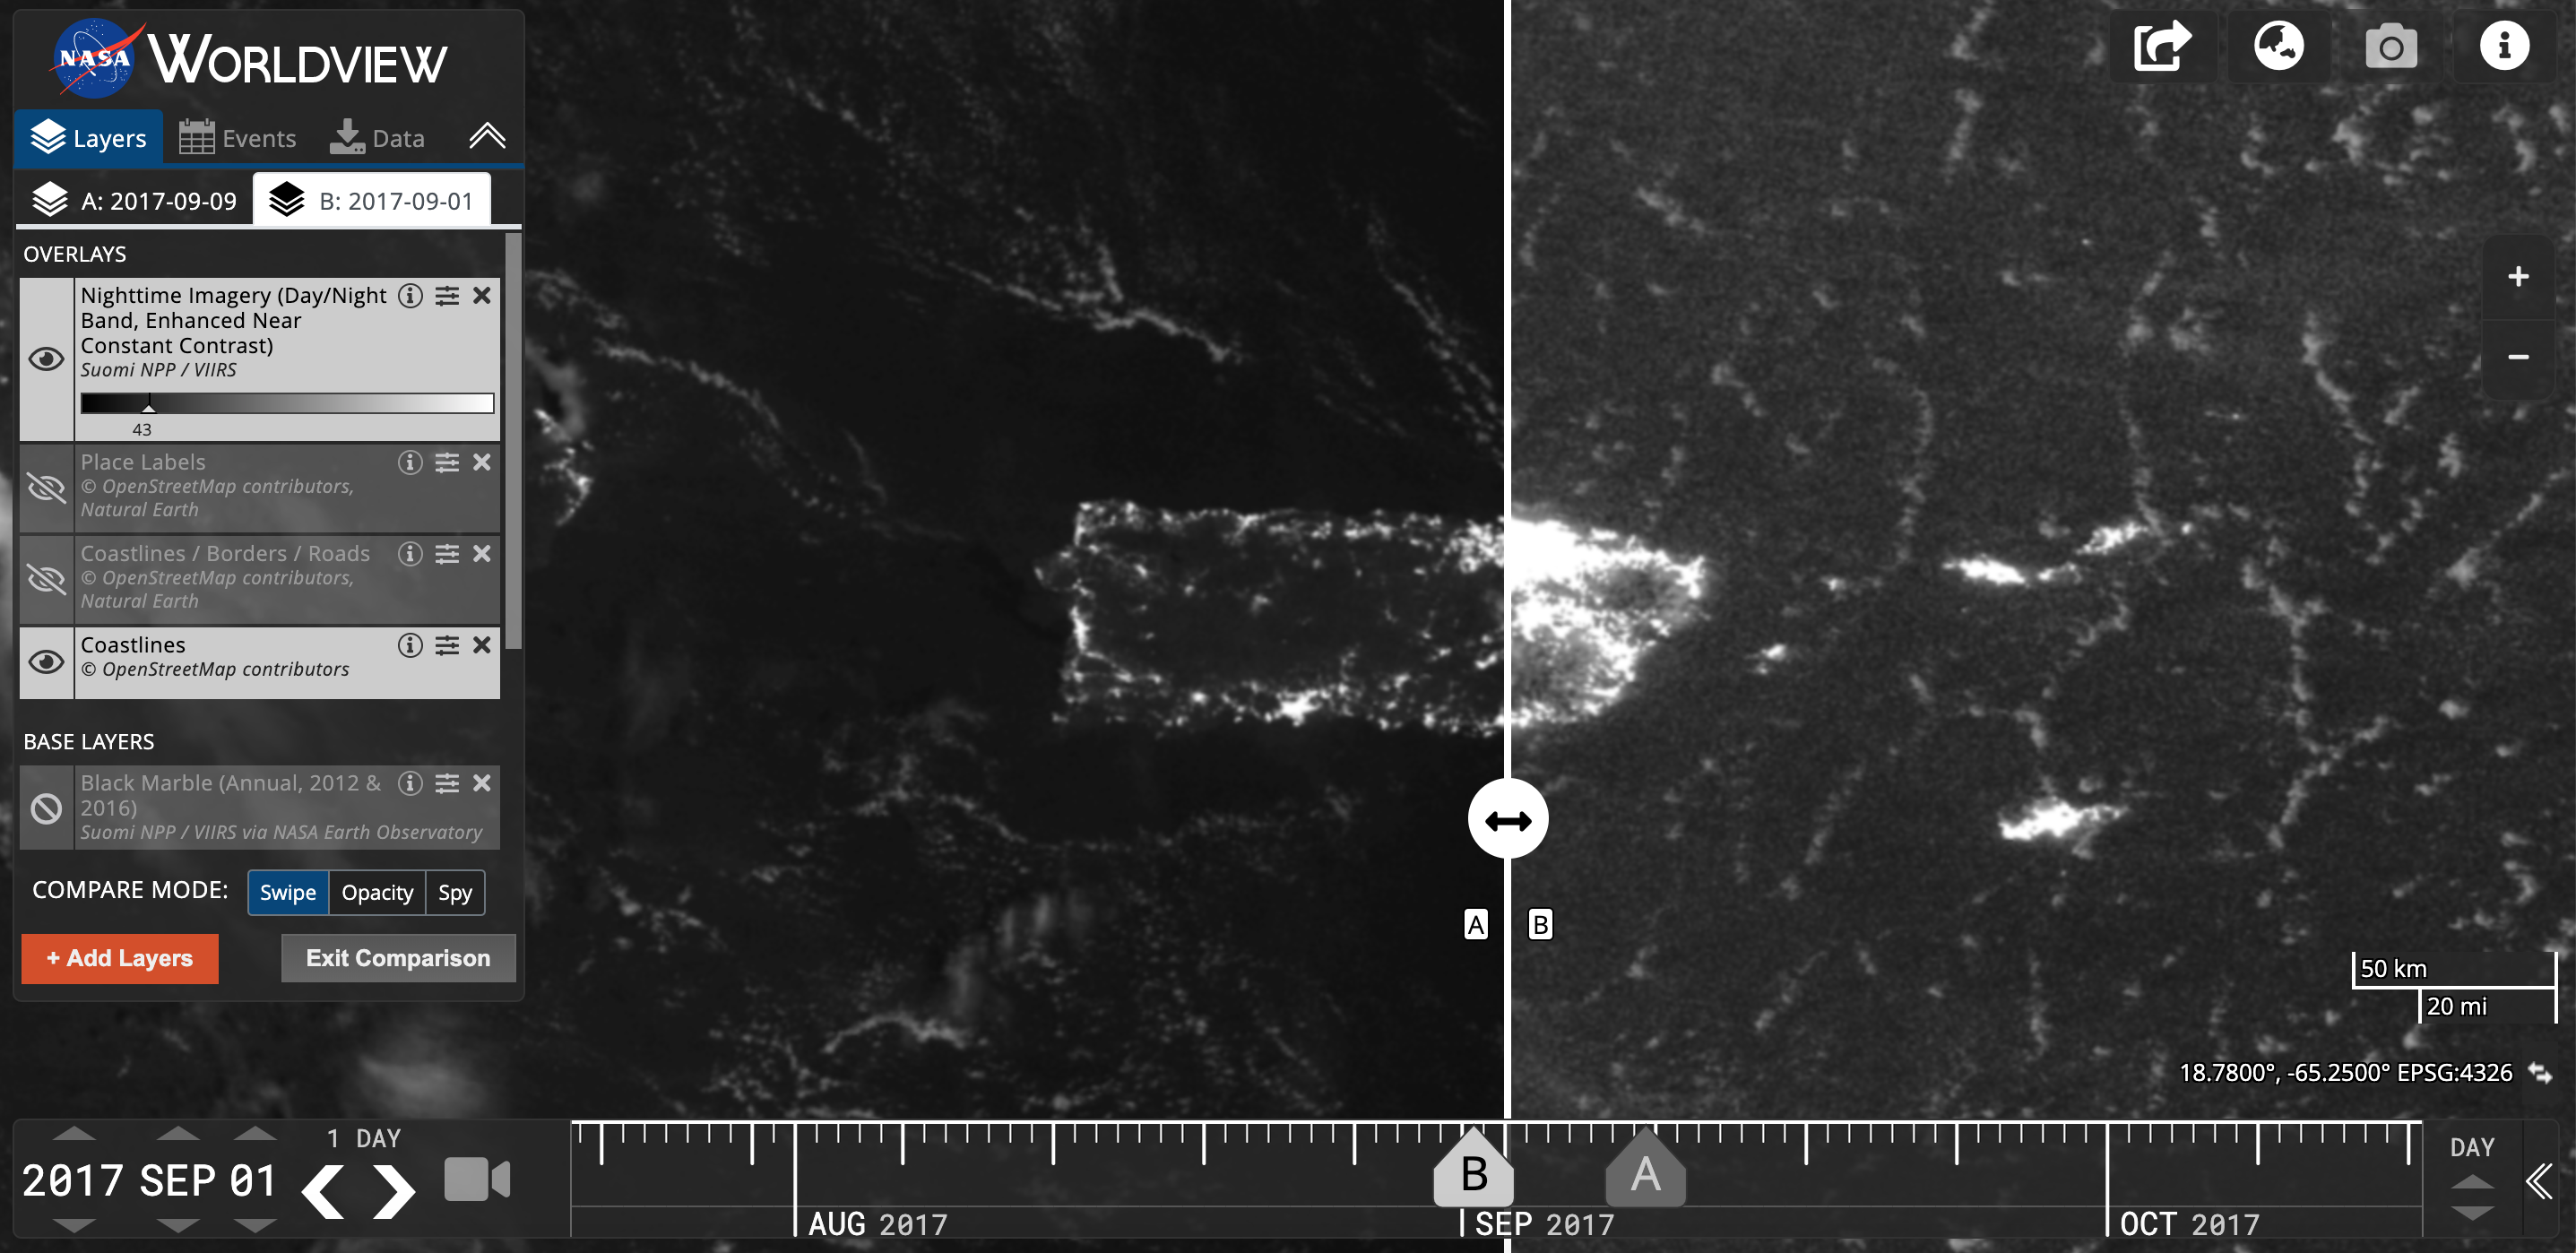
Worldview data visualization of the nighttime lights in Puerto Rico pre- and post- Hurricane Maria, which made landfall on September 20, 2017. The post-hurricane image on the left shows widespread outages around San Juan, including key hospital and transportation infrastructure.
Earthdata Search
Earthdata Search is a tool for data discovery of Earth Observation data collections from NASA's EOSDIS, as well as U.S. and international agencies across the Earth science disciplines. Users (including those without specific knowledge of the data) can search for and read about data collections, search for data files by date and spatial area, preview browse images, and download or submit requests for data files, with customization for select data collections.
In the project area, for some datasets, you can customize your granule. You can reformat the data and output as HDF, NetCDF, ASCII, KML, or a GeoTIFF. You can also choose from a variety of projection options. Lastly, you can subset the data, obtaining only the bands that are needed.
DAAC Tools
Many of the DAACs also provide Interactive Tools for GIS Data from which data can be visualized, subsetted, and downloaded in different file formats that are GIS analysis-ready.
Other Resources
NASA's Atmospheric Science Data Center (ASDC) AGOL Data Portal
ASDC AGOL Data Portal features web maps of data from:
- Measurement of Pollution in the Troposphere (MOPITT) instrument, designed to enhance our knowledge of the lower atmosphere and to observe how it interacts with the land and ocean biospheres.
- Multi-angle Imaging Spectroradiometer (MISR), designed to show the change in reflection at different view angles, which affords the means to distinguish different types of atmospheric particles (aerosols), cloud forms, and land surface covers.
- Climatology of solar radiation from 1983-2005.
DAAC Story Maps
Dizzy the Disdrometer: An interactive story map from NASA's Global Hydrology Resource Center DAAC (GHRC DAAC) to learn about the disdrometer instrument, the Global Precipitation Monitoring (GPM) Ground Validation (GV) project, and where to find the data used during the field campaigns.
Mapping Deforestation: A new "Data in Action" ArcGIS Story Map, at NASA's Land Processes DAAC (LP DAAC), maps deforestation in Cambodia using NASA MODIS Land Cover and Vegetation Continuous Fields datasets to highlight land cover changes.

Screenshot of an image captured by Sentinel-1B of Hurricane Dorian off the north coasts of Puerto Rico and the Dominican Republic, taken on August 29, 2019. The image was processed using GAMMA software and contains modified Copernicus Sentinel data 2019, processed by ESA. Credit: Alaska Satellite Facility Distributed Active Archive Center (ASF DAAC)
Changes in the Observed Tropospheric NO2 Column Density shows the changes in the observed Tropospheric NO2 column density over China before and after lockdown due to COVID-19.
Ice-Albedo Feedback in the Arctic provides information on sea ice extent in the Arctic and the drivers of change. The story map also highlights the impact of increasing absorbed solar radiation and its impact within the ice-albedo feedback loop.
Introduction to MAIA and TEMPO introduces us to these two new missions, the Multi-Angle Imager for Aerosols (MAIA) and Tropospheric Emissions Monitoring Pollution (TEMPO), launching in 2022, that will study air quality and its impact on human health at unprecedented temporal and spatial scales.
Global Air Quality uses NASA SEDAC's global annual gridded particulate matter with particles smaller than 2.5 microns (PM2.5) to observe trends over time and to assess the impact on humans.
Studying the 2019-2020 Australian Bushfires Using NASA Data guides users through the factors leading up to the 2019-2020 Australian bushfires disaster, the effect this event has had on air quality and global atmospheric composition, and the science behind researching the tie between disasters and public health. This story map uses data archived at NASA's ASDC.
The North Atlantic Aerosols and Marine Ecosystems Study (NAAMES) story map that provides information on the 5-year study employing ship, aircraft, float and drifter, and satellite observations across the annual plankton cycle in the North Atlantic Ocean.
Applied Sciences Disaster Portal
The Disasters Applications area promotes the use of Earth observations to improve prediction of, preparation for, response to, and recovery from natural and technological disasters. Disaster applications and applied research on natural hazards support emergency preparedness leaders in developing mitigation approaches, such as early warning systems, and providing information and maps to disaster response and recovery teams.
-
NASA Disasters Mapping Portal
Provides maps and ArcGIS web apps focused on specific natural disasters - Drought Review Story Map
My NASA Data
 My NASA Data is an effort to develop microsets of Earth science data that are accessible, interesting and useful to the K-12 and citizen scientist communities. My NASA Data provides a means of visualizing global datasets through its Earth System Data Explorer. My NASA Data provides global monthly visualizations of parameters, such as aerosol optical depth, surface air temperature, surface air temperature anomalies, wind speed, biome classification, chlorophyll, leaf area index, normalized difference vegetation index, concentration of CO2 in the troposphere, total column ozone, and air column concentration of CO, SO2, and NO2.
By choosing a dataset, the web-based tool provides information about the source of the data and the units, as well as a visualization of the monthly data (note that there are a few daily datasets). Within the Earth System Data Explorer, you can compare multiple datasets, create line plots, create animations, and perform computational requests (like computing the average values over time).
Once you have the dataset of interest, it can be exported to a variety of desktop applications, including Ferrett, GrADS, and MatLab. The data also can be saved as an ASCII, CSV, NetCDF, and arcGRID file. arcGRID and NetCDF files can be opened as a raster layer in GIS programs. CSV files can be opened as a "delimited text" file. To open properly, you will need to specify that it is comma-separated, the number of header lines to discard, and the appropriate fields for latitude and longitude.
My NASA Data also has a series of story maps designed for educational use:
- Hurricanes as Heat Engines Story Map
- Urban Heat Island Story Map
- Sea Ice and the Earth System Story Map
- Global Phytoplankton Distribution Story Map
- Volcanic Eruptions Story Map
- Ocean Circulation Patterns: Garbage Patches Story Map
NASA Center for Climate Simulation
NASA Center for Climate Simulation (NCCS) Spatial Analytics Platform supports NASA scientists and partners by providing a centralized and highly available geospatial platform that:
- is tightly integrated with NCCS’s high performance computing capabilities;
- accelerates collaborative analytics through the use of advanced visualization and custom applications; and
- can process vast amounts of data without significant performance degradation. NCCS has various ArcGIS web apps as well as story maps.
Published July 10, 2020
Page Last Updated: Nov 5, 2020 at 8:57 AM EST