The Coastal Aquaculture Planning Portal (CAPP) is a toolbox of coastal planning tools designed to assist managers, planners, and industry with sustainable aquaculture development. This toolbox was developed in partnership with Digital Coast, a product of the NOAA National Ocean Service Office for Coastal Management.
Explore the portal by filtering Subportal, Keyword, and Region.
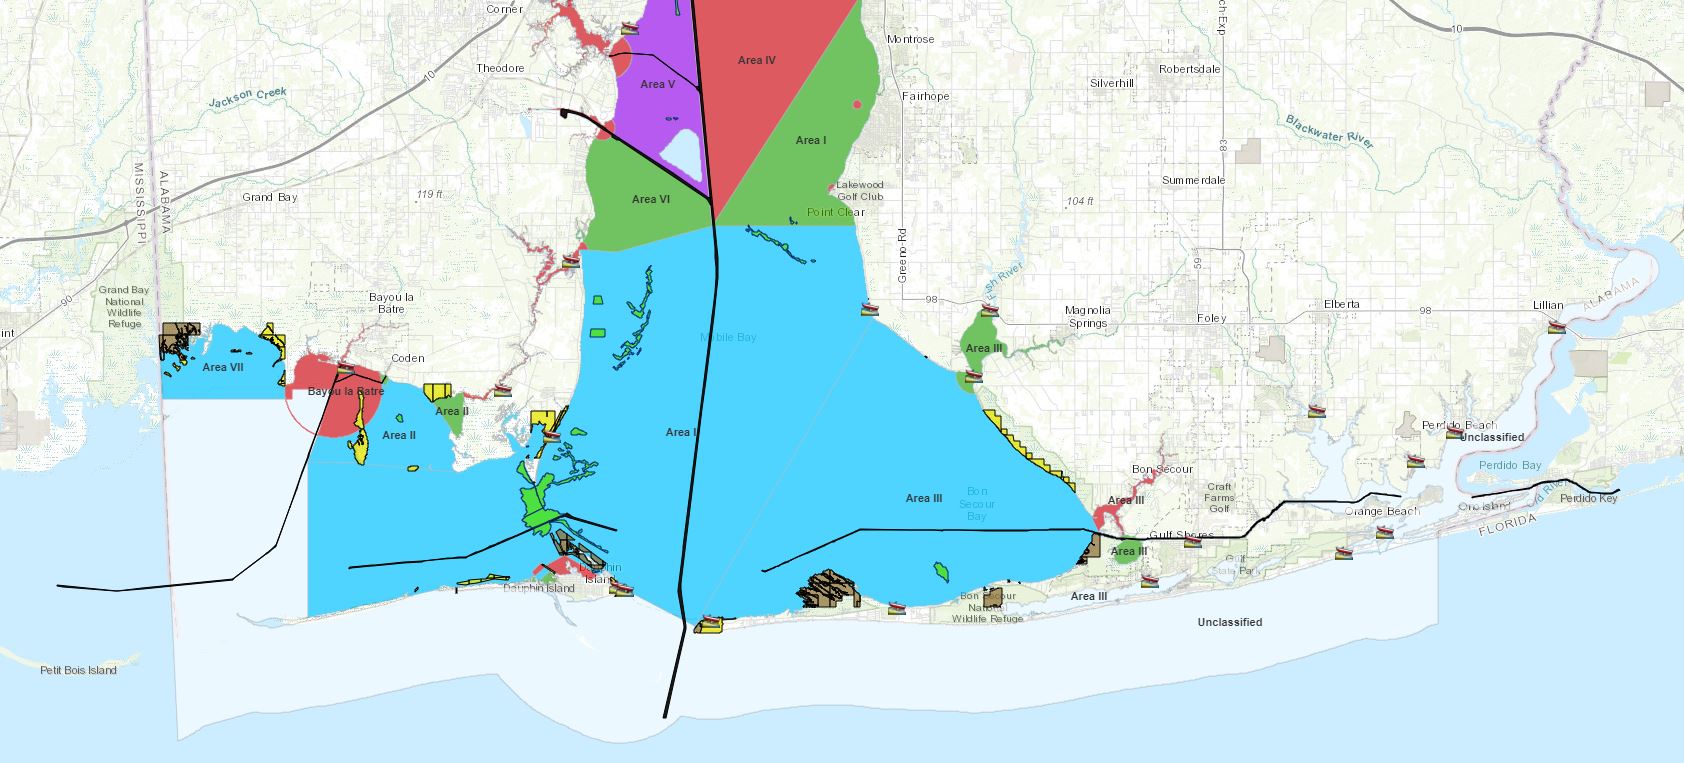
This interactive map viewer allows users to view current shellfish harvest restrictions along the Alabama coastline.
Aquaculture application: This map viewer can be used for aquaculture screening and risk communication for lease bed harvest closures.
Tutorial: Download under site selection
Contributing Partners: Alabama Marine Resource Division, Sea Grant
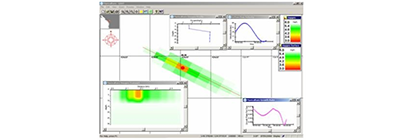
Can be used to examine near and far field effects of individual or clusters of farms in the coastal shelf where nearshore or open-ocean aquaculture may develop. The software models farms with multiple, separate cages and multiple farm sites to meet this challenge.
Aquaculture application: AquaModel allows for proper planning, siting and management of offshore aquaculture farms to monitor and reduce environmental impacts to marine ecosystems.
Requirements: Technical training and purchase of AquaModel Software
Contributing Partners: EASy
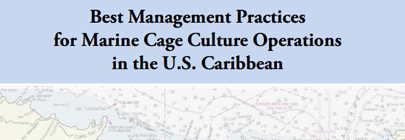
Guide for marine cage culture BMPs in the U.S. Caribbean
Aquaculture application: These BMPs are useful for guiding the management practices of cage culture operations to ensure productivity and environmental stewardship in the U.S. Caribbean.
Contributing Partners: GCFI, Sea Grant, DRNA
View Product
Translates existing benthic habitat data sets to the Coastal and Marine Ecological Classification Standard (CMECS). Users can then create a file geodatabase containing CMECS component feature layers.
Aquaculture application: The Crosswalk Tool classifies benthic habitat for users to export categorized data, and import into a GIS to assist with aquaculture screening and siting.
Contributing Partners: NOAA OCM
View Product
Zoned tides, relative to a tidal datum, can be constructed by applying time and range correctors to observed water level data from a given NOAA tide station for corrections.
Aquaculture application: Users can view and download tidal corrections for planning of shellfish aquaculture farm locations relative to the needed balance of submerged and exposed gear.
Contributing Partners: National Ocean Service (NOS) Center for Operational Oceanographic Products and Services (CO-OPS)
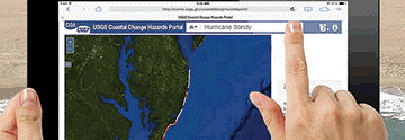
Create a map of potential ecological, social, and economic impacts from rising seas and changing climate. Resources are organized under three themes: extreme storms, shoreline change, and sea level rise.
Aquaculture application: Assess, download, and share data on coastal change and potential impacts to coastal aquaculture in the present and future.
Contributing Partners: USGS
Turn complex data into easy-to-understand stories, complete with charts and graphs.
Aquaculture application: Map a coastal county’s use of the ocean and wetlands for economic contributions and potential introduction of new aquaculture for continued and sustainable economic growth.
Contributing Partners: NOAA OCM
Create a map of potential ecological, social, and economic impacts from rising seas and changing climate.
Aquaculture application: Map aquaculture coastal planning efforts and evaluate resiliency options.
Contributing Partners: ASFPM, Natural Capital Project, TNC, NOAA OCM, USGS, UCSC, USM
View Product
The Nature Conservancy examines nature’s role in reducing coastal flood risk. The program consists of an approach, a web mapping tool, and a network of practitioners around the world supporting hazard mitigation and climate adaptation planning.
Aquaculture application: Aquaculture operations and inland infrastructure can be better prepared for extreme events and build resilience into their management framework.
Coastal aquaculture planning, screening, and siting at global, national, regional, and in some cases, local scales.
Contributing Partners: The Nature Conservancy
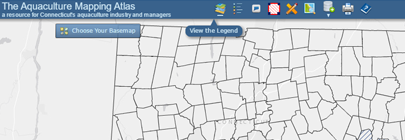
Interactive decision-support tool for shellfish aquaculture along the Connecticut coastline.
Aquaculture application: The tool is designed to provide information to help potential shellfish farmers determine site feasibility, potential risks, and long-term suitability for particular areas in Connecticut.
Contributing Partners: UCONN, CLEAR, Sea Grant, Connecticut Department of Agriculture
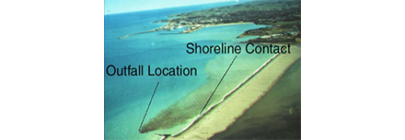
Cormix Is a USEPA-supported mixing zone model and decision support system for environmental impact assessment of regulatory mixing zones resulting from continuous point source discharges. The system emphasizes the role of boundary interaction to predict steady-state mixing behavior and plume geometry.
Aquaculture application: Assists in the site selection of aquaculture facilities located in close proximity to point source discharge.
Contributing Partners: MixZon Inc
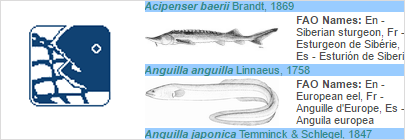
The Cultured Aquatic Species Fact Sheet collection provides baseline information of environmental conditions needed for some aquaculture species.
Aquaculture application: Provides a general overview of various aquaculture aspects including production systems, diseases and control measures, production statistics, and market and trade for the most important species in global aquaculture.
Contributing Partners: FAO
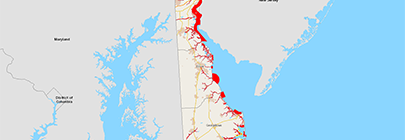
Map viewer for users to view relative risk of consuming shellfish from specific geographical locations.
Aquaculture application: This map viewer indicates seasonally approved and prohibited areas for shellfish harvest.
Contributing Partners: Delaware Department of Natural Resources and Environmental Control
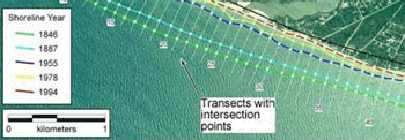
Allows users to visualize computational data on the rate of shoreline change using multiple historical shoreline positions.
Aquaculture application: Assesses the effects of moving shorelines on nearshore aquaculture siting.
Requirements: Software – ArcGIS 10.X, Download
Contributing Partners: USGS

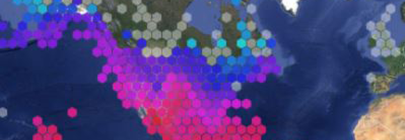
The Ecological Marine Units (EMU) map seeks to portray a systematic division and classification of physiographic and ecological information about features in the ocean. The explorer brings a fully interactive map to users, of marine ecology that is fully 3D and covers all of the oceans will make it possible for users to navigate through the ocean and observe a wide range of ocean parameters such as salinity and oxygen levels, as you explore from the surface down to the ocean floor.
Aquaculture application: This application allows for coastal managers and the aquaculture industry to have a rough characterization of dissolved chemical components at various depths throughout the World’s oceans. These estimates can aid in screening areas for aquaculture.
Contributing Partners: ESRI
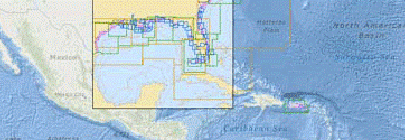
Identify and download the NOAA Nautical Chart needed for a specific planning area. This simplifies the use of electronic navigational charts, and ensures the user has the most up-to-date ocean-use information.
Aquaculture application: Users can access NOAA’s up-to-date nautical charts to assist in aquaculture screening and siting.
Contributing Partners: NOAA OCM
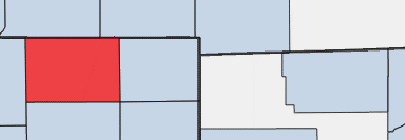
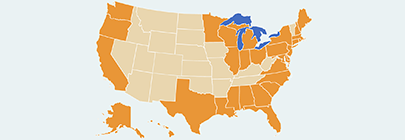
This tool streamlines the task of obtaining and comparing economic data, at both the county and national scale, for the six economic sectors dependent on the ocean and Great Lakes.
Aquaculture application: This interactive tool allows users to quickly access and view summary data for various ocean economies including: living resources, marine construction and transportation, offshore mineral resources, ship and boat building, and tourism and recreation. This can aid users in gauging the economic impacts of new aquaculture operations on U.S. coastal ocean region’s working waterfronts.
Contributing Partners: NOAA OCM
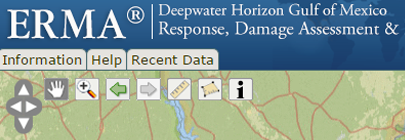
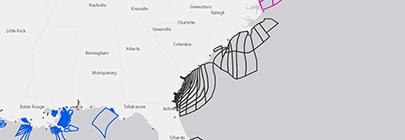
As a response to the unprecedented Deepwater Horizon oil spill in the Gulf of Mexico in 2010, NOAA’s Office of Restoration & Response (OR&R) created an interactive web map to communicate to the public about potential impacts and restoration of the affected coastlines and the Gulf itself.
Aquaculture application: OR&R keeps the ERMA viewer active and updated with various studies completed after the Deepwater Horizon oil spill about impacts to the surrounding Gulf environment. As petroleum products have the potential to bioaccumulate in aquaculture organisms, numerous studies were conducted post-spill, and results are now integrated into the web viewer for visualizations of products. These products include numerous reports for oysters, a major aquaculture species in the Gulf region.
Contributing Partners: NOAA Office of Response and Restoration
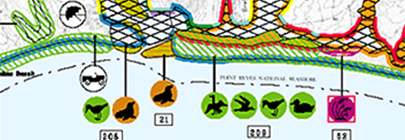
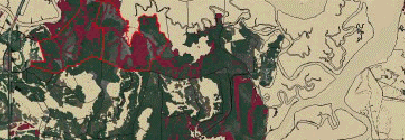
Environmental Sensitivity Index (ESI) maps provide a concise summary of at risk coastal resources if an oil spill, or other technological disaster, occurs. Examples of at-risk resources include biological resources (e.g., shellfish beds), sensitive shorelines (such as marshes and tidal flats), and in-water aquaculture assets.
Aquaculture application: Shellfish operators can utilize ESI maps to determine vulnerable locations to technological disasters, such as oil spills, and plan accordingly if a spill were to occur. Proper protective spill equipment (e.g., booms) and actions can be implemented, reducing the environmental consequences of the spill and the cleanup efforts.
Contributing Partners: NOAA NOS Office of Restoration & Response
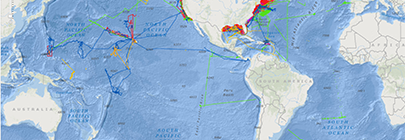
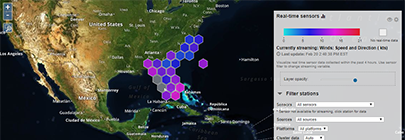
The Environmental Sensor Map integrates regional, national, and global real-time data across the Integrated Ocean Observing System (IOOS) enterprise. Data from observing systems can be directly accessed through the map. Overall, the map connects to over 31,000 stations providing the latest information on oceanographic and meteorological conditions.
Aquaculture application: Users can visualize real time maritime and atmospheric data, as well as forecasted data, which can be utilized by aquaculture industry and coastal managers for management and planning.
Contributing Partners: IOOS
This tool provides easy access to greater than 40 years of ocean science studies, informing policy decisions.
Aquaculture application: Provides searchable engine for scientific studies related to aquaculture.
Contributing Partners: BOEM, NOAA OCM
View Product
A downloadable application that estimates the annual rainfall and frequency of runoff from a specified area located within the United States (including Puerto Rico). Estimates are based on local soil conditions, land cover, and historic rainfall records.
Aquaculture application: This software aids shellfish farmers in analyzing local rainwater runoff rates in efforts to site shellfish leases with a decreased risk of closure due to stormwater runoff.
Contributing Partners: EPA
Display essential fish habitat areas and the restrictions, or needed data associated with those areas. Users can also query spatial information from fishery management plans.
Aquaculture application: Identify potential sensitive habitats, and information for EFH consultations, to identify and report any sensitive habitats overlapping with siting of new aquaculture infrastructure.
Contributing Partners: NOAA Office of Habitat Conservation
View Product
Allows users to view, retrieve, visualize and analyze a wide range of estuarine data from multiple authoritative sources.
Aquaculture application: Interactive software application for water quality conditions for screening and siting aquaculture.
Requirements: Download
Contributing Partners: EPA
View Product

The FAO Guidance on spatial technologies for disaster risk management in aquaculture provides concepts and technical information to raise awareness and improve knowledge of the spatial technologies available to decision-makers, managers and technical personnel involved in disaster risk management (DRM) for aquaculture. Also includes:
Aquaculture application: Used for planning, risk reduction, preparedness, and use of spatial technologies for aquaculture application.

The State of World Fisheries and Aquaculture (SOFIA) is the flagship publication of the FAO Fisheries and Aquaculture Department. This premier advocacy document is published every two years to provide policy-makers, civil society and those whose livelihoods depend on the sector a comprehensive, objective and global view of capture fisheries and aquaculture, including associated policy issues.
Aquaculture application: Compiles a world perspective on capture fisheries and aquaculture providing updated information on production, policy changes across the globe, and innovative technology.
Contributing Partners: FAO
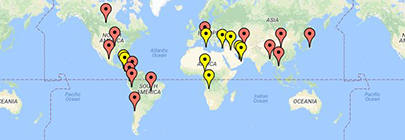
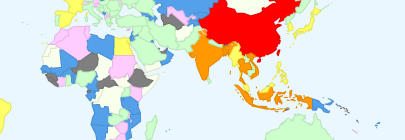
The National production page includes a map on aquaculture production of aquatic animals for human consumption (tonnes) in 2009.
Aquaculture application: These mapping efforts depict a global overview of aquaculture production by category (fish, shellfish, etc.) helping the user assess the global market.
Contributing Partners: FAO

This model estimates production of cultivated shellfish such as mussels and oysters in estuaries and coastal systems. FARM is designed for industry or for permitting purposes, in order to determine the appropriate shellfish density for optimal carrying capacity.
Aquaculture application: FARM allows users to properly plan for optimal shellfish carrying capacity during the farm design process.
Requirements: Technical training and purchase of FARM Software
Contributing Partners: FARM

FishStatJ is a downloadable desktop application providing users with access to a variety of fishery statistical datasets.
Aquaculture application: Allows decision makers and stakeholders access to statistical datasets browsing, data mining, charting and reporting, filtering, grouping and aggregation aquaculture and fisheries related data.
Contributing Partners: FAO
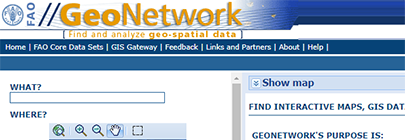
This international portal grants users access to spatial data and information to support decision making. GeoNetwork opensource allows to easily share geographically referenced thematic information between different organizations. Search for FAO Fisheries and Aquaculture maps and data within this viewer.
Aquaculture application: Tool provides worldwide geo-spatial data in support of agricultural growth and development. Maps of farm gate value, global scale aquaculture trends, and other aquaculture-relevant data visualizations.
Contributing Partners: FAO

GISFish sets out the issues in Fisheries and Aquaculture, and demonstrates the benefits of using GIS, remote sensing and mapping to resolve them. GISFish is broadly divided into two domains, GISFish Aquaculture and GISFish Capture Fisheries with a wide range of material and information that is shared between the two domains.
Aquaculture application: GISFish provides users with the ability to analyze situations in which many diverse factors have to be considered to reach a decision, and to forecast how various elements important for aquaculture will interact.
Contributing Partners: FAO
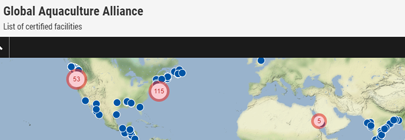
A global map depicting all the aquaculture facilities that have the Best Aquaculture Practices (BAP) Certification. These aquaculture operations have met certain quality standards to receive the BAP certification.
Aquaculture application: The map identifies the locations of all BAP-certified farms, hatcheries, feed mills, processing plants and repackaging plants.
Contributing Partners: Global Aquaculture Alliance
View Product
This document is a comprehensive list of available Federal agencies and services that can assist in the development and execution of aquaculture in the United States.
Aquaculture application: This document provides valuable information regarding Federal resources, which will assist farmers in their preparation and operation of U.S. based aquaculture related businesses.
Contributing Partners: National Science and Technology Council
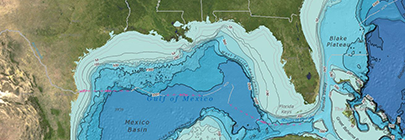
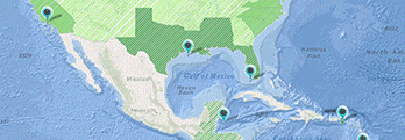
The Gulf AquaMapper is a web-mapping application designed to assist managers in identifying suitable areas for aquaculture development in the Gulf of Mexico. The application provides high resolution maps to improve the coordination and transparency of permits and siting, which in turn reduce planning costs on industry and regulatory agencies and allow for more investment opportunities in domestic seafood production.
Aquaculture application: Online spatial screening tool consisting of aquaculture relevant data for the Gulf of Mexico.
Contributing Partners: NOAA, Marinecadastre.gov, OCM
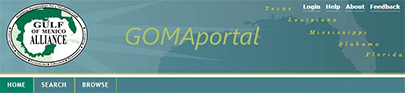
GOMAportal.org is a metadata catalog and data repository for Gulf of Mexico related geospatial datasets.
Aquaculture application: Users can identify and research data available for planning, screening, and siting for coastal aquaculture in the Gulf of Mexico.
Contributing Partners: Gulf of Mexico Alliance, GOMA Ecosystems Integration and Assessment Priority Issue Team, Harte Research Institute for Gulf of Mexico Studies, NOAA National Coastal Data Development Center
State Partners: Alabama Department of Conservation and Natural Resources, Marine Resources Division, Florida Fish and Wildlife Conservation Commission Fish and Wildlife Research Institute, Louisiana Department of Wildlife and Fisheries, Mississippi Department of Marine Resources
University Partners: Florida Institute of Oceanography, University of New Orleans Pontchartrain Institute for Environmental Sciences, University of Southern Mississippi Gulf Coast Geospatial Center
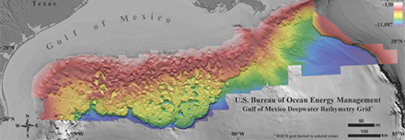
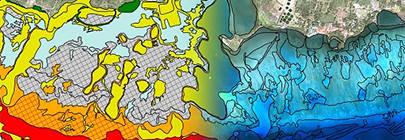
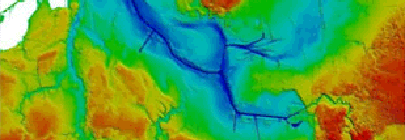
Created by utilizing 3D seismic data which covers more than 90,000 square miles of enhanced resolution bathymetry data for the deep waters of the Gulf of Mexico.
Aquaculture application: Enhanced high resolution imagery of deepwater bathymetry allows for a more informed aquaculture site suitability analysis. High-resolution, accurate bathymetry increases accuracy of estimates for oceanographic, habitat-related, and hydrographic parameters within a given area.
Contributing Partners: BOEM
Requirements: Download
Free, open-source software models where users may map and value goods and services form the ecosystem that help to sustain and fulfill life.
Aquaculture application: Enables decision makers to assess the trade-offs associated with alternative choices, where investment in natural capital (aquaculture), can enhance human development and conservation in terrestrial, freshwater, and marine ecosystems.
Requirements: Download software
Contributing Partners: Natural Capital Project
View Product

IOOS is an integrated network of people and technology gathering observing data and developing tracking and predictive tools to benefit the economy, the environment, and public safety at home, across the nation, and around the globe.
Aquaculture application: IOOS buoys and sensor stations provide real-time data and data products for numerous areas around the nation. Many of the atmospheric and oceanographic parameters are needed for siting and monitoring aquaculture operations.
Contributing Partners: NOAA
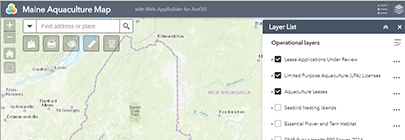
The map viewer displays Maine aquaculture leases and licenses with links to basic information, and Maine shellfish growing areas with links to their water quality classification information.
Aquaculture application: The map viewer can be used for aquaculture screening and risk communication for lease bed harvest closures.
Contributing Partners: The state of Maine, Maine Department of Marine Resources
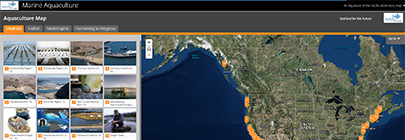
This story map highlights the various types of marine aquaculture in the U.S. The map is not exhaustive and does not feature every domestic farm. It does provide a general overview to highlight the general landscape of marine aquaculture production in California and the U.S.
Aquaculture application: Learn about where, and what type of aquaculture is occurring around the nation.
Contributing Partners: Aquarium of the Pacific
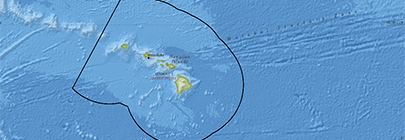
This portal contains ecological datasets including marine environmental, benthic habitats, fishes, sea turtles, marine mammals and seabirds off the Main Hawaiian Islands.
Aquaculture application: Datasets may be used to assist in siting offshore aquaculture operations in federal waters.
Contributing Partners: NOAA/NCCOS, BOEM
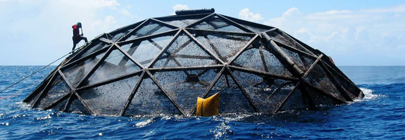
Provides an assessment of marine cage culture and environmental interactions
Aquaculture application: This technical overview is a state of science analysis providing information about the potential environmental impacts of finfish cage culture systems, and guidance for best farm practices for sustainable farming. Additional guidance is provided for permitting and monitoring for U.S. regulatory agencies, as well as for coastal stakeholders aiming to make informed aquaculture decisions.
Contributing Partners: NOAA NOS NCCOS
View
A collection of over 250 geoprocessing tools and data products in one GIS toolbox that can easily be imported into a user’s GIS environment.
Aquaculture application: Coastal aquaculture planning, screening, and siting at global, national, regional, and in some cases, local scales.
Requirements: ArcGIS 10.x
Contributing Partners: Duke University, NOAA OCM
View Product
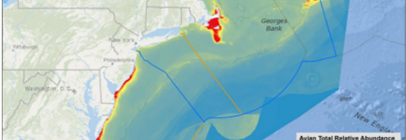
Collaboration to produce “base layer” predictive model products with associated uncertainty products for 29 marine mammal species or species guilds and 40 avian species, and three geospatial products for 82 fish species.
Aquaculture application: Decision support tools for aquaculture coastal managers and stakeholders to view numerous sets of biological data, as well as derived data products.
Contributing Partners: Duke University (MGEL), NOAA, NCCOS, Loyola University
Supplies baseline ocean planning data and allows for high quality visualizations for marinecadastre.gov data. Data and metadata can be viewed and downloaded as well.
Aquaculture application: Download and visualize 249 various data layers for coastal planning, including spatial data for the Nation’s aquaculture industry (search for the “aquaculture” layer).
Contributing Partners: BOEM, NOAA OCM
View Product
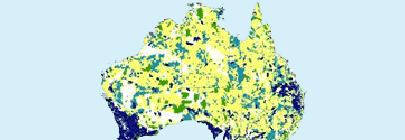
Supports conservation planning design and evaluation through the development of multiple-use areas and plans for natural resource management.
Aquaculture application: Employ this tool to meet ecological, social, and economic objectives for coastal aquaculture planning.
Requirements: Download
Contributing Partners: University of Queensland Australia
Interactive decision-support tool for the Maryland coastline assisting shellfish growers in siting and gauging risk for aquaculture operations by providing conditions and resource conflicts based on existing datasets.
Aquaculture application: The tool is designed to provide information to help potential shellfish farmers determine site feasibility, potential risks, and long-term suitability for particular areas in Maryland.
Contributing Partners: Maryland DNR
View Product
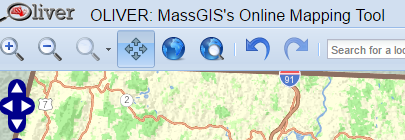
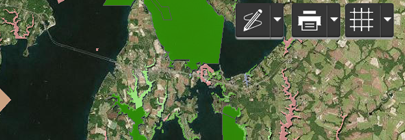
Interactive coastal ocean decision-support tool for the Massachusetts coastline providing many data layers pertinent to coastal management, including spatiotemporal information of shellfish aquaculture.
Aquaculture application: The tool is designed to aid in ocean planning. Included are layers for shellfish bed closures, and a site suitability layer for certain shellfish species.
Requirements: Must search for shellfish and shellfish suitability
Contributing Partners: MassGIS
View Product
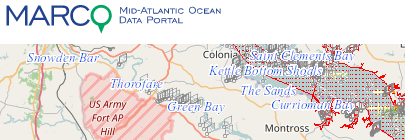
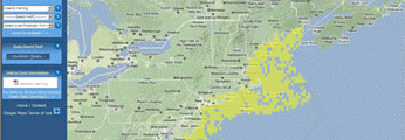
This highly-functional online toolkit and resource center consolidates available data and enables a multitude of stakeholders to visualize and analyze ocean resources and human use information such as fishing grounds, recreational areas, shipping lanes, habitat areas, and energy sites, among others.
Aquaculture application: MARCO serves as a platform to engage all stakeholders in the five coastal mid-Atlantic states, assembling much of the essential data needed for aquaculture screening in the region. MARCO uses a customized, state-of-the-art mapping and visualization technology to better engaged all stakeholders in the ocean planning process.
Contributing Partners: MARCO
View Product
The National production page includes a map on aquaculture production of aquatic animals for human consumption (tonnes) in 2009.
Aquaculture application: This map depicts a global overview of aquaculture production by category (fish, shellfish, etc.) helping the user asses the global market.
Contributing Partners: FAO
View Product
Allows users to assess (i.e., calculate) and better understand cumulative effects for numerous management scenarios (e.g., climatic variability, site conflicts). The tool supports adaptive management by integrating monitoring data and new knowledge or models to better understand how well an area is meeting conservation objectives.
Aquaculture application: This tool allows users to Integrate conservation tools and practices with aquaculture screening and siting in the pursuit of an ecosystem approach to aquaculture.
Requirements: Monetary: Non-commercial user – free; commercial user – $2500 for the first year; Software: ArcGIS 10.X and spatial analyst extension
Contributing Partners: NatureServe
View Product
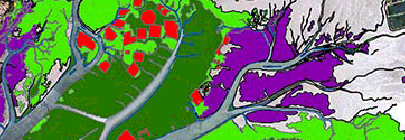
Allows users to interactively view data, aerial imagery, dive photography, underwater video and related publications developed for the benthic habitat mapping of many U.S. coral reefs. In addition to viewing benthic habitat data, users can examine the attributes of the data and view different thematic representations. Photos and videos taken during dive missions are linked to the location of the dives.
Aquaculture application: The application allows aquaculture coastal managers and industry to visualize the benthic habitat, and make screening and siting decisions based on benthic composition.
Description: Search geographically for studies and data available from NOAA’s NOS NCCOS. This map viewer allows users to search, locate, download, and utilize data for a chosen area of interest.
Aquaculture application: Users can search for data and information on scientific studies carried out within an area of interest for aquaculture operations. Data needed can then be downloaded in a number of user-friendly formats.
Contributing Partners: NOAA NCCOS
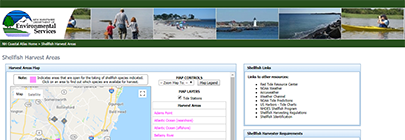
The interactive viewer allows visualization of New Hampshire shellfish harvest areas, the status of those areas, and licenses required for harvesting various shellfish species.
Aquaculture application: This viewer allows for quick reference to which species and in which areas can be harvested along the New Hampshire coastline.
Contributing Partners: New Hampshire Department of Environmental Services
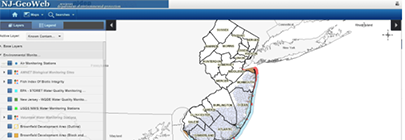
This interactive map viewer allows users to view shellfish harvest restriction and areas with closures.
Aquaculture application: This map viewer indicates seasonally approved and prohibited areas for shellfish harvest.
Contributing Partners: New Jersey Department of Environmental Protection
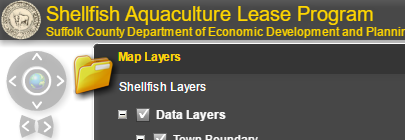
Interactive decision-support tool for the New York coastline (i.e., Suffolk County) that will assist new or current shellfish growers in determining the health and most feasible site for shellfish aquaculture.
Aquaculture application: The tool is designed to provide information to help shellfish farmers determine site feasibility, potential risks, and long-term suitability for particular areas in New York.
Contributing Partners: Suffolk County Aquaculture Lease Program
View Product
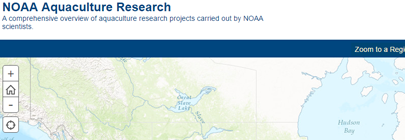
Users can preview coastal aquaculture research NOAA conducts in many coastal states of the nation. This interactive map viewer provides a comprehensive overview of aquaculture research projects carried out by NOAA aquaculture scientists.
Aquaculture application: Users can explore the many exciting projects conducted by NOAA scientists, glimpsing into new and emerging research and technology being carried out to ensure sustainable and environmentally conscious aquaculture for the future.
Contributing Partners: NOAA NMFS
View Product
This interactive viewer allows for the identification of NOAA bathymetric data for both visualization and download. The viewer contains single-beam tracklines, multibeam surveys and mosaics for data visualization, the NOS hydrographic surveys, BAG footprints and shaded imagery, digital elevation models (DEMs), and coastal LiDAR datasets available.
Aquaculture application: Coastal managers and the aquaculture industry can identify potential bathymetric data available for a specific location. This data can be downloaded and used for planning purposes.
For combined bathymetric/topographic data, estuarine bathymetry, and more go to the NCEI World Data Service for Geophysics.
Contributing Partners: NOAA NCEI
Based on the idea of a traditional atlas, the Gulf of Mexico Data Atlas provides an interactive platform to view and download many data layers pertinent to ocean planning. Data layers are grouped by theme, including physical, biotic, living marine resources, socioeconomic conditions, environmental quality, and jurisdictions in the U.S. portion of the Gulf of Mexico.
Aquaculture application: The interactive Gulf of Mexico Data Atlas provides numerous themed data layers that users can visualize and download for aquaculture screening in the Gulf of Mexico.
Contributing Partners: NOAA NESDIS; NOAA NCEI
View Product
The Center for Operational Oceanographic Products and Services (CO-OPS) and its predecessors have gathered oceanographic data along our nation’s coasts for over 200 years to provide accurate forecasts. Here you can access those data and the associated map products.
Aquaculture application: Real time maritime and atmospheric data, as well as forecasted data, can be utilized by the aquaculture industry, and coastal managers, for management and planning.
Contributing Partners: NOAA CO-OPS
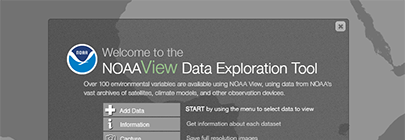
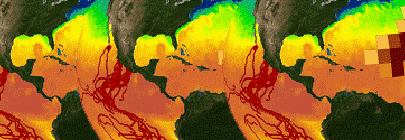
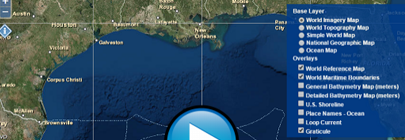
Users can visualizes numerous environmental variables at various depths and temporal distillations across the globe. The tool uses data from NOAA’s vast archives of satellites, climate models, and the NOAA Ocean Atlas.
Aquaculture application: Aquaculture coastal managers and industry can visualize and find values for numerous climatologies distilled by month, season, or year, and at numerous depths. This information can then be used for screening-level planning for aquaculture operations.
Training: Tutorial video
Contributing Partners: NOAA National Visualization Lab
Users can identify and download water column sonar data, the acoustic backscatter from the near-surface to the seafloor, to ascertain physical and biological characteristics of the seafloor including the spatial distribution of plankton, fish, methane seeps, and underwater oil plumes.
Aquaculture application: Coastal managers and the aquaculture industry can identify water column sonar data available for a specific location. This data can be downloaded and used for planning purposes.
Contributing Partners: NOAA NCEI
Interactive decision-support tool for the North Carolina coastline that will assist new or current growers in siting new or expanding shellfish operations.
Aquaculture application: The tool is designed to provide information to help potential shellfish farmers determine site feasibility, potential risks, and long-term suitability for particular areas in North Carolina.
Contributing Partners: UNCW
View Product
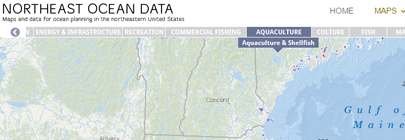
This interactive map viewer and data portal provide a comprehensive suite of up-to-date aquaculture relevant data, themed maps for the Northeastern United States (New York to Maine).
Aquaculture application: The application has many of the data layers needed to make relevant coastal aquaculture (shellfish, finfish, and algae) planning decisions at the region to local level. An additional case study of offshore shellfish aquaculture presents an excellent example of proper planning for sustainable aquaculture.
Contributing Partners: Northeast Ocean Data
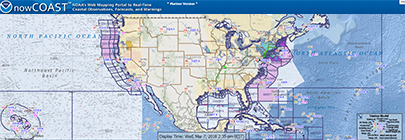
NowCOAST provides situational awareness on present and future environmental conditions for coastal and marine users by integrating data and information from across NOAA, other federal agencies and regional ocean and weather observing systems. Users can assess present conditions by creating maps of the latest in-situ weather/marine weather observations for the last few hours. In terms of future conditions, users can obtain maps of critical weather and marine weather advisories, watches, and warnings, weather forecasts, tropical cyclone track and intensity forecasts, and forecast guidance of water levels, temperature, salinity, and currents from oceanographic forecast models.
Aquaculture application: Current and forecast meteorological products available on NowCOAST help to site and monitoring coastal aquaculture operations.
Contributing Partners: NOAA/NOS
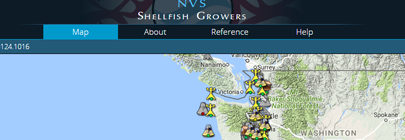
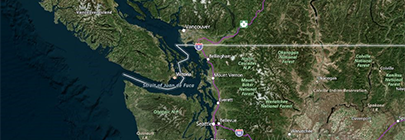
Interactive map viewer for shellfish farmers in the Pacific Northwest coastal region. This map viewer includes meteorological, physical and chemical oceanographic parameters both in real time, hincast, and forecast models. For more general information and forecasting there is the Data Explorer.
Aquaculture application: This allows shellfish growers in the Pacific Northwest to monitor current and forecasted conditions of the coastal waters that may impact farm performance.
Contributing Partners: NANOOS
View Product
Ocean Biogeographic Information System Spatial Ecological Analysis of Megavertebrate Populations, is a spatially referenced online database, aggregating marine mammal, seabird, sea turtle and ray & shark observation data from across the globe.
Aquaculture application: Assists aquaculture planners and stakeholders, in siting proper locations that will have the least impact on marine mammals, sea turtles and other protected species.
Contributing Partners: Census of Marine Life, Marine Spatial Ecology Lab

Users can access a database of environmental and historic preservation statutes, and other information on the protection of underwater cultural heritage on the outer continental shelf.
Aquaculture application: Search current laws and statutes associated with outer-continental shelf aquaculture siting in the United States.
Contributing Partners: BOEM, NOAA Office of General Counsel, NOAA OCM
View Product
This interactive map viewer and data portal displays real-time data collected from NOAA Integrated Ocean Observing System (IOOS) buoys and stations. The map viewer displays multiple parameters to include water quality data, weather data, geographical features, biological data and more for the southeastern United States (North Carolina to Florida). Data displayed in the viewer can also be downloaded by the user through the portal feature.
Aquaculture application: This interactive portal allows users to view biological, chemical, physical, meteorological, and geographical parameters for screening aquaculture locations for compatible conditions for potential aquaculture operations.
Draw a custom area anywhere in U.S. waters or pick from a predefined list of locations to get instant custom reports. Reports include descriptive infographics and supporting data that can be used for offshore planning, permitting, environmental review, public relations, and more. New features allow printing by industry, sharing, and adding custom coordinates.
Aquaculture application: Explore your ocean neighborhood, and use this decision support tool to evaluate your coastal and ocean project area to plan for aquaculture development.
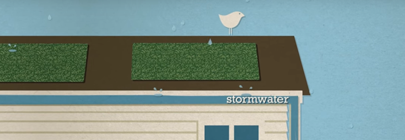
Measure potential runoff, nonpoint source pollution, and erosion.
Aquaculture application: Assess the potential for erosion and pollution from runoff on water quality in possible aquaculture development areas.
Contributing Partners: NOAA OCM
View Product
Assessment of protected species (marine mammals, sea turtles, and birds) interactions with marine aquaculture around the globe.
Aquaculture application: This state of science analysis provides information for environmental assessments and consultations for aquaculture permitting.
Contributing Partners: NOAA NOS NCCOS
View Product
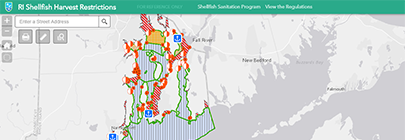
This interactive map viewer allows users to view current shellfish harvest restrictions along the Rhode Island coast.
Aquaculture application: This map viewer can be used for aquaculture screening and risk communication for lease bed harvest closures.
Contributing Partners: Rhode Island Department of Environmental Management Shellfish Sanitation Program
Users can access fisheries and fisheries-related data at spatial scales that have ecological and policy relevance, such as by Exclusive Economic Zones, High Seas, or Large Marine Ecosystems.
Aquaculture application: This interactive application gives users statistics and visualizations for fisheries and related-data for specific country’s Exclusive Economic Zone (EEZ), and can compare amongst countries to create a global view of current fisheries conditions
Contributing Partners: United Nations (FAO) FishStat database
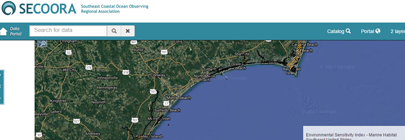
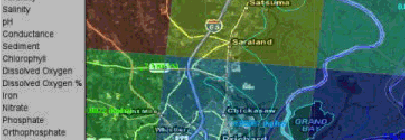
An interactive portal that displays multiple parameters to include, water quality, weather data, geographical features, essential fish habitat and more.
Aquaculture application: This interactive portal allows you to view biological, chemical and geographic parameters for the siting of aquaculture.
Contributing Partners: SECOORA, IOOS
View Product
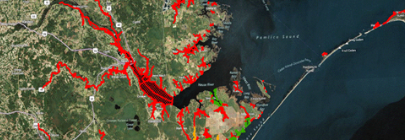
These maps show current and potential hazards to shellfish aquaculture along Virginia’s coastline.
Aquaculture application: These maps allow shellfish farmers in Virginia to make informed decisions about the siting of their leases based off current and potential water quality hazards, which could potentially reduce oyster and clam mortalities.
Contributing Partners: VIMS, CCRM
View Product
A compilation of permitting process for placement of shellfish structures (federal process), general permitting info, guidance documents, flow charts, etc. (local, state, federal process) and regulations (state).
Aquaculture application: This compilation of information will provide the knowledge needed for future shellfish farmers to properly permit and site a shellfish lease within their state.
Contributing Partners: NOAA NMFS
View Product
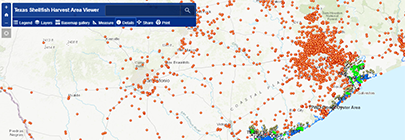
This interactive map viewer allows users to view current shellfish harvest restrictions along the Texas coastline.
Aquaculture application: This map viewer can be used for aquaculture screening and risk communication for lease bed harvest closures.
Contributing Partners: Texas Department of Health and Human Services
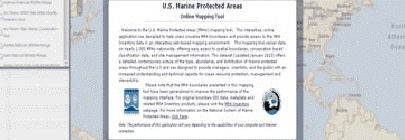
Provides access to boundaries of over 1600 MPAs, their classification, use restrictions, and associated spatial data for all marine protected areas.
Aquaculture application: User’s can visualize marine protected areas, determine if these areas prohibit aquaculture, and summarize data in a way meaningful to them.
Contributing Partners: NOAA MPA Center
View Product
Vertically transforms geospatial data between a variety of tidal, orthometric, and ellipsoidal datums, for high-resolution data products
Aquaculture application: Accurately map areas for aquaculture siting, and create high-resolution bathy topo maps through VDatum transformation.
Contributing Partners: NOAA CO-OPS, NOAA NGS, NOAA OCS
View Product
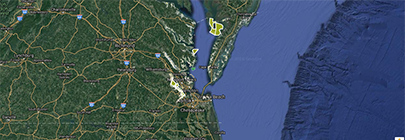
Users can explore the Virginia Marine Resources Commission interactive map of shellfish grounds, fixed fishing devices, oyster gardening permits, and habitat permits in the Chesapeake Bay area.
Aquaculture application: Users can identify current shellfish areas, closures, fixed fishing gear and sanctuaries to avoid conflicts during planning and operational phases of aquaculture.
Contributing Partners: Virginia Marine Resources Commission
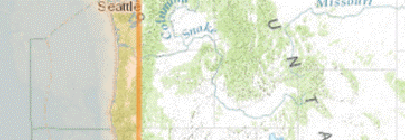
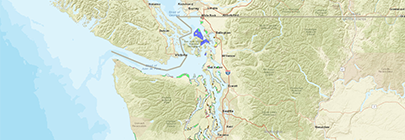
Interactive decision-support tool for the Washington State coastline and near shore waters supporting transparent data sharing and ocean-planning information.
Aquaculture application: This tool is designed to provide users visualizations of ocean and estuarine data for the state of Washington. It can aid in identifying potential risks, siting conflicts and long-term suitability for particular areas in Washington State.
Contributing Partners: Washington State Department of Ecology