 An official website of the United States government

The legacy assets are distressed investment securities held by the asset management estates (AMEs) of failed corporate credit unions.
Legacy assets primarily consist of the following:
- Private label, residential mortgage-backed securities (Non-agency RMBS);
- Agency mortgage-backed securities (Agency MBS);
- Commercial mortgage-backed securities (CMBS);
- Student loan asset-backed securities;
- Other asset-backed securities (ABS); and
- Corporate bonds.
The following graphics and tables explain key characteristics of the legacy assets that were securitized through the NGN program.
Distribution by Legacy Asset Type and Balance Outstanding (in Billions of Dollars)

| Legacy Asset Type | 2010 Q4 $B | 2011 Q4 $B | 2011 Q4 % Change | 2012 Q4 $B | 2012 Q4 % Change | 2013 Q4 $B | 2013 Q4 % Change | 2014 Q4 $B | 2014 Q4 % Change | 2015 Q4 $B | 2015 Q4 % Change | 2016 Q4 $B | 2016 Q4 % Change | 2017 Q4 $B | 2017 Q4 % Change | 2018 Q4 $B | 2018 Q4 % Change | 2019 Q4 $B | 2019 Q4 % Change | 2020 Q2 $B | 2020 Q2 % Change |
|---|---|---|---|---|---|---|---|---|---|---|---|---|---|---|---|---|---|---|---|---|---|
| Agency MBS | 0.75 | 0.65 | -14% | 0.57 | -13% | 0.49 | -13% | 0.44 | -11% | 0.37 | -14% | 0.31 | -18% | 0.25 | -18% | 0.21 | -15% | 0.19 | -12% | 0.08 | -60% |
| Student Loan | 1.19 | 0.96 | -19% | 0.78 | -19% | 0.60 | -23% | 0.48 | -20% | 0.39 | -19% | 0.30 | -22% | 0.25 | -18% | 0.23 | -7% | 0.20 | -14% | 0.20 | -1% |
| Other* | 1.33 | 1.25 | -6% | 0.89 | -28% | 0.64 | -29% | 0.39 | -40% | 0.34 | -12% | 0.29 | -15% | 0.28 | -2% | 0.35 | 22% | 0.34 | -2% | 0.34 | -1% |
| CMBS | 4.39 | 4.31 | -2% | 4.15 | -4% | 3.98 | -4% | 3.74 | -6% | 2.20 | -41% | 0.39 | -82% | 0.11 | -72% | 0.09 | -17% | 0.07 | -18% | 0.07 | -9% |
| Non-agency RMBS | 32.31 | 27.13 | -16% | 21.81 | -20% | 18.21 | -17% | 16.00 | -12% | 13.97 | -13% | 12.02 | -14% | 8.44 | -30% | 6.74 | -20% | 5.45 | -19% | 4.75 | -13% |
| Total | 39.97 | 34.30 | -14% | 28.20 | -18% | 23.92 | -15% | 21.05 | -12% | 17.28 | -18% | 13.30 | -23% | 9.33 | -30% | 7.62 | -18% | 6.25 | -18% | 5.43 | -13% |
* "Other" is comprised of corporate debt and other asset-backed securities.
The reduction of the balance outstanding is a result of principal repayments of $26.5 billion, realized losses of $4.8 billion, and post-securitized asset sales of $3.3 billion.
Legacy Assets Contributed by Asset Management Estate at Liquidation

Credit Rating Distribution of Legacy Assets at Issuance Versus Liquidation of Corporate Credit Unions
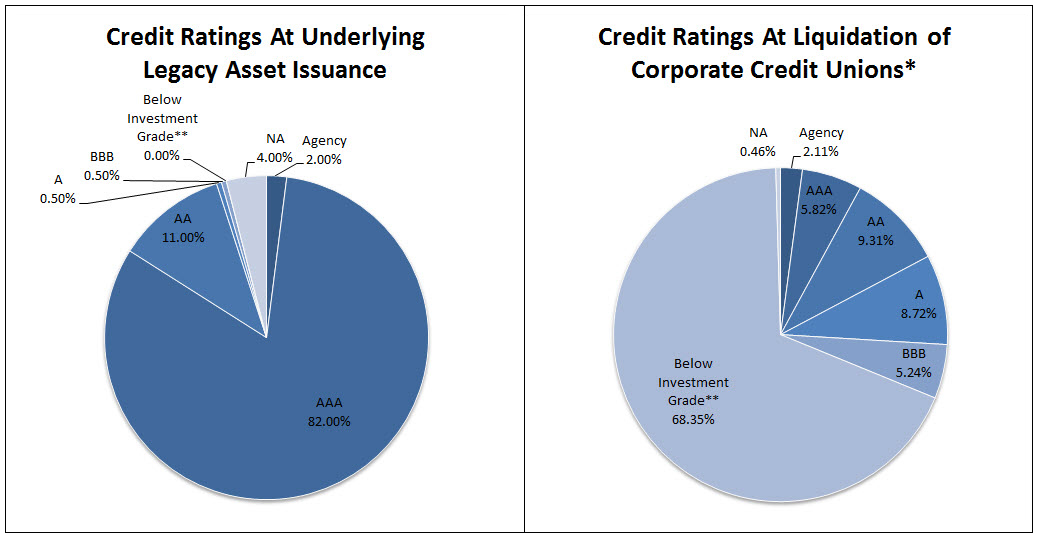
The rating is based on the lowest published rating by S&P, Moody’s, or Fitch.
* Ratings are as of December 31, 2010, which approximates the liquidation date of the failed corporate credit unions.
** Below Investment Grade means rated below BBB-
Rating Distribution of Legacy Assets
The following information will be updated semi-annually. The next update will occur by April 2021.
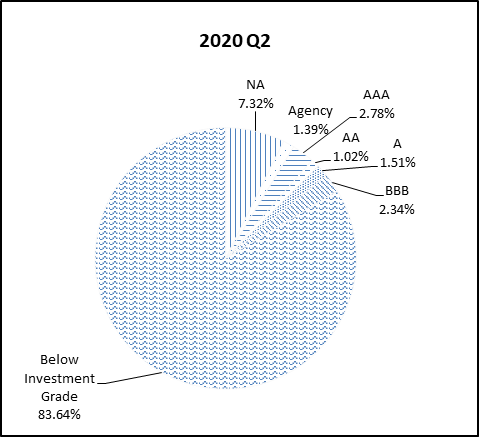
- Ratings Distribution History
- The rating is based on the lowest published rating by S&P, Moody’s or Fitch.
- “Below Investment Grade” means rated below BBB-.