Flame & Flood


Images in title graphic courtesy of Virtual Jamestown(left) and The Geologic Story of the Columbia Basin (right).
By Amy Casey
The fastest-growing cities in the world are often located in the warmest, sunniest climates. Phoenix, Arizona, which sprawls over a 2,000-square-mile (5,180-square-kilometer) area in the southwestern United States, provides warm weather and a cosmopolitan lifestyle that attracts retirees and young families alike.
In the past 10 years, the city’s population has increased over 30 percent to 1.3 million in 2000, according to the Greater Phoenix Convention and Visitors Bureau. With rapid growth comes a demand for new housing, which motivates builders to spread farther into the surrounding Sonoran desert.

These photographs show the Sonoran Desert in different stages: normal vegetation (upper left), burning desert (upper right), and a landscape with burned areas in the foreground and unburned desert behind. (Top right image courtesy of the USGS Western Ecological Research Center. Other images courtesy of Michael Ramsey, University of Pittsburgh).
In the desert, fires can move fast; constant winds funnel through shallow dry creek beds to keep parched vegetation burning. A hot fire can make soil “hydrophobic,” meaning that water runs off instead of soaking into the ground. Increased runoff after a subsequent rainstorm can cause sudden or “flash” floods that erode surface soil.

The ASTER instrument uses three cameras simultaneously to view the Earth. (Image courtesy of the EOSDIS Terra Data Sampler Number 1.
Arizona’s 2000 wildfire season was the worst in 50 years, burning more than 3.5 million acres and over 800 structures. The damage done by fires that summer prompted Ramsey to propose a study using past fires to predict future fire and flood hazards.
Ramsey uses data collected by the Advanced Spaceborne Thermal Emission and Reflection Radiometer (ASTER) instrument on NASA’s Terra satellite. Using ASTER imagery, he looks for fire scars, which he defines as “large tracts of land with highly burned vegetation or no vegetation cover at all.”

This ASTER image, acquired at 15-meter resolution overlain with vector polygons, shows fire scars in the northeast Phoenix valley. (Image courtesy of Michael Ramsey, University of Pittsburgh).
ASTER captures images in several wavelengths: visible near-infrared (VNIR), short-wave infrared (SWIR), and thermal infrared. “We focus on the visible (shorter) wavelength, because it has the highest spatial resolution. But we can also detect different ages of fire scars using different wavelength regions. The longer wavelengths, such as thermal IR, are more sensitive to vegetation,” said Ramsey.
While ASTER’s high-resolution images aid in identifying fire scar locations, the study requires information about plant growth and erosion that ASTER cannot provide. “Even with ASTER’s high resolution, the changes in stream channels are too subtle to detect,” said Ramsey. So he and his colleagues, Ramon Arrowsmith, associate professor at Arizona State University, and Tamara Misner, a graduate student at the University of Pittsburgh, trek to the desert to gather more detailed information.

Sediment traps are buried in drainage areas to collect eroded sediment from runoff. (Image courtesy of Tamara Misner, University of Pittsburgh).
In another phase of the study, Arrowsmith and Ramsey team up for aerial photography using either a kite or weather balloon that carries a remotely controlled digital camera. A long tether attaches the balloon to a heavy-duty kite reel, which straps around the waist of the person controlling it. “It’s fun, but I’ve actually been dragged across the ground a couple of times,” Ramsey said, laughing. “The wind blowing the kite can put a lot of force on you.”
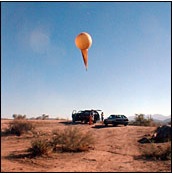
Scientists prepare a helium weather balloon for an aerial photography mission. (Image courtesy of Michael Ramsey, University of Pittsburgh).
The combination of aerial photography and ASTER VNIR data shows differences in vegetation between burned and unburned areas. It also illustrates fire scar recovery. In the spring after a fire event, seasonal grasses bloom, hiding the fire scar from the casual observer. But over several years, aerial photographs taken in the same area show larger plant growth, such as trees and saguaro cacti.

This balloon aerial photograph shows an area burned by the Camp Fire in June, 1994, and by the Dynamite Fire in July, 1995. The dotted line delineates between burned (left) and unburned (right) areas. A pickup truck on the road shows the scale of the image. (Image courtesy of Michael Ramsey, University of Pittsburgh).
“To get people to stand up and take notice is a difficult thing. You can’t ring all the alarm bells and say, ‘Danger, danger, danger!’ but you can present them with the facts,” Ramsey said.
Ramsey acknowledged that the results of the study will not stop development, but they could encourage better planning. “City planners might consider putting in more buffers, such as placing houses further from creek beds and installing more fire hydrants,” he said.
Ramsey is also involved in NASA’s Urban Environmental Modeling Project, which uses ASTER data to study 100 of the world’s fastest-growing cities, including Phoenix. “A logical extension of fire scar pattern recognition is to apply it to other project cities located in similar climates. In Sydney, Australia, huge fires broke out during the summers of 2001 and 2002 right at the edge of the city. Although that area is more humid than most arid regions and has different vegetation types, we can apply what we’ve learned in Phoenix,” he said.
Ramsey hopes the results of his study will also be helpful in predicting hazards around sprawling cities in different climate zones. “Large, urban areas are growing fast and are subject to a lot of potential hazards, whether it be drought or major ocean impact hazards on the coast,” he said. “We’re focused on these sprawling cities because the rapid growth is encroaching on environments that weren’t populated before. That’s the driving force behind our work.”
References
Multi-Spectral Remote Sensing of Brush Fire Scars in Arid Urban Regions: Analysis of Future Fire and Flooding Hazards. Mike Ramsey, Ramon Arrowsmith. Accessed February 28, 2003.
Ramsey, M.S., and J.R. Arrowsmith, 2001. New images of fire scars may help to mitigate future natural hazards. EOS, Trans. Amer. Geophys. Union, 82(36):393-398, September 4, 2001.
For more information
NASA Land Processes Distributed Active Archive Center (LP DAAC)
Advanced Spaceborne Thermal Emission and Reflection Radiometer (ASTER)
Identifying burn scars in arid urban regions on NASA's Earth Observatory
Image Visualization and Infrared Spectroscopy (IVIS) Laboratory
| About the remote sensing data used | ||
|---|---|---|
| Satellite | ASTER |
|
| Sensor | Local population grid | |
| Parameter | fire scars | |
| DAAC | NASA Land Processes Distributed Active Archive Center (LP DAAC) |
|
Page Last Updated: Jul 22, 2020 at 11:42 AM EDT