Employment and Trends - September 2011
Graphic Presentation of Federal Civilian Employment
Distribution of Federal Civilian Employment by Branch
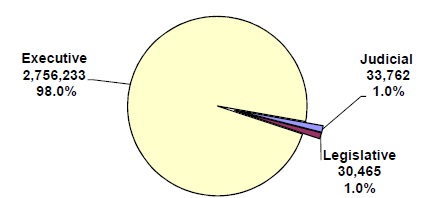
Executive Branch (98%) - 2,756,233
Judicial Branch (1.0%) - 33,762
Legislative Branch (1.0%) - 30,465
Executive Branch Non Postal Service = 2,146,312
Postal Service = 609,921
Executive Branch = 2,756,233
Total Employment = 2,820,460
Distribution of Federal Civilian Employment by Service
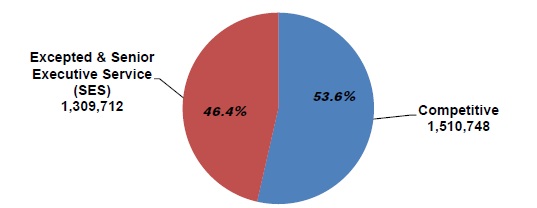
Excepted & SES (50.4%) - 1,431,349
Competitive (49.6%) - 1,407,142
Total Employment: 2,820,460
Distribution of Federal Civilian Employment by Work Schedule/Appointment

Full-time Permanent (87.3%) - 2,462,452
Part-time (4.0%) - 113,944
Full-time Temporary (5.0%) - 142,258
Intermittent (3.6%) - 101,806
Total Employment: 2,820,460
Distribution of Federal Civilian Employment by Major Geographic Area

United States Outside Washington, DC-MD-VA-WV (83.3%) - 2,350,478
Washington, DC-MD-VA-WV Core Based Statistical Area* (13.4%) - 377,373
Overseaes (3.3%) - 92,609
Total Employment: 2,820,460