Billions of GEDI forest structure measurements enhance efforts to understand, predict, and manage fire dynamics, carbon cycling, and biodiversity.
Conservation
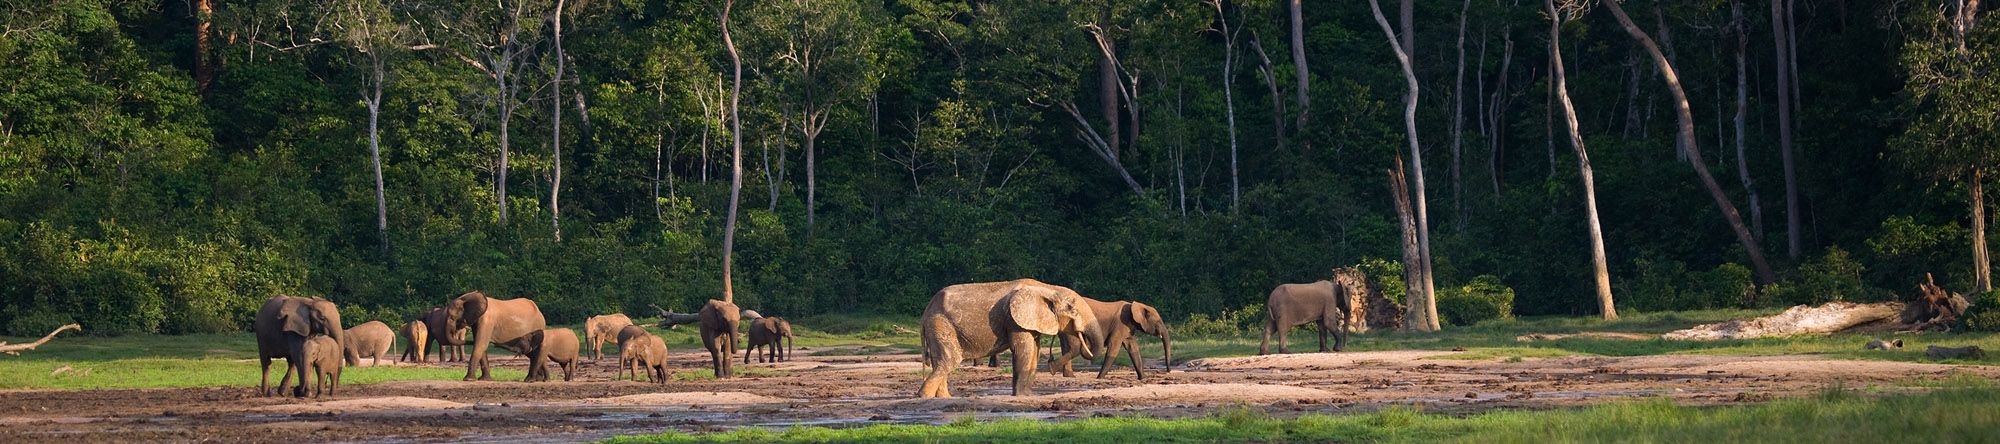
GEDI data provides globally consistent measurements of vegetation canopy vertical structure in the world’s temperate and tropical ecosystems. This information informs conservation and management of threatened and endangered species, particularly in biodiversity hotspots like the species-rich humid forests of the Amazon basin, Central Africa and Southeast Asia. These regions contain very large numbers of species that are threatened by habitat loss associated with the expansion of agriculture, logging, and mining.
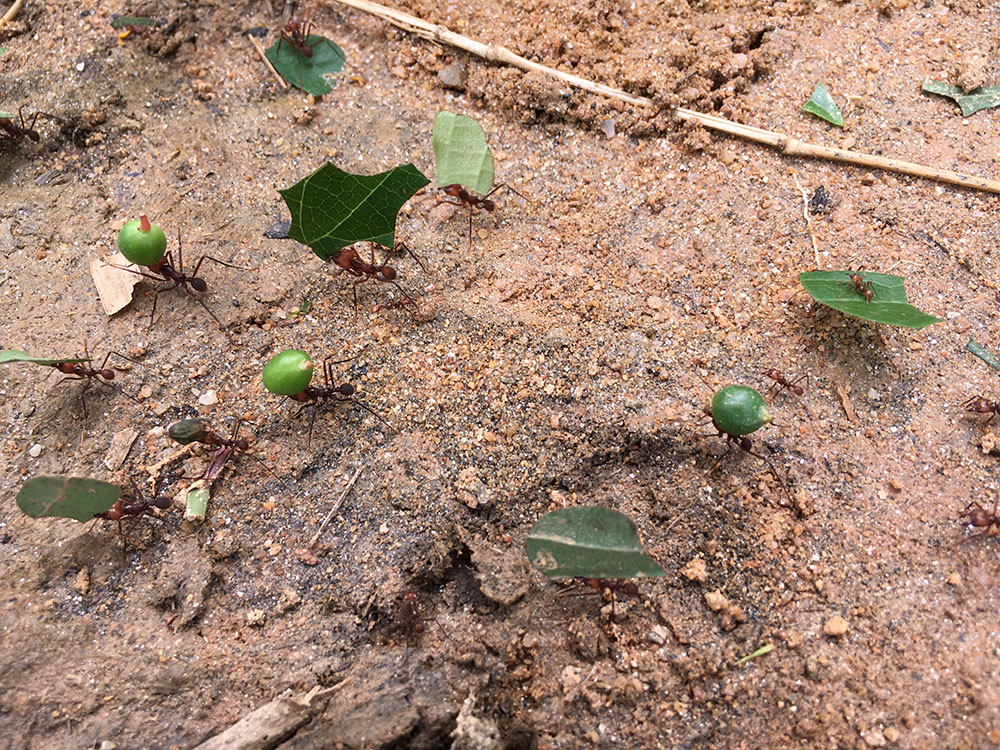
Leaf cutter ants in Colombia.
GEDI data are used to identify areas of intact forest capable of providing the structural complexity needed to support populations of threatened and endangered species. By characterizing the structure and quality of remaining high conservation value areas, and the degree to which they are connected by corridors of suitable habitat, GEDI data informs conservation planning at scales that have until now been unattainable. Information on vegetation disturbance from Landsat time-series also allows for a systematic evaluation of how vegetation structure recovers after disturbance, thereby providing information on the potential conservation value of second-growth forests.
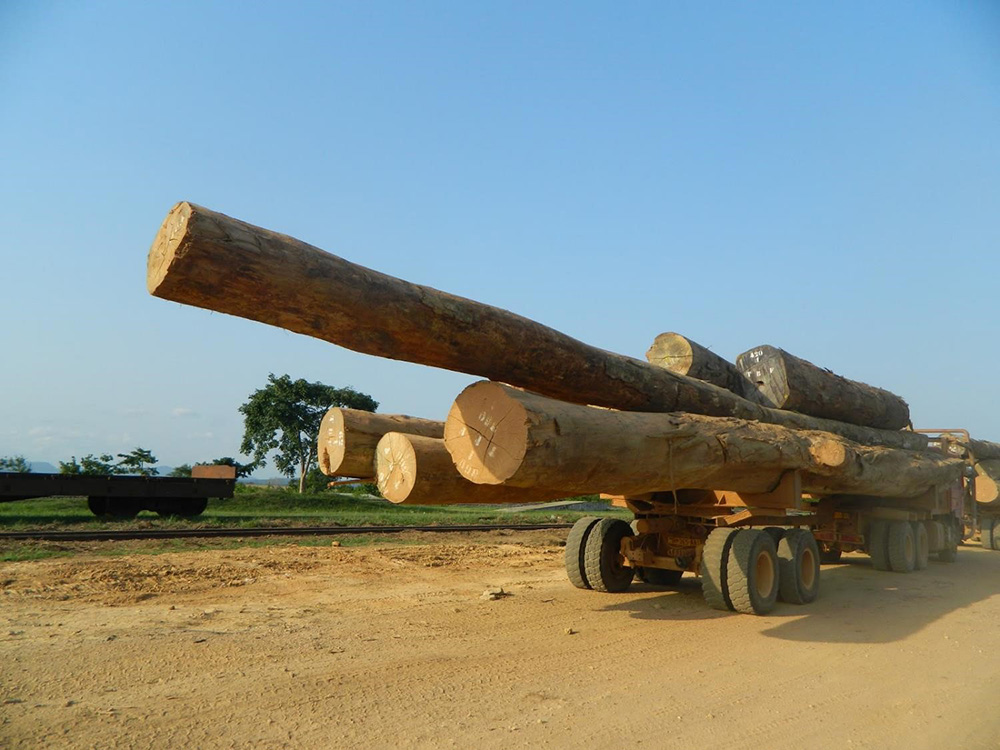
Logging truck in Gabon.
The GEDI project coordinates with civil society organizations and conservation agencies to facilitate use of data for targeting priority conservation areas and for reporting on the status of forests for the international Convention on Biological Diversity. Specific applications underway include using habitat structure information from GEDI to support activities of the Group on Earth Observations – Biodiversity Observation Network (GEO BON).
Biodiversity
The vertical distribution of vegetation is a strong determinant of habitat suitability for many animals, such as the way that primate communities partition vertical space in the forest or the way that some bat species forage within and others above the canopy. Deforestation, forest degradation, and disturbance change forest structure with potentially significant impacts on biodiversity.
We do not currently have sufficiently detailed observations sampled at high enough density to characterize the vertical distribution of vegetation. GEDI provides the observations needed to characterize how forest structure varies across major forest regions, climatic gradients, and disturbance intensities, thereby improving our understanding of how these factors interact to influence patterns of habitat quality, animal diversity, and species endangerment.
GEDI waveforms, when co-located with wildlife observations (e.g. from field surveys, automated acoustic surveys, and camera trap grids), provide researchers, managers of protected area, and conservation groups with valuable vegetation structure information that would otherwise require extensive field surveys or lidar acquisitions using airborne or terrestrial scanning systems. Fusion of GEDI data with optical and radar imagery provides wall-to-wall information on forest structure, adding an important vertical dimension to the hundreds of biodiversity and habitat use studies undertaken every year. Wall-to-wall information is especially important for linking animal movement data with data from telemetry studies.
Animal habitat use and behavior is related to vegetation structure information that can be derived from lidar. The height and vertical variability of forest canopies in the northeastern United States was used to predict and map the breeding habitat of the Black-throated Blue Warbler, a Neotropical migratory bird. Lidar vegetation mapping combined with GPS telemetry data in Kruger National Park, South Africa, revealed that male lions tend to ambush prey in dense vegetation while female lions tend to hunt cooperatively in more open habitat.
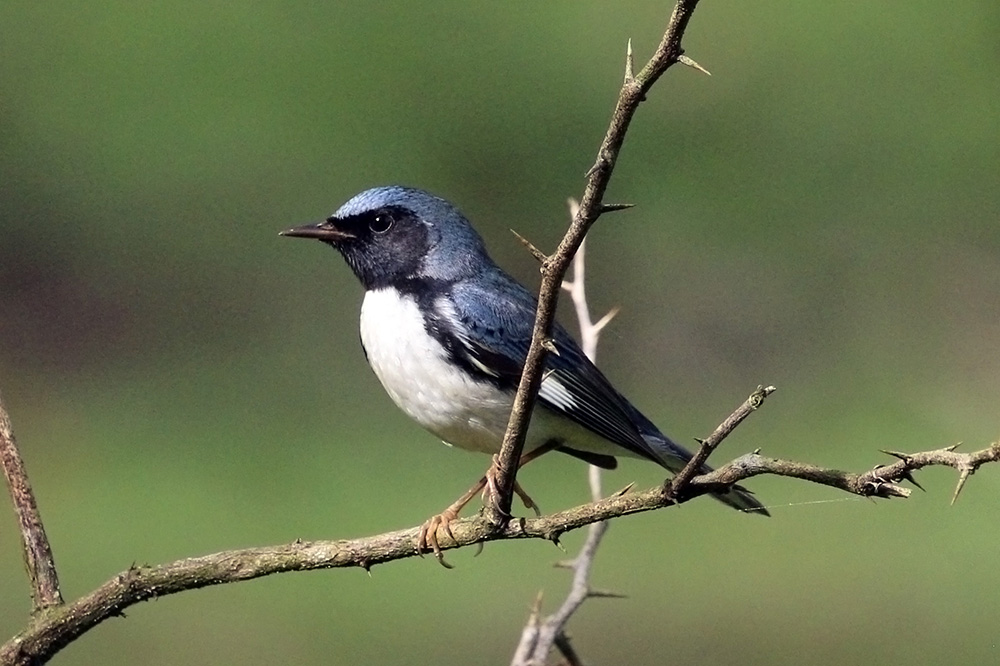
Black-throated blue warbler. Credit: Charlesjsharp
Ecosystem Modeling
Ecosystem models may be used to improve both our scientific understanding of how ecosystems work and inform decisions about how we manage ecosystems. Dynamic vegetation models represent factors that influence how, where, and what kind of vegetation grows in a given place. Vegetation models that represent forest as individual trees or as cohorts can use information on canopy height, canopy form, leaf area index, biomass, and other vegetation characteristics to improve the accuracy of model projections of variables such as carbon flux in heterogeneous landscapes. Ecosystem models can be used to quantify the climate mitigation benefits of re-growing tropical forests, to understand carbon dynamics of different forest harvest strategies, or to estimate impacts of changing fire regimes on carbon stocks. However, environmental and land use gradients often change significantly over short distances, causing forest structure to change rapidly with distance as well. This makes models sensitive to spatial scale and contributes to model error. Because canopy height and structure are important components of many vegetation models, billions of closely spaced observations from GEDI can improve the overall accuracy and spatial detail of these models, greatly increasing their usefulness as tools for policy, planning, and research.
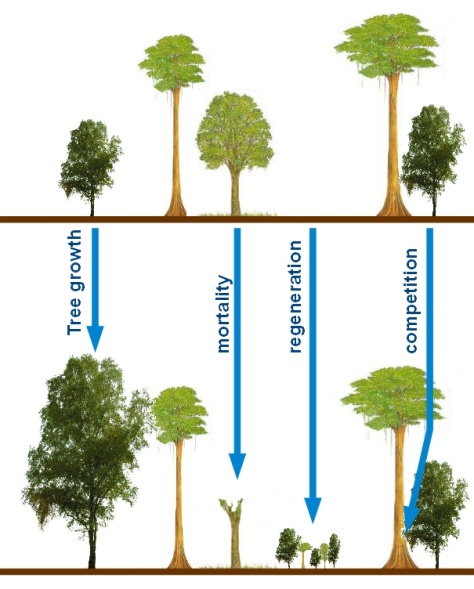
Forest demographic processes represented by an individual based dynamic vegetation model (www.formind.org). Forest structure measurements from GEDI can be used to improve representation of these and other processes that influence the future of forests.
Fire Modeling
The behavior of fire in the landscape, whether as a prescribed burn or a wildfire, is dependent on the amount and distribution (horizontal and vertical) of available fuel. Fuel, in turn, is linked to characteristics of the vegetation: structure as well as type and moisture. How fuel is organized spatially can have an immediate impact on how a given fire behaves. For example, the likelihood of fire spreading into the canopy may be low where there is a significant gap in the vertical vegetation column between fuels at the surface and fuel within the canopy. However, if so-called ladder fuels are present, leading to a continuous fuel column, fire may spread more readily into the canopy, given other favorable conditions.
Because of the strong link between fire and vegetation structure, the fire community has long been interested in using lidar to characterize the spatial patterns in fuels across the landscape. Lidar has the capacity to measure vegetation structure, which is linked to fuel loads, directly, making it well suited for the remote estimation of fuel parameters across large areas. These estimates can supplement the direct, local observations of fuel characteristics, thereby describing fuel loads over landscape to regional scales. While several fuel metrics, especially those associated with describing the canopy fuel portion, have successfully been derived using lidar data, at- or near-surface fuel characterization is more challenging and requires more development before becoming operational.
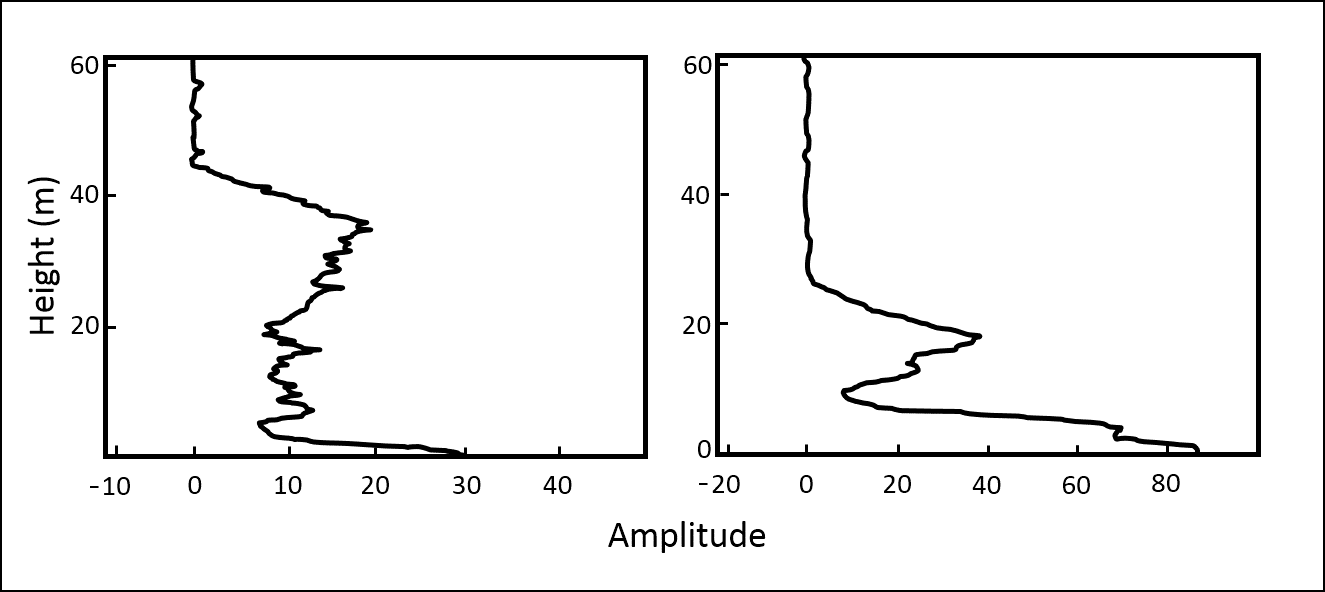
The shape of the two lidar waveforms indicates the vertical distribution of vegetation through the canopy column. The waveform on the left suggests the presence of vegetation from the ground surface into the upper canopy, possibly an indicator of ladder fuel. The waveform on the right indicates a gap between surface and canopy fuels, and hence a potentially lower risk of fire spreading from the surface into the canopy. Credit: Birgit Peterson
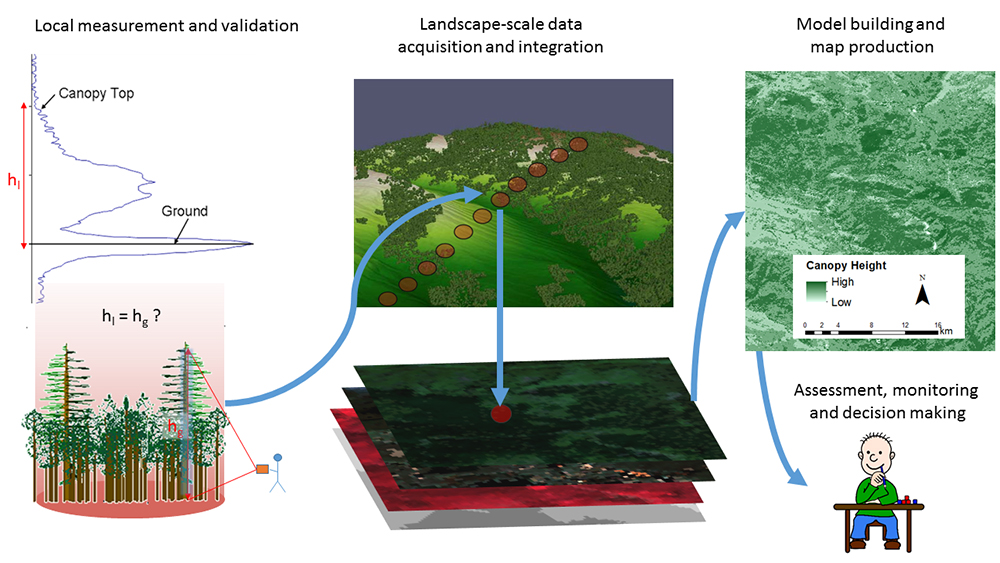
GEDI enables land managers to assess the efficacy of fuel treatments within the landscape over space and time, to identify areas with high fuel loads and thereby potentially at higher risk to fire, and to monitor the impacts of other factors affecting ecosystems and their susceptibility or resilience to fire (e.g., drought, insects, disease) through linkages with other data sources to generate mapped structure and fuels products. GEDI samples of vegetation structure enable assessments at landscape to regional scales and can inform national level mapping efforts, such as LANDFIRE (a U.S. government program that informs the National Fire Plan), that seek to consistently characterize fire-relevant vegetation and fuel characteristics over large areas. This typically entails deriving metrics of interest (e.g., canopy height or canopy cover) at a local scale from GEDI waveforms and then using modeling or extrapolation techniques to generate spatially continuous products from the point sample data available from GEDI. Combining detailed structure data available from discrete GEDI observations with spatially continuous spectral data (e.g., from Landsat), enables the production of mid-resolution vegetation structure and fuels data layers that support fire decision management. Algorithms for deriving certain metrics (e.g., canopy height and canopy cover) are largely mature, while other fire-relevant metrics (e.g., canopy base height or canopy bulk density) require further investigation, with comparisons to traditional field measurements, airborne lidar or terrestrial lidar.