Videos

Watch videos for information on marine debris and NOAA's work to address it.

Additional Multimedia Types

Scroll to select video:

NOAA Marine Debris Capabilities Webinar

Growing and Strengthening a Culture of Recycling to Reduce Marine Debris in Saipan's Waters

Growing & Strengthening a Culture of Recycling to Reduce Marine Debris in Saipan's Waters-Carolinian

Growing & Strengthening a Culture of Recycling to Reduce Marine Debris in Saipan-Chamorro

Large Scale Marine Debris Removal in Beaufort, NC.

First Place Winner: 2020 Ohio PSA Competition

Third Place Winner: 2020 Ohio PSA Competition

Second Place Winner: 2020 Ohio PSA Competition

TRASH TALK Special Feature

Northwestern Hawaiian Islands Marine Debris Project Webinar – July 2019

Trash Counts

OceansLIVE! Talking Trash: A Call to Action

First Place Winner: 2019 Ohio PSA Competition

Second Place Winner: 2019 Ohio PSA Competition

North Carolina Coastal Federation and Fishermen: Crab Pot Project

First Place Winner: 2018 "Communicating for a Clean Future" Ohio PSA Competition

Second Place Winner: 2018 "Communicating for a Clean Future" Ohio PSA Competition

Third Place Winner: 2018 "Communicating for a Clean Future" Ohio PSA Competition

NOAA Divers Free Green Sea Turtle from Net in Hawaii

NOAA Marine Debris Program Removal Webinar, April 2017

TRASH TALK: What is the Great Pacific Garbage Patch?

First Place Winner: 2017 "Communicating for a Clean Future" Ohio PSA Competition

Second Place Winner: 2017 "Communicating for a Clean Future" Ohio PSA Competition

Third Place Winner: 2017 "Communicating for a Clean Future" Ohio PSA Competition

First Place: 2016 “Communicating for a Clean Future” Marine Debris PSA Competition

Second Place: 2016 “Communicating for a Clean Future” Marine Debris PSA Competition

Third Place: 2016 “Communicating for a Clean Future” Marine Debris PSA Competition

DOC Talks: What We Can Do About Marine Debris

Tsunami Debris in California

Gyre: Creating Art From a Plastic Ocean

Our Debris Filling the Sea

What is Marine Debris?

Marine Debris

TRASH TALK: Impacts of Marine Debris

TRASH TALK Webinar for Educators

TRASH TALK: What Can We Do About Marine Debris?

TRASH TALK: Marine Debris and Plastics

TRASH TALK: Where Does Marine Debris Come From?

TRASH TALK: What is Marine Debris?

Avoid the Trap: What Anglers Should Know about Commercial Fishing Nets

NOAA Marine Debris Capabilities Webinar

On March 11, 2020 the NOAA Marine Debris Program hosted a webinar on marine debris research capabilities within NOAA. Six speakers from offices and programs across the NOAA family presented on their office’s interests and capabilities with respect to marine debris research, monitoring, and detection. Presenters represented the following offices: 

  • National Ocean Service, Office of Response & Restoration, Marine Debris Program 
  • National Ocean Service, National Centers for Coastal Ocean Science 
  • National Environmental Satellite, Data, and Information Service, National Centers for Environmental Information 
  • Office of Oceanic & Atmospheric Research, Atlantic Oceanographic and Meteorological Laboratory 
  • Office of Oceanic & Atmospheric Research, Climate Program Office, Global Ocean Monitoring and Observing Program 
  • Office of Oceanic & Atmospheric Research, Pacific Marine Environmental Lab 

About the Speakers

Amy V. Uhrin serves as the Chief Scientist for NOAA’s Marine Debris Program (MDP). In this role, she is responsible for developing and implementing the MDP’s Strategic Research Plan, overseeing MDP’s diverse research portfolio, and leading internal research projects, as well as overseeing external research projects funded by MDP.

Wayne McFee is the Program Lead for the Coastal Marine Mammal Assessments Program in the Key Species and Bioinformatics Branch at National Centers for Coastal Ocean Science in Charleston, SC. He specializes in marine mammal strandings, fisheries interactions, and contaminants. He has been with NOAA since 1993 and has regularly monitored marine mammal interactions with marine debris and currently co-chairs the Wildlife and Habitat Impacts from Marine Debris working group to the 2019 Southeast Marine Debris Action Plan.

Ebenezer Nyadjro is an Associate Research Professor with Mississippi State University/Northern Gulf Institute (a NOAA Cooperative Institute). His background is in physical and satellite oceanography, and he is currently leading efforts to build a global marine microplastic database for NOAA’s National Centers for Environmental Information. His interests also include developing sensors for remote measurements of marine debris and tracking the movement of marine debris.

Joaquin Trinanes is the Operations Manager for the CoastWatch Caribbean and Gulf of Mexico and the Atlantic OceanWatch nodes located at NOAA’s Atlantic Oceanographic and Meteorological Laboratory, in Miami. His research interests are focused on remote sensing, oceanography, and scalable data management and analysis.

Kelley Suhre is the Acting Deputy Director for NOAA's Global Ocean Monitoring and Observing Program. She specializes in field operations, cruise planning and execution, and telepresence/remote science. She has been with NOAA since 2004 and has more than a decade of experience planning and managing at-sea projects and expeditions to investigate the deep-ocean around the globe. 

Chris Meinig is the Director of the Engineering Development Division at NOAA’s Pacific Marine Environmental Lab. He leads a diversified team of engineers and technicians specializing in the research, development, and deployment of ocean and atmospheric instruments and observing platforms. His work is global in scope and includes moorings, ships, remotely operated vehicles, underwater gliders, and unmanned surface and aerial vehicles, and he has logged over 550 days at sea.

Transcript

Amy V. Uhrin (00:00:00):

As a result of numerous NOAA subagency office and programs reaching out to us to understand more about what we do and to perhaps leverage their various field and lab capabilities, we decided to host this informal and informative webinar as an opportunity to highlight those capabilities and connect various offices and programs within NOAA.

Amy V. Uhrin (00:00:22):

So prior to the webinar, we circulated a Google Form to our existing NOAA partners and other interested offices to capture these capabilities, and that information will be shared forthcoming. It is a living document that we wish to update regularly as capabilities arise or change, so look for emails from our program in the distant future asking you to complete the form so we can update those capabilities. In addition, this webinar will be recorded and circulated to attendees and to the larger email invite list.

Amy V. Uhrin (00:00:55):

So we're pleased to have seven speakers from across the NOAA family, including myself. I do have to acknowledge that some offices and programs are not represented in this webinar due to capacity issues. These include a number of the NIMP science centers who have supported individual marine debris projects over the years, Sea Grant involvement, and a handful of national marine sanctuaries and National Estruaine Research Reserve sites that participate in our shoreline monitoring project. So perhaps the next time around, after we update capabilities, perhaps we'll have another webinar and we can highlight these other efforts that aren't captured here. But they are captured in the Google Form responses that we will circulate forthcoming.

Amy V. Uhrin (00:01:39):

So for those who may have joined late, I'm Amy Uhrin. I'm the Chief Scientist for NOAA's Marine Debris Program. Again, we're under the Office of Response and Restoration within NOS. And so I'm going to go ahead and kick off with a short summary about our program.

Amy V. Uhrin (00:01:55):

So the mission of our program is to investigate and prevent the impacts of marine debris, and our program was established by the 2006 Marine Debris Act. The original act requires the program to identify, determine sources of, assess, prevent, reduce, and remove marine debris and address the adverse impacts of marine debris on the U.S. economy, the marine environment, and navigation safety.

Amy V. Uhrin (00:02:22):

In October 2018, the president signed the Save Our Seas Act, which amends and reauthorizes the Marine Debris Act for four years. This new act promotes international action to reduce marine debris, authorizes cleanup and response actions as a result of severe marine debris events, and updates the membership of the Interagency Marine Debris Coordinating Committee. Some of you have been on that committee. Additionally, the act authorizes and requires NOAA to work with other federal agencies to develop additional outreach and education strategies to address the marine debris issue.

Amy V. Uhrin (00:03:00):

So all of us on this call know what marine debris is, but here is the formal definition. And what I wanted to stress in this particular slide is that the Marine Debris Program addresses marine debris in all its forms, so not just plastic, which is a very popular form of marine debris. And we also address debris in all its sizes, so from abandoned and derelict vessels to derelict fishing gear on down to microplastics.

Amy V. Uhrin (00:03:24):

So this is a high-level list of the activities that our program engages in as a result of the language in the two acts. Many of these I've touched upon briefly already, but we see here the national and regional coordination leading the Interagency Coordination Committee. We maintain the Marine Debris Clearing House, which is a publicly accessible online database of all projects funded by the program. Specifically has been called out to work on derelict fishing gear, which we do. Talked about outreach and education, the timely response to severe marine debris events, like hurricanes and tsunamis. We do a lot of international engagements. And probably what we're most well-known for is that we do carry out three different grant competitions on a rotating basis. So a common misconception about the program is that we are a field and analytical laboratory, which we are not. We rely on our partners for those capabilities.

Amy V. Uhrin (00:04:30):

So to accomplish these goals and actions, we have a modest staff organized as follows. So underneath our director we have a deputy, which she currently serves as our comms team lead at the moment, and you can see she has a handful of staff under her addressing various aspects of communication. We have the science team, which is comprised of myself and my research coordinator. We have an emergency response coordinator who also serves as the East Coast team lead. And underneath him are several regional staff located in the areas that you can see listed there, and he also manages a couple of folks to assist with the emergency response stuff. Out on the West Coast in Seattle, we've got a West Coast team lead who also serves as the Pacific Northwest regional coordinator, and he's got a handful of staff under him for all of the Pacific regional coordinators.

Amy V. Uhrin (00:05:29):

So our regional coordinators is really a big component of our program. You can see they're stationed across the country, and they provide expertise on the ground and they coordinate with partners in those regions. And one of their big things is also to facilitate the creation of regional action plans. And then lastly we've got an international activities and partnership coordinator and the cooperative agreement specialist, who is the gentleman that handles all of our grants.

Amy V. Uhrin (00:05:58):

Since this webinar is focused on research, I'm just going to briefly highlight some of our recent research work. And so in odd fiscal years, we host the research grant competition. So we had a competition in fiscal years '17 and '19. The research priorities for those two calls were identical, and they included the following, which you see on the slide here, focused on risk assessment and exposure response studies, consideration of fate and transport of marine debris, particularly in nearshore and coastal environments, and also a habitat impact priority.

Amy V. Uhrin (00:06:36):

So in even years, we still do fund projects at our discretion. And in this year, we happen to be working with the National Academies of Science to conduct a study that will evaluate basically U.S. contributions to plastic waste in our own waterways, through mismanaged waste, and also an examination of U.S. import and export plastic waste. And then as I mentioned, FY 21 will be a research grant cycle year. Our program is also currently working on updating our strategic plan. That will be forthcoming probably at the end of this calendar year. So it's a five-year plan that we're in the throws of right now.

Amy V. Uhrin (00:07:18):

And then lastly, I wanted to highlight and mention our Marine Debris Monitoring & Assessment Project, which is a citizen science initiative that engages partner organizations and volunteers across the nation in completing shoreline marine debris surveys using protocols that were developed by our program. There's an online publicly accessible database where these partners can upload their data and then the public actually has access to it. You can see the link at the bottom for more information about the monitoring project. We currently have about 400 sites in our database.

Amy V. Uhrin (00:07:54):

So that's just a quick summary of our program, given that a lot of you are familiar with us and what we do. And so I'm going to stop sharing and kick it over to Wayne McFee, who is also in NOS. He's at the National Centers for Coastal Ocean Science. He's down in Charleston, South Carolina, at the Center for Coastal Environmental Health and Biomolecular Research.

Wayne McFee (00:08:19):

Well, thank you again for inviting me to this. I'm going to present to you some information about NCCOS and our marine debris capabilities. I'm with the Special Detection and Impact Division at NCCOS, specifically in the Key Species and Bioinformatics Branch, and I've been the lead for the Coastal Marine Mammal Assessments Program for a while now.

Wayne McFee (00:08:50):

Our mission statement at NCCOS is to deliver ecosystem science solutions for stewardship of the nation's ocean and coastal resources to sustain thriving coastal communities and economies. We specifically support [ORNR 00:09:05] programs, in particular the RESTORE Science Program and Competitive Research Program. We do have focus areas in Harmful Algal Bloom and Hypoxia Research and Control, or HABHRCA, Mussel Watch, Marine Spatial Ecology, Stressor Detection and Impacts, Coastal Change, and Social Science. So it's a pretty diverse group of people.

Wayne McFee (00:09:36):

Our interests in marine debris fall basically into microplastics and key species. In particular, enumeration in cetaceans, those are your whales and dolphins, bivalves, and corals using both place-based and regional studies and looking at the effects on the biota, in particular phthalates and persistent organic pollutants. We also are interested in microplastics in the sediments and water and classification and enumeration of those as well. We have done a fair amount of work with macroplastics and ALDFG or abandoned, lost, discarded fishing gear. In particular, within entanglement and ingestion with cetaceans, the fouling of aquaculture, derelict trap detection, and the detection following storms and disasters.

Wayne McFee (00:10:45):

Our activities related to marine debris are, again, enumerating and characterization of microplastics in water and sediment; the analytical chemistry of phthalates and persistent organic pollutants; ecotoxicology testing of acute and chronic effects of microplastic ingestion in estuarine organisms, and that includes both invertebrates and vertebrates; the enumeration characterization of microplastics in marine mammal GI tracts; the geographical differences in microplastic burden in marine mammals; again, monitoring marine debris entanglement and ingestion prevalence; and then the derelict trap detection, trap fouling rates, decomposition, and resource impacts; and then the surveillance of shellfish aquaculture debris.

Wayne McFee (00:11:47):

And just to give you an [crosstalk 00:11:48] example of a couple of these in the marine debris detection. The use of AUVs in U.S. Virgin Islands for derelict fish trap detection. It was a two-week pilot project, receives partial funding from the NOAA Marine Debris Program. Our aquaculture program has an AquaDebris side of that using drone technology for surveilling shellfish aquaculture debris and mainly from aquaculture sites that have been abandoned or taken down but still leave debris in the water. The use of drones has been helpful in detecting those places.

Wayne McFee (00:12:44):

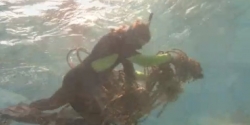
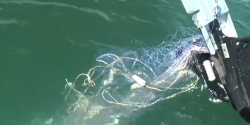
And then the monitoring marine debris entanglement and ingestion. Obviously, we get a lot of plastic bags in stomachs, so deep diving cetaceans, but also your coastal dolphins occasionally get entangled in marine debris, such as packing straps and other fishing lines and so forth that pass by.

Wayne McFee (00:13:08):

We have a fair number of publications. This is a few of them. In particular, we did attend at least one workshop with the Marine Debris Program in North Carolina and... have been instrumental in helping with the Southeast Marine Debris Action Plan, especially with the wildlife section of that. We did put together a few great papers for the Marine Debris Program a few years ago. In particular, ones with the Impacts on Coastal and Benthic Habitats, Marine Debris as a Potential Pathway for Invasive Species, Entanglement of Marine Species in Marine Debris, and The Occurrence and Health Effects of Anthropogenic Debris Ingested by Marine Organisms. And then we've had a couple of graduate students [crosstalk 00:14:12] that have worked on microplastics, such as this one in the gut of a bottlenose dolphin, and also looking at-

Speaker 3 (00:14:21):

Yeah, she is...

Wayne McFee (00:14:21):

... Effects of Polyethylene Microbeads on Hard Clams, so-

Speaker 3 (00:14:25):

The Great Lakes regional lead.

Wayne McFee (00:14:28):

Somebody-

Amy V. Uhrin (00:14:29):

If you guys could mute yourself, we can hear you, whoever is talking about the Great Lakes. [crosstalk 00:14:39] Okay, Wayne.

Wayne McFee (00:14:39):

Thank you. So we have a fair number of publications and workshops that we've attended in the past. Not much regulatory work has been done, as far as I could tell. The agriculture program has worked for the State of Florida Aquaculture Debris working with best management practices down there and have done some work that I believe is non-regulatory for North Carolina as well. Our international activities, as far as I could tell, were we did present at the Sixth International Marine Debris Conference and also did write a paper with a number of international researchers from France, Italy, Greece, Norway, Australia, and Mexico on marine litter and megafauna that was published in the Marine Pollution Bulletin last year. So that's the extent of the international activities that I could find.

Wayne McFee (00:15:53):

So our resources, we've got a lot of resources, as far as I can tell, especially in the realm of drones and AUVs, UASs, a lot of acoustic sonar capabilities, lidar. We do have, for microplastics, a number of sieves that go down to 75 micrometers. We've got stacked sieve shakers, filtration manifolds and pumps. We do have a necropsy lab for wildlife. We have stereo and epiflourescent microscopes. We have a mesocosm toxicity facility where we could potentially dose those systems with things like phthalates to see how the fish and shrimp respond to those introduced into the system. Plenty of imaging software, vessels, and archived samples, and we do have a high performance server farm.

Wayne McFee (00:16:59):

Our expertise is pretty wide-ranged as well, especially in the chemical realm. We have expertise in environmental sample collection for both wildlife and water; debris characterization as well, both with chemical analysis of phthalates and POPs and spectroscopy as well; Cloud based computing; geospatial predictive modeling. We do have capability for advanced AI and machine learning for automation; commercial and NTM satellite imagery; Of course the UxSs, acoustic sonar and lidar acquisition, processing and analysis; hazard, exposure, risk assessment; and imagery analysis. So quite a broad range that we use within NCCOS.

Wayne McFee (00:17:57):

Some opportunities or needs for interagency collaboration, one of the things that we found is that we really need to get the use or the purchase of a micro-Raman or an FTIR. FTIRs are pretty easy to find out there, but the micro-Ramans are less so. They're pretty expensive, but if you really want to determine what constitutes the plastics that you're seeing, the microplastics you're seeing, you need to be able to go below one millimeter or some of them down the 500 micrometers, but we'd like to go lower than that as well. So that's one thing.

Wayne McFee (00:18:46):

The expertise, there's some thought of getting some expertise from the EPA, particularly with contaminants potentially entering the food chain via microplastics. We probably need some more expertise in that area. As far as joint coordinated activities and research, there was suggestion of plastic pollution monitoring for Great Lakes Mussel Watch Program and also needed research for organ system effects of ingested plastics. There were some workshops or meetings. There's a need for literature review for state of knowledge of microplastics. I'm not sure whether that's been done or not. I think it's been done somewhat, at least on an international scale, regarding macroplastics. I'm not sure microplastics.

Wayne McFee (00:19:50):

There's a need to have a national mapping effort for marine debris hotspots and to update the National Geodetic Survey emergency response imagery and aerial damage assessments to include the marine aquaculture imagery that NCCOS can provide. International outreach, there's a need for broader coordination with wildlife issues, technological advancement, and the detection and monitoring. I think everyone would agree with sample processing and collection, there needs to be a way to standardize the processing and collection of debris, and in particular, microdebris. And then database development and maintenance and the coordination with other agencies on wildlife effects and data management.

Wayne McFee (00:20:52):

I was fortunate enough to work with some of you, marine debris groups, Demi and Jason, to help us get at least some movement with the marine mammal community and getting marine debris actually placed onto their data sheet so it would be easier to access when we do searches on that. And so hopefully we can continue to do that with other wildlife acts, like sea turtles and what have you. But data management is always a place where we need to coordinate our efforts on, I think, with any of this.

Wayne McFee (00:21:35):

I think that's about all I have. I hope I haven't taken up too much time.

Amy V. Uhrin (00:21:40):

Next up is Ebenezer Nyadjro.

Ebenezer Nyadjro (00:21:44):

Yes.

Amy V. Uhrin (00:21:44):

And Ebenezer is from the National Centers for Environmental Information.

Ebenezer Nyadjro (00:21:50):

All right. Thank you. So good afternoon and, yeah, thanks for inviting us. So here at NCEI, we trying to create a microplastic database and this work we've been doing with collaborators listed down below out of NOAA-NCEI. And this is a wider innovative project from NCEI and those innovative projects are to allow EPO and NCEI to be able to come up with innovating ways of doing science or activities that are of interest to NCEI, NOAA, as in general.

Ebenezer Nyadjro (00:22:28):

So our interest in this... NCEI, as we know, is the nation's primary archive for environmental information; and its mandate is to preserve, monitor, assess, and provide public access to the nation's geophysical data. And the reason for doing this is to ensure that you have very good, well quality control data that will be publicly freely available to allow scientists, policymakers, and whoever is interested to be able to assess data, to do environmental research, and be able to advise the public. And because we've doing this over and over the years, we've built a lot of capacity in this field and it's the nation's leading authority. NCEI has over 25 petabytes of comprehensive data on all aspects of the environment. That's from the ocean, land, even to space. So there a lot of data on these and there a lot of parameters that we measure and we archive for the government or the public.

Ebenezer Nyadjro (00:23:27):

So on this slide, we show just some of the capabilities that we have in terms of data stewardship, and we do everything from long-term preservational just basic data. We also archive raw data. We have data that we've quality controlled and then we derive product from them, which make it easier for whoever want to use that, depending on... There are some people that may be interested in the raw data or then some that may be interested in products that address temperature or ocean heat contents. So oceanic contents, in that sense, would be a derived product.

Ebenezer Nyadjro (00:24:05):

So we've seen our capability and our ability to do all these things over the years, and given the increasing interest in marine debris status and more specifically microplastic, we thought this was also an avenue for us to bring that data to the public and to the community to create a one-stop shop for all information that is on microplastic. We didn't want to go too much into the broad field of marine debris because we believe that is already done. But if you look around, there's not one single place that you're going to find extensive data on microplastics. And this makes decision-making sometimes very difficult because we don't know how much is there, where they coming from, where they going to end up, and then you're not able also to model them to be able to forecast future occurrences and the consequence of these occurrences. So that's where NCEI's interest has been, just leveraging our work and abilities in creating all of these databases and then adding marine microplastics to it.

Ebenezer Nyadjro (00:25:05):

We already have some complimentary data that we've already archived, like the Global Ocean Current Database and the World Ocean Database. And these contain information on ocean currents, the speeds, the sources, and all that. We have products that are monthly basis and climatology basis. We've been doing this for regional as well as entire globe. So, for example, we have ocean current or data or temperature or salinity for, say, the Gulf of Mexico or the Northwestern United States. So we believe if we able to archive this microplastic information and add it to what we already have, we are going to have extensive database that serves the needs of various communities.

Ebenezer Nyadjro (00:25:47):

For example, there may be people who are just interested in seeing the sources of plastics and they will have access to that. Then, as I mentioned earlier, like [inaudible 00:25:54] are interested in knowing the effective characteristics of plastics, be able to know where the sources are and those things. So if we have all this data and database mapped onto a common platform or a common unit, say, we put them in a uniform grid, anybody who goes to grab the microplastic information can easily grab the current data as well and be able to put that together and be able to tell a more meaningful story than getting the current from somewhere else and going to get the microplastic data from another place. So these are the force that draw interest in and what we are most interested in with regard to marine microplastics.

Ebenezer Nyadjro (00:26:34):

So as I mentioned in my introductory slide, this an innovate project and so it means it's something we starting from the scratch. We currently do not have this done already. But as we've been building databases, we have the experience and the know-how in these areas, so we have the expertise to do this. So basically we've been contacting people from everywhere, both local and foreign. We go through the literature on microplastics. We see where that have been done, does that contain data sets that we think are extensive enough or we could do something meaningful with. We contact them and then we try and get the data to be able to put into this database. So this project started just this January, so we are now in our third month. So it's very, very at the initial stages.

Ebenezer Nyadjro (00:27:19):

So I'm in contact with our colleagues or other scientists who are doing this research. When they provide their data, we go to their data and we try to standardize them because, as we know and as we mentioned in this presentation, there's no standardized way of doing these measurements or reporting the results. So one thing we try to do is to figure out what the best way to be to report the result that will make most sense to most people that will get it. So once we get this, we put everything together. We do some quality controls. The next stage in what we're doing is to start building the database. So all this we put into a database. We now control all the raw files that we've received and we also thinking of developing products from them also where we try to create products for regions that of interest. Let's say the Pacific marine patch where you have a lot of microplastics aggregating. We could create specific product for those regions as well as global.

Ebenezer Nyadjro (00:28:21):

And what our interests also intend to be doing in this is, as we already in the data provision business, we also in the business of engaging the public and the community in information services relating to environment. So as we do our outreach and stuff like that, we also educate our community on microplastics. So once we build this database and it becomes part of it, we able to drum home the effects that microplastics are having on our environment and more especially our aquatic ecosystem.

Ebenezer Nyadjro (00:28:51):

Another interest that we have, aside from building all this data product, is to see whether we could go into the field of developing microplastic sensor measurement. And why this is the case, we realize that often when we produce the data search and we don't use it as NCEI and just as a public user, we wait until we get feedback from them. And it's not always that you get those feedback. So as part of creating a database, we also try to use that data ourself to answer some scientific questions. And that way, once we use it, we get a firsthand feel of what the end user will be feeling. So we able to address some of the issues that may arise or are likely to arise even before the end users get back to us.

Ebenezer Nyadjro (00:29:31):

And the reason why we want to go into this field is because it's very difficult to have extensive database on plastics because mostly you have to go out to sea to collect this data. And as we know, this very expensive thing to do. So the sensors that we trying to develop or first use some of the database we already have. For example, algae and all that, go to some areas and see whether we can remotely measure this. So this is one area that we studied recently and we talking to some interested groups with the possibility of getting some funds.

Ebenezer Nyadjro (00:30:04):

NCEI also have a very strong strength in ArcGIS where the data that we collect, we create data from maps and aqua maps, which allows people to go out, be able to move their mouse around these maps, they get information from the regions they interested in. They can click and then just get that plot. For example, map plots or histograms or stuff like that, which help them to better understand it.

Ebenezer Nyadjro (00:30:28):

So we believe if we are going to aggregate microplastic datas and create ArcGIS files like we've done with other data sites, it shouldn't be just the scientists or those who are trained in that field who will be able to use it, just quote, unquote, the citizens or citizen scientists generally. So people are just interested in seeing, for example, what the microplastic issue in that area looks like, they can just move a mouse on a map and they'll be able to get that information. So these are some of the things that we have been doing.

Ebenezer Nyadjro (00:30:57):

Our strengths and our expertise in this field is limitless. We've been doing this for years and we've built a lot of expertise in this. We have the database tools. We have the ArcGIS tools. We also have the IT infrastructure, very large servers and then storage. We are now into cloud computing, artificial intelligence, and new technologies that help us to optimize data in this creation and making data accessible to the community. We have the expertise in correlating data. We have wide network of both local and international partners where we able to get in touch with them and ask... they also colleagues interested in public science or making data available to the community. They give that data to us, just as we also give their data to us.

Ebenezer Nyadjro (00:31:46):

So we already have some connection in the other folks that we've been using. And in creating the microplastic database, we reaching out to some of them. So the network is already there and we just adding this to it and then trying to expand it to be able to get data to create a microplastic database.

Ebenezer Nyadjro (00:32:03):

Our archiving services are one of the top-notch across the world because we able to support very different data types. So we don't limit ourselves to, say, just NetCDF or binary files, no. We have a very wide range. And as I said, we have the expertise to be able to use these data. And the good thing with that is we able to reach out to a whole lot of people, different people using different instrument, doing measurements in different units, and we able to take all these, standardize them, put them into a form that is easy to access and easy to use to the community. And we've also built expertise in technologies that help to easily retrieve and access data. So data query techniques that optimizes the ability to look for particular data that you're looking for in a long chunk of data files. As I mentioned, we have about 25 petabytes of data. That's very huge. So if someone goes out there and is looking for information, they don't want to stay long. So they want to get what they want as quickly as possible, and we built all these tools that'll help people to do it.

Ebenezer Nyadjro (00:33:08):

So we intend to bring these same tools also to the microplastic project, which will allow people to set forward the particular products that they're looking for. So once we able to get the data and we able to separate them into their different forms that are common in the literature, someone can go and grab the entire data set or just what they are interested in.

Ebenezer Nyadjro (00:33:30):

Opportunities and needs for interagency collaboration is very important because this is a new field we going in. The microplastic issue, though, is a global issue. It's still quite young. There's not much information out there. There's a lot we need to do. So there's a need to actually build very, very strong collaborations with the community. And much as people go out and collect data, everybody will be waiting to give out their data, which was sometimes understandable because they spend a lot of time to write proposal, get grant, and all that. And they would like to publish as much as they can from it before they put it out there. So we understand that. But if we also able to build strong connections and network, it will help us to better get information that we need from them to be able to create this platform. And as I said, this is not existent. There's no big platform where you can go and access microplastic information, and that's why we trying to create this.

Ebenezer Nyadjro (00:34:28):

So we believe if we sell them this and the idea, and the fact that we've been archiving and making information available to the community over a long time, maybe they will buy into it and help us in that direction. Therefore, we have the need to build collaboration. So with all of us on this webinar, if you can share your contacts or connections and sell the message out to your contacts that you have, that if they have microplastic data, they could please send it our way to help us to build this database.

Ebenezer Nyadjro (00:34:57):

And so we interested in building that collaboration. We interested in sharing that data that we'll be getting with the community. And we have the expertise to be able to deglove these and put it out there and create it. Probably there may be some people out there who may be interested in doing this, but I believe that we have the strongest ability to create this, based on our track record.

Ebenezer Nyadjro (00:35:19):

And just a little bit of the science that we interested in doing. As I mentioned, developing microplastic sensor measurements. On this slide here, we also mentioned the Raman Spectrometer. That is an instrument that you need if you want to go into this field, and it's expensive, as we also mentioned. But what we are trying to do is to see if we can also develop other tools outside this radian. So, for example, we thinking of going to take origin from Gulf of Mexico where we go out, collect some water samples, bring it into the lab, carry out some experiment, and try to see whether we able to identify the spectral signatures that allow us to identify microplastics.

Ebenezer Nyadjro (00:36:02):

So spectral signatures are the unique characteristics of objects. So say you fly a drone over a farm. You should be able to tell maize from a sunflower because it will emit a unique radiation, which, if you look on the bottom right, that's a plot that's showing. So that's... the height at which the signature that that made is what you would use to identify the object. So we want to know similar information for microplastics, and we believe that would be the basis for that bigger measuring technologies, like Spaceborne satellite. For now, this what we want to do. We believe once we able to get that and build on that, together with all the information, such as ocean currents that we've already archived at NCEI, we'll be able to help ourself and other interested scientists in a numerical modeling and prediction of directive properties and tracking of microplastics in the ocean.

Ebenezer Nyadjro (00:36:57):

So this just a brief of what we've been doing and we looking forward to collaborating with other interested groups. Thank you.

Amy V. Uhrin (00:37:07):

Great. Thanks, Ebenezer. I appreciate that. So next up is Joaquin.

Joaquin Trinanes (00:37:14):

Perfect. Thank you very much.

Amy V. Uhrin (00:37:16):

Yes.

Joaquin Trinanes (00:37:16):

Well, thank you for giving me the opportunity to present our capabilities here at this webinar. I will describe the work we made at Atlantic Oceanographic and Meteorological Laboratory in Miami, ocean debris related efforts. Additionally, as operations manager of the CoastWatch Caribbean & Gulf of Mexico Regional Node and Atlantic OceanWatch node, both of them located at AOML. [inaudible 00:37:46] of lines, so initiatives related to ocean debris focus mostly on common methodologies involving the nodes. Next slide please.

Joaquin Trinanes (00:37:55):

So the Atlantic Oceanographic and Meteorological Laboratory is a major player for the collection and distribution of global oceanographic and meteorological data sets. AOML supports different ocean serving systems. The research conducted at AOML aligns, of course, with NOAA mission and with the office of Oceanic and Atmospheric Research where... the Global Ocean Observing System consist of a number of components. We have there drifting buoys, moored buoys, shipboard observations, gliders. So AOML contributes to many of these critical components and we manage, including performing the quality control and distribute the data that they provide.

Joaquin Trinanes (00:38:54):

At AOML, we house the U.S. Argo Data Assembly Center. That contributes to maintain the Atlantic component of the array. We also have the XBT and the Ship-of-Opportunity networks. Also, AOML is leading an international effort to create an array of underwater gliders that collect observations, including surface currents. So these observations from the gliders intend to improve hurricane intensification, but they also provide very useful current information.

Joaquin Trinanes (00:39:41):

And finally, we also host the Global Drifter Program that provides measurements of surface currents, temperature, and waves that we, for our purpose, we focus more on the surface currents. So AOML leads the international effort to maintain the global array housing the data assembly center, performing the quality control of the data, distributes the data, and produce. Like, for example, the surface current climatologists. You can see that AOML is organized in three research divisions, the Physical Oceanography, the Ocean Chemistry & Ecosystems, and the Hurricane Research division. Next slide, please.

Joaquin Trinanes (00:40:35):

But I will also talk about the CoastWatch and OceanWatch program, specifically the nodes at AOML. This program that is managed by NESDIS and consists of two main components. Central Operations, that is located in D.C., and also Regional Nodes that are located in other NOAA line offices. OAR participates in the CoastWatch and OceanWatch nodes located in Miami at AOML.

Joaquin Trinanes (00:41:04):

So one of the main objectives of this program is to provide data and to provide tools for scientists, but also to general public to better understand the physical, biological, and chemical compresses in the ocean. So as part of this effort, we make available near real time and historical satellite data sets. Many of them, they have a global coverage, but we also provide data from models, in situ field observations, and we use interoperable tools. Like, for example, treads, [inaudible 00:41:45], and also we provide a visualization environment that we name OceanViewer. Next slide, please.

Joaquin Trinanes (00:41:55):

So there are many reasons why we're interested in marine debris. The adverse effects of marine debris in the marine environment are many and obvious for you. So we are very interested to determine the source base on previous history of currents and winds, and we also want to predict the trajectory, the future trajectory. So there are many applications for this type of information. So it's very important to know how currents, winds, and the shape and weight of the object, its buoyancy, for example, and other characteristics. Thinking about, for example, the connection with other particles. So it's interesting to know how they affect the trajectories.

Joaquin Trinanes (00:42:47):

So these results could be applied for other purposes. For example, we're very interested in modeling sargassum trajectories. This is very important for preventing and for studying what we call sargassum inundation events. Probably you know that since 2011, lush amounts of sargassum are costing and costing fortune to economic, environment, and health impacts in the Caribbean and Gulf of Mexico regions. So we consider that it's very important to have the capability of predicting these inundation events, but also to be able to backtrack the sargassum accumulations. Next slide, please.

Joaquin Trinanes (00:43:35):

So, as I mentioned before, AOML hosts the Drifter Operations Center and the Drifter Assembly Center of the Global Drifter Program. So drifters provide direct information on surface currents. For drogue drifters, this information centers at 15 meter, but many of the drifters are really lost, they drogue, so that means that they were similar, the characteristics and behavior of real debris because they provide the surface currents. But real debris differs in buoyancy, weight, shape, size. So AOML is conducting experiments in Atlantic with synthetic drifters. We call them synthetic drifters with different shapes and buoyancies.

Joaquin Trinanes (00:44:27):

We also include a type that simulates a bit of sargassum. So they have a GPS providing the location information several times per day, usually every six hours, but it can read every hour. We can configure that. What we want to know is how ocean dynamics and winds affect the trajectories and within that experiment provide a better understanding of the trajectory in the ocean of floating debris.

Joaquin Trinanes (00:45:04):

On the other hand, CoastWatch has been providing current information. Most are 15 years. They are basically estimated. You seen a bit data... this is one of the data sets that we originally distribute at the node. And it's a very popular approach because it's been used for all operations, sailing, fishing. Additionally, we developed the prototype of online debris simulation tour that implements a methodology that is described in one of the papers that I will mention in the next slide. So basically, you can select the area. It can be a point or rectangular or circular, polygon, and the user can also select the number of particles. How often they are releasing this is not a single event. What is the windage of their range of windages to be apply. Also, if the simulation is forward in time or backward.

Joaquin Trinanes (00:46:11):

So this is still a prototype, but we are really test the interface with GPUs, with graphical processing units, having thousands, of course. With this approach, we can simulate on the fly hundreds and thousands of particles. So with sargassum, we are implementing procedures to detect it from satellite data. So we use a number of sensors in generating information about the location of sargassum, this is the first step for implementing a forecast approach.

Joaquin Trinanes (00:46:50):

So all this work is made in collaboration with University of Miami, University of South Florida. Also, the CARICOOS, the Caribbean Coastal Ocean Observing System is involved, IOCARIBE, and also the Sargasso Network, SARGNET. Next slide, please.

Joaquin Trinanes (00:47:07):

Well, here we show some key publications. The publication I mentioned in the previous slide is number five and proposing a new methodology for debris tracking. This paper was awarded three years ago the Denny Medal to the Best Paper of the Year in the Journal of Operational Oceanography. But we currently have some other papers under review. You see data from the experiments I mentioned. The first paper in the list has been just published few weeks ago in Physics of Fluids and shows the simulation of real trajectories using Maxey-Riley Theory. It's just a set of differential equations that take into account the size and the buoyancy of the particles. The second paper, you can see there is OceanObs19, a community-wide paper, the second in the list, about design implementation of an integrated marine debris observing system. Next slide, please.

Joaquin Trinanes (00:48:17):

So all the data from the Global Drifter Program is available from our databases. Data also from the other programs, like the Argo gliders, are also available. Additional, we also distribute satellite products for CoastWatch and OceanWatch. Many of these products are available on globally scale, but they are also the specific products original, basin scales. Also, we are familiar with a operational processing of massive data sets, the development of new algorithms, and we work on improving the modeling of trajectories. And we're currently applying machine learning techniques for many different purposes from estimating global carbon fluxes to generating new satellite products. You can see that the fjord at the top right shows the trajectories of the synthetic drifters I mentioned before. As you can see, they were released over the Tropical and Subtropical Atlantic.

Joaquin Trinanes (00:49:21):

I forgot to mention that some of them correspond to real sargassum. So you can see some trajectories in orange. Near Panama, they correspond to a certain rescue operation to locate the remains of a plane that disappeared more than 50 years ago. So we're relaying information about where the life vest were recovered in order to infer the location of the crash. The fjord at the bottom right is a good look of the trajectory simulation interface showing, in this case, the density of particles. They can be animated and you can, for example, overlay the trajectories and location of the particles. Next slide, please.

Joaquin Trinanes (00:50:17):

Well, finally, some areas where we could benefit from interagency collaboration. On one hand, we need field data for validating our algorithms and products. For example, we are currently designing a database with in-situ sargassum observations. We are integrating data from several database besides the in-house data that we have at AOML. So we need to make these data set very much larger, having access to additional data, especially historical data. Also, we are now starting processing very high resolution satellite products. I'm talking about products at 10, 20 meter resolution [inaudible 00:51:02]. The objective is to better track sargassum in coastal areas.

Joaquin Trinanes (00:51:09):

Additionally, we are also a participating in several efforts to migrate our system to the Cloud. With sargassum, we need better information about the effects that temperature, salinity, nutrients, viability have in the different species of sargassum, how they interact and affect the coastal ecosystem. New ways to apply machine learning, artificial intelligent technologies in this context.

Joaquin Trinanes (00:51:46):

Other aspects to take into account are the integration of different data sets that usually are managed individually in a way that we can improve the sargassum inundation reports by adding them, for example, the high resolution products. As part of the outreach activities and in collaboration with universities and associations, we participate in a series of satellite courses where we provide scientists and students with the tools and the techniques to incorporate satellite data, mostly satellite data in today's research and projects. And these courses include lectures and also practical labs. So we intend to organize more of these activities in the near future, and we plan to incorporate material related to ocean debris.

Joaquin Trinanes (00:52:41):

And that's all. Thank you.

Amy V. Uhrin (00:52:45):

Great. Thank you, Joaquin. Thank you very much. We'll go right to Kelly who is with OAR Climate Program Office, the Ocean Observing and Monitoring Division.

Kelly Suhre (00:52:56):

Right. Thank you very much, Amy. So I am the Acting Deputy Director of the Global Ocean Monitoring and Observing Program. What you just heard from Amy is that the reality is technically we are still the Ocean Observing and Monitoring Division within the climate program office. But hopefully by the end of this month, our approval as part of the OAR reorganization to be our own office will be complete and have gone through; and by next month, we can officially be called the Global Ocean Monitoring and Observing Program or GOMO.

Kelly Suhre (00:53:26):

And GOMO is the U.S. federal source and international leader for sustained institute global ocean observation and information in support of research, monitoring, and prediction. And our mission is to support and provide high-quality global ocean observing research to improve our scientific understanding and inform society about the ocean's role in environmental change.

Kelly Suhre (00:53:52):

And GOMO has several interests in marine debris and related observations. The observing systems we support are already providing critical data and products for informing and understanding marine debris studies, and you'll hear more about those systems here shortly. GOMO is also an active member of the national and international observing community and continues to hear strong interest by the community in marine debris related observations. So while there's still major questions that need to be both identified and addressed in this sphere, our program is interested in incorporating marine debris collection and monitoring into the Global Ocean Observing System.

Kelly Suhre (00:54:31):

So what is the Global Ocean Observing System? This is a coordinated network of high-quality sustained global observations and information that are routinely provided for climate, for weather, and for environmental services. Activities and networks that comprise GOOS include moored arrays, drifters, floats, and repeat shipboard and autonomous surveys. You'll hear more about these during my presentation. And through GOMO and our partnerships, the U.S. actually supports about 50% of the Global Ocean Observing System.

Kelly Suhre (00:55:02):

So we have extensive international collaborations and partnerships around the globe supporting these activities. I'm not going to detail all of these partnerships today, but know that our reach is extensive and we're happy to discuss these and to help make connections, as appropriate. And related, GOMO is taking a leading role in engaging on the UN Decade on Ocean Science. We were one of the hosts of the 2019 Ocean Observations Conference, which is helping to inform U.S. input into the Decade. And we have a good representative working with UN to proactively engage and identify how GOMO activities can and should best support the UN Decade. Our program managers and partners also participate in regional meetings related to the UN Decade and have noted that marine debris and microplastics has repeatedly come up as a hot topic in many of these recent regional meetings.

Kelly Suhre (00:55:53):

NOAA's Arctic Research Program is also part of our office, and we support the Arctic Monitoring and Assessment Programme or AMAP. This is one of six working groups that work under the direction of and report to the Arctic Council. And their mission is to monitor and assess pollution and climate change issues in the Arctic, and they produce assessments to inform policy and decision-making. And notably, AMAP is developing a monitoring plan for microplastics and litter in Arctic waters. And NOAA's liaison and representative to AMAP is Ben DeAngelo. He's the head of the delegation for the U.S. and regularly sends out AMAP agendas in advance of meetings. He asks for input on issues to raise and is the most appropriate contact to discuss interest. So we could certainly raise those for you or put you in touch with him if that is of interest. And in terms of publications, the one key thing that has really come out of our program is that one of our major annual products is the Arctic Report Card, and our 2019 report card included an essay on microplastics in Arctic marine realms with an emphasis on sea ice.

Kelly Suhre (00:56:59):

So moving on to our capabilities, where I'll spend most of my time today, is one of the networks supported by GOMO are the OceanSITES Reference Stations. So this is a global system of long-term, open ocean, fixed moorings that monitor air-sea interactions and acquire subsurface data down to the seafloor as deep as 5,000 meters. So the surface data collection includes wind speed, direction, temperature, barometric pressure, solar radiation, carbon dioxide, humidity, and precipitation. And I have solar radiation highlighted here because I understand that this is important in helping to inform what the ocean surface is experiencing, which can help inform plastic breakdown and fragmentation.

Kelly Suhre (00:57:43):

Subsurface data includes current speed and direction as well as PCO2, CTD data, and a current meter. And surface mixing through wind speed and wind direction combined with current speed and velocity can really help inform processes related to mixing that are relevant for marine debris studies. The acquisition of data down to 5,000 meters may also provide opportunities for data collection on deep sea marine environments of interest to the Marine Debris Program or marine debris studies. And we did want to highlight that one of these sites, one of these moorings, the WHOTS site, W hot site, is complimented by HOTS monthly hydrocast, which measures CTD, nutrients, current speed, and direction. Those have been conducted since the 1990s, and our program manager thought that there may be an opportunity to partner with University of Hawaii for potential repeat plastic surveys as part of this collaboration. So that's offshore of Hawaii, and if that's of interest, please reach out and let us know.

Kelly Suhre (00:58:44):

And we also conduct annual service cruises to several of these reference stations that may be able to host surveys of opportunity for marine debris related projects or sampling. And just to give you a sense, this map shows the breadth of the locations of the OceanSITES reference stations. NOAA does not support all of these, but the map does show where the physical infrastructure and surveying reside.

Kelly Suhre (00:59:09):

So through GOMO, NOAA supports 50% of all Argo floats globally with an emphasis on floats in remote and challenging environments. Argo and other platforms provide background ocean information that can strain all large-scale ocean models and analysis. These floats are deployed in the open ocean and they conduct repeat 10-day cycles. They acquire surface data, dive down to 1,000 meters for 10 days, then dive down to 2,000 meters, or in the case of Deep Argo, 6,000 meters, and back up to the surface before transmitting data back to the satellite and repeating.

Kelly Suhre (00:59:46):

The data depends on the type of float, and you can see the three different types listed here, the Core, the BGC, and the Deep, but all include salinity, temperature, and current data. And the BGC, or Biogeochemical float acquire additional data types. But relevant to the Marine Debris Program, this capability consistently provides current information at 1,000 meter steps. It provides some insight into bottom circulation and futures and the products that we produce can include trajectory maps for each float if that data is of interest. And this map is, again, just to briefly show the breadth and geographic spread of the Argo floats, and the dark green dots are the ones that are run by the U.S.

Kelly Suhre (01:00:34):

All right. Next is the Global Drifter Program. You've just heard quite a bit about this through Joaquin. We do work with and support AOML's efforts here. This program is part of the broader Global Ocean Observing System, and the Global Drifter Program is comprised of 1500 Lagrangian floats. They're deployed in the open ocean and drift at the surface with the current. The data from these drifters provide real time and historical surface current and circulation information and wave data that help inform marine debris studies. And traditionally, this program has been focused on collecting data to inform climate, but we are now moving towards informing human impacts in extreme events and are interested in discussing collaboration opportunities. And in preparation for this meeting and presentation, a couple that we identified include that if it's a NOAA priority, we could deploy global drifters in debris fields to tie them to large scale events and track the transfer path of large scale debris.

Kelly Suhre (01:01:33):

These drifters are traditionally deployed in the open ocean, but could also be deployed coastally to track the flow of debris from coastal environments to the open ocean and other remote locations. And also noting that we recognize that scientific equipment that's not recovered can contribute to the marine debris problem, and we're actively pursuing eco-friendly options and solutions. So, for example, right now we're working with SCRIPPS to explore development of a new biodegradable resin hull for the hull of these drifters. And this is just a quick view of the geographic spread of the drifters, and the NOAA drifters are dark blue.

Kelly Suhre (01:02:13):

So GOMO also supports the U.S. GO-SHIP program, which is a globally coordinated network of repeat, ship-based hydrographic measurements. And the advantage of this program is that they conduct full water column data collection, sampling, and analysis. I'll show you the global survey lines here shortly. And GOMO and NSF jointly are responsible for the U.S. lines. And these surveys are conducted once a decade and conduct hydrographic surveys and measurements of the full water column. The data provide inventories of heat, freshwater, carbon, oxygen, nutrients, and transient tracers.

Kelly Suhre (01:02:49):

And the data sets are categorized as level 1, 2, and 3. So level 1 data are required and all cruises have to collect those data sets. Level 2 is highly desired. Level 3 is ancillary. And there may be a potential, for example, for marine debris measurements to be added as a level 2 or 3. NOAA supports about a cruise annually in the Atlantic and Pacific as part of GO-SHIP and the Marine Debris Program could consider paying for additional days at sea on these cruises to support additional cast or sample collections if that's interested. And this is just a quick map to show the location of the Decadal survey lines, and these are color-coded by country.

Kelly Suhre (01:03:30):

The Arctic Research Program, which is part of GOMO, supports EcoFOCI and the Distributed Biological Observatory. The EcoFOCI project acquires and maintains what's primarily long-running data sets in the Arctic Region, and DBO sampling focuses on transects centered on locations of high productivity, biodiversity, and rates of biological change. So I'm keeping this short for the sake of time, but we just wanted to note that these activities regularly include shipboard surveys with water column and sediment sampling, as well as service cruises out to mooring arrays. These survey activities do not currently include plastics, so you could consider inquiring whether marine debris interest could be included on future cruises.

Kelly Suhre (01:04:16):

Also, in conjunction with PMEL, field drone operations are conducting in the Bering and Chukchi Seas to inform how changes in the Arctic can affect other climate and weather systems and marine ecosystems. And there could perhaps be an opportunity to partner with them on technology development or testing opportunities related to marine debris if you're interested in seeing how these capabilities might be incorporated into Saildrone. And, finally, GOMO is home to the Arctic Research Program, and you can reach out to our team for expertise generally in the Arctic Region. And we also have a grant opportunity and related expertise.

Kelly Suhre (01:04:56):

So the CalCOFI project is supported by GOMO and conducts quarterly cruises off of Southern and Central California. You can actually see the survey lines here on the upper right. And they collect a suite of hydrographic and biological data on station and underway down to about 500 meters. Marine plastics are not currently part of this study, but perhaps they could be if that was of interest, and there may also be the potential to conduct surveys of opportunities during these cruises. GOMO also supports two spray glider operations. One is operated off the coast of California and runs three of these CalCOFI lines that you're seeing here on the upper right. Another one is operated in the Solomon Sea, and there may be an opportunity to work with the PIs running these operations if there was an interest in testing new sonars or capabilities related to marine debris on gliders.

Kelly Suhre (01:05:45):

So bringing it all together, this slide really just summarizes what I already stated as part of these other programs because there are quite a few different programs and operations that we support. The first is that we're NOAA's home for sustained global ocean observing, so we have that global reach with observing infrastructure and cruises around the globe. We do conduct some work or support some work on autonomous platforms. Those might be good opportunities for technology or sensor testing. We have expertise focused on sustained observing, the Arctic Region, and global partnerships, and are certainly keen to learn more on how we might collaborate and include marine debris as part of GOOS.

Kelly Suhre (01:06:26):

So with that, I look forward to your questions.

Amy V. Uhrin (01:06:31):

Great. Thank you so much, Kelly. All right. So next up is Chris Meinig from another OAR individual. He's with the Engineering and Development Division of PMEL, which is the Pacific Marine Environmental Lab.

Chris Meinig (01:06:45):

So thanks for the invite, and it's really wonderful to hear everybody that's talking about marine debris. I'll say right from the beginning that the Pacific Marine Environmental Lab, where I work and lead the engineering effort, does not do any work in marine debris, but we do do an awful lot of ocean observations to analyze and predict the oceans and the atmosphere.

Chris Meinig (01:07:06):

I'm specifically going to talk about our engineering effort. Our lab, in total, is about 175 people and 40 PIs. And with the engineering group where our mission is to solve these technical difficult observing problems to accelerate NOAA science, we have a group of 16, and we're involved in over 90% of the lab's observations. Our present stakeholders and customers are researchers, program managers, NOAA operations, NASA, industry, and foreign government partners to develop that technology. Our functions include engineering. We do everything from electronics to software to deployments. We have an electronics lab, a machine shop, a mooring shop. We support an awful lot of field work and have decades of experience in deploying equipment and moorings.

Chris Meinig (01:07:55):

On this next slide here, you're looking at a bunch of dots and lines. The lines are from autonomous vehicles and all the dots are from floats, buoys, and other systems that we deployed over the last 18 months. I show this just to make the point that, number one, none of this happens without collaboration. So we have a wide, diverse group that we collaborate with to make these observations. And it's unclear to me how this can help with marine debris, but when I look at spatially what we cover in any typical year, I can't help but think that some of these linkages could be made. Most of this data is used to write papers. Ultimately, it all gets archived at NCI in the end, so it's all certainly available and I'd be glad to talk about any of this data to see where it might be useful.

Chris Meinig (01:08:50):

We are a science driven technology development lab, so we have an engineering shop that starts off with science drivers. We don't develop things unless there's a clear science question to answer. So if you look on the left side of this graph, if we start from there, if we start from science drivers, we have platform and sensor integration. Woops, can you guys still hear me?

Amy V. Uhrin (01:09:14):

Yes.

Chris Meinig (01:09:14):

Okay. I thought I just heard a beep on my computer. I wanted to check before I started talking too long. Okay. So we start with platform design and sensor integration. The next thing we start doing is planning field tests and casting an eye forward towards operations, what that would look like. We start automating our workflow and data validation, that's as we integrate new sensors into new platforms to make sure we're observing things correctly and to gold standard measurements. Ultimately, that pans out into integrated research missions where we do atmospheric biogeochemical, physical, many missions typically on a single platform at one time. And at that time, we also look at what it might look like for transition. Now, that transition might go to industry, it might go to within PMEL, to other programs, or it could go across line offices. We've really seen many types of transitions, and no two are ever the same.

Chris Meinig (01:10:14):

So our relevance is really in this end-to-end development. If we go down the steps, the first thing we do is evaluate opportunity. We look at the science drivers, the mission requirements, and start raising funds. It needs to fit the OAR vision all the time. We'll form partnerships and drag in expertise as required. Everyone is really a niche player these days, so we need to form partnerships with pinnacles of expertise in order to accomplish this work. The next step is to develop engineering designs and prototypes. We do field testing both local and to full ocean depths. We're blessed to be here in Puget Sound so we can do an awful lot of field testing right in Puget Sound where we have 200 meter depths. Final step is at the launch stage where we fabricate and integrate and deploy. We establish scientific collaborations. So we write papers, we assess the impact of these things, and reach out to our program and project managers. And ultimately, everything gets distilled to a stack of publications every year, which the laboratory gets evaluated on.

Chris Meinig (01:11:14):

And some of those things that we've accomplished by that cover is our Saildrone deployments that Kelly mentioned, that over the last five years, we've integrated... well, now it's closer to 30 sensors within the Saildrone. For those that don't know about it, it's about 5 meters tall, about 7 meters long, and has a mass about 750 kilos and can carry about 100 kilos of payload. So that is a significant amount of weight and can generate 30 watts continuously. So for engineers, this is just a power plant that we can harness and develop various systems on. Some of those are highlighted out there on the right, and the color-coding is just how we incremented them over years in a phased plan.

Chris Meinig (01:12:00):

So why bother with Saildrone? What's so cool about this? If you look here on the left, you'll see years of observing and time observing on the left side. And on the right side, you have spacial scales on this. You can look at each platform. Everything has a niche of what it covers. And when we look where Unmanned Maritime Systems can cover on the surface, it's a really big box. So that just speaks to the time and space requirements that we can observe in a single integrated platform. So, to me, this was super exciting to get involved with five years ago, and I thought there was a lot that we could make sense with that.

Chris Meinig (01:12:35):

We've taken our Saildrones really from pole to pole and almost everywhere in between. Here's a mission in the Arctic that shows what we've done for their unique requirements where we've taken Saildrones to the highest unmanned vehicle latitudes of any vehicle. We got them stuck in the ice last year and we had some very unique flux measurements while the Saildrones were in the ice. We also develop lots of buoys with profilers that go up and down and harness wave energy power. We've developed an Oculus Glider, which is a coastal glider that can go much faster than traditional gliders and can house a much bigger payload in a modular session. And we've also developed ALAMO floats with biodegradable parachutes so that we're not throwing so much plastic into the water.

Chris Meinig (01:13:24):

Our goal with this is to fill these gaps in observing technology. Many times, by developing and bringing these new platforms to the market, we have enabled entirely new science discoveries to our stakeholders. We make this technology available through dissemination and transitions.

Chris Meinig (01:13:43):

The Oculus Glider that I mentioned is the one on the right. This has been transitioned to hydroid and it compliments their family of Seagliders on the left, which can go less than 1000 meters. The Deepgliders go to 6000 meters, and the new Oculus Coastal Glider is good to 200 meters. And the big breakthrough that PMEL brought to this is an entirely new buoyancy engine. So we have about a 3.4 liter engine now, and while traditional gliders move at about half a knot, we can go about one and a half knots for horizontally through the water.

Chris Meinig (01:14:16):

Over the past five years, we've collaborated with every line office. We've had one small marine debris program where we implemented... I think it was after the tsunami, a barge washed ashore on the Olympic Sanctuary and with [inaudible 01:14:28] we attached a simple beacon on there so we could track it as it sloshed back and forth on the ocean to make sure it wouldn't head back out again. But we collaborate with people all the time and we truly are only as good as our partners.

Chris Meinig (01:14:44):

So the partnerships that... I thought I'd bring this slide in here to show kind of the unique space where research just... you can exchange PMEL for any research laboratory and operations and what the role industry might bring. And we all have our defined roles and what we're really good at, right? So the research lab over there is on the right. Operations typically have the things on the left. Industry can bring those things like rapid scaling and large matching resources, and really talent and machine learning and software that we really just can't afford and will never get in the government. Together, if we bring all that together, we can develop these shared visions, get the rapid co-development going, built-in transitions, right? Because if you build things with all this in mind, it can scale very quickly and very effectively because you're not handing the baton back and forth many times.

Chris Meinig (01:15:33):

So this overlap, in my experience of the 15 transitions that I've been involved with, is a super powerful multiplier for innovation. But special attention does need to be paid to the cultures of each organization. If we don't pay attention to culture, it will all tank in the end. So very important lessons learned over the years.

Chris Meinig (01:15:54):

So part of that, what has led to this understanding of what we can leverage with industry, is the first circumnavigation around Antarctica where we had a PMEL carbon sensor on there. Saildrone put 20 or 30 other sensors on there, including lots of video. So I'm not sure if that's useful for marine debris, but we have lots and lots of video from the Southern Ocean that looks something like this. And while we've tagged a lot of the video and image, we have over a million images tagged now. Marine debris is not one of the things we tagged for. So we tagged for things like ships and ice and a few other thing, but that's certainly something that's in the archive. And if we're funding, we're available. We could go back and tag for marine debris.

Chris Meinig (01:16:47):

Okay. Here's an example of some of our external collaborations. We have extensive experience with industry. We, of course, collaborate a lot with research institutes and academia, along with other public agencies internationally and with tribes.

Chris Meinig (01:17:05):

So I think I'll end there, and thank you for your attention. And I reach out, how can we collaborate on marine debris with you guys? Thank you.

Amy V. Uhrin (01:17:24):

Great. Thanks, Chris. Very impressive. All right. Well, in that case, we'll end the webinar and we thank our presenters for participating. We really appreciate it, a lot of really good information. A lot, I think, for all of us to digest. And like I said, we've been recording and so we will eventually share that. And once we figure out how we're going to share the responses from the Google Form about everybody's capabilities, we'll make sure everybody knows about that.

Amy V. Uhrin (01:17:46):

So if there aren't any last minute questions, we'll go ahead and end the webinar. And thank you everybody for being here today. We really appreciate it.

Growing and Strengthening a Culture of Recycling to Reduce Marine Debris in Saipan's Waters

With support from a NOAA Marine Debris Community-based Removal Grant, the Mariana Islands Nature Alliance, expanded local waste management infrastructure by installing mixed-waste and recycling bins at seven locations on the island of Saipan. The project also produced a marine debris educational video, available in English, Chamorro, and Carolinian, the two indigenous languages of the Commonwealth of the Northern Mariana Islands.

Transcript

00:01 (Narrator) This is the ocean. This ocean provides

00:06 food shelter and protection. This ocean

00:10 provides for us we should take care of

00:12 it, like it takes care of us.

00:16 This ocean is for me this ocean is for

00:20 you this ocean is for your brother and

00:25 sister. This ocean is for your father and

00:28 mother. This ocean is for your children

00:33 and grandchildren this ocean is ours.

00:37 [Music]

00:44 [Music]

00:55 [Music]

01:02 But the ocean is in trouble. For years

01:05 our trash has been entering into our

01:07 waters. Trash that takes years to break

01:10 down. Trash that doesn't belong in the

01:13 water, we call this trash marine debris.

01:18 Marine debris is defined as solid, man

01:21 material in the ocean. The most common

01:24 type of marine debris is first plastic

01:26 then glass, paper, and fishing lines.

01:30 Fishing nets and gear left in the ocean

01:32 can cause a lot of damage harming and

01:35 destroying fragile habitats. Marine

01:38 debris can either be direct from a ship

01:41 or ocean platform, indirect from storm

01:44 drains etc., intentionally disposed or

01:47 unintentionally abandoned. The bottom

01:50 line is that marine debris comes from us.

01:53 Sometimes

01:54 the debris is so tiny you can barely see

01:57 it in the water. Oftentimes fish and

02:00 other marine animals mistake it for food

02:03 whether it's a plastic bag mistaken for

02:06 a jellyfish, or shiny object and glass

02:09 resembling a tiny sea creature, marine

02:12 debris can be very small, very big, or

02:16 anything in between. In the ocean marine

02:20 debris is on the surface in the water

02:22 column and on the ocean floor and this

02:25 harms our coral reefs because heavy

02:27 debris will crush and damaged coral.This

02:30 harms us because we depend on food from

02:33 the ocean. It affects the environment, the

02:36 economy, fishing, navigation, our health,

02:38 and our safety we need oceans full of

02:41 life not plastic.

02:58 [Music]

03:07 [Music] (Teacher) Hafa adai (hello) class. Let’s into the shoes of a marine animal who gets entangled by marine debris. So for this activity, you just need a regular size rubber band. What you’re going to do is hook the rubber band across your pinkie finger, stretch it across the back of your hand and hook it on to your thumb. Now you’re going to take your other hand and put it around your back and you’re going to try and remove the rubber band using only your entangled band, and not your teeth and your other hand. You have 15 seconds.

03:37 [Music] Were you able to free your hand from the rubber band? How did it feel while trying to remove the rubber band? It was hard. So this activity demonstrates what it might be like for a marine animal who gets entangled in marine debris. Common examples are sea birds entangled in fishing line and turtles entangled in rope or ghost line.

04:14 These animals are not like us who can

04:16 easily untangle ourselves. They end up

04:18 dying. Animals are harmed through

04:20 entanglement or ingestion.

04:44 (Teacher) Are you ready for another activity? So this is called the Plastic Break down. You need a piece of scratch paper, any size. And what we are going to do is rip the piece of paper into smaller and smaller pieces until you can no longer rip it anymore. 

04:50 [Music] (Teacher) Ok, you how small they are? So it isn’t exactly the piece it used to be but it hasn’t completely disappeared, right? This is how plastics work.  So, they break down into these teeny tiny pieces, called microplastics. These tiny pieces are especially harmful for marine animals because they can ingest them by accident. They are also super difficult to remove from the marine environment. Ok, so let’s talk about the top five types of marine debris worldwide. We have cigarette butts, plastic food wrappers, plastic straws, bottle caps, and plastic beverage bottles. What do all of these items have in common? They are all single-use items which means you use them once and then throw them away. What are some ways you can reduce your use of single-use items? Let’s take some time to brainstorm so we can reduce the amount of trash in our waterways. 

05:53 (Narrator) If you said reuse, reduce, recycle, you've

05:58 got it!

05:59 You can purchase reusable or

06:02 biodegradable products and bring

06:05 reusable shopping bags to the grocery

06:07 store, but there are other things you can

06:10 do as well. You can get involved with the

06:12 local agencies and help out in their

06:14 community events. You can get together

06:17 with some friends and do a cleanup along

06:19 the beach or in another area that needs

06:22 it. When at the beach park or playground

06:25 dispose of all trash in the proper bins

06:28 or take your trash home with you. Another

06:31 thing you can do is prevention. Limit

06:34 your use of disposable items. Think of

06:37 where your trash is going and ask

06:40 yourself how you can keep it from

06:42 turning into marine debris. Serve as an

06:45 example to others. Encourage your friends

06:48 and family to keep the beaches and

06:50 oceans clean.

06:52 [Music]

07:18 

07:24 [Music]

Growing & Strengthening a Culture of Recycling to Reduce Marine Debris in Saipan's Waters-Carolinian

With support from a NOAA Marine Debris Community-based Removal Grant, the Mariana Islands Nature Alliance, expanded local waste management infrastructure by installing mixed-waste and recycling bins at seven locations on the island of Saipan. The project also produced a marine debris educational video, available in English, Chamorro, and Carolinian, the two indigenous languages of the Commonwealth of the Northern Mariana Islands.

Transcript

Iyeel sáát 

Sáát yeel e ayoora mwungo, iimw, me e leghelegh

Sáát yeelnge e ayoora ngáli ghiisch 

Sibwe lemeli ghatchúw 

Ewei igha e lemeli ghiisch 

Ngáli yááy sáát yeel 

Ngálúúgh sáát yeel

Sáát yeel nge ngáli Saamóómw me Iilóómw
Sáát yeel nge ngáli Bwiime mwáál me bwiimw schóóbwut 

Sáát yeel nge ngáli loumw me layúl loumw 

Yaasch sáát yeel 


Nge e weires sáát yeel 

Fitoow ráágh nge bwasuulaasch e toolong llól sáát iye yaasch 

Ebwe fitoow lló ráágh bwe ebwe ffeirtiw bwasuula we 

Eyoor bwasuula kka ese ffil bwe ebwe lo llól sáát 

Si ghal aitaa bwasuula kkal bwe “Bwasuulal Sáát”

E ffat bwe bwasuulal sáát nge e tooto sangi milikka e fféér merel aramas

Ghommwal reel tappal bwasuula nge ghooma, aa maripúúlé, pappid, nge aa teeghus.
Tekking me peiráághil leeset ikka re lighitaló llól sáát nge e anngawa leliyel iigh llól sáát.

Bwasuulal sáát nge emmwel ebwe direct (e tooto merel waa me ngáre pwóólol sáát), indirect (e tooto merel bwasuulal malúmal me ngáre drainage ), iye aramas re tipáli rebwe akkáscheló me ngáre rese tipáli rebwe lighitaaló iye. 

Reel welewelil kkapas nge bwasuulal sáát e tooto meresch aramas.

Eyoor igha eghi ghitighit bwasuula we ghiisch mwo nge sise weri llól sáát

Ebwal yoor igha iigh me maalil sáát re ruughló bwe mwungo bwasuula we

Inamwo ngáre ghooma nge re fféérú bwe limwotong me ngáre e mariwriw bwete ighiwe eew ghitighiital maalil sáát 

Bwasuulal sáát emmwel bwe ebwe ghitighit, tomwógh, me ngáre e lo leepatal.

Llól sat 

Wóól sáát igha e lo iye bwasuula

Bwal me lughalapal sáát 

Me bwal faalil sáát 

Bwe igha bwasuula emmwelil ebwe ameteghi me anngawa woosch. 

Ebwal anngawa ghiisch igha sibwal bweibwogh mwungo sángi sáát yeel.

Esiiweli leliyeesch, economy, igha si ghal leeset, serágh, meefiyaasch me igha sibwe pileey ghiisch

Si nisisitai leeset iye e malaw reel iigh ssabw ghooma.


Ighila sa apasa reel limoow bwasuula ikka eyoor wóól falúw kkemwu e lo appeigh 

1. Paghúl suubwa 

2. Bwalabwalúl mwongo 

3. Mwour (Straw) 

4. Bwalabwalúl léé 

5. Léé kka e ghooma/Plastic beverage bottles 

Súllú ngáli milikka 

Meta mángemángimw reel meta weewel? 

Eyoor palúwómw? Alongal milikkal nge eghal faal eew schagh sibwe yááli.

Yóómw schagh yááli faal eew takkal nge aa akkascheló. 

Efaisúl ebwe ghitighiitiló milikka si ghal yááyá faal eew? 

Uti mwo, mángiló mwo efaisúl sibwe aghitighiitailó 

Llapal bwasuula kka ekke toolong llól sáát iye yáásch

Ngáre u palúweli bwe reuse, reduce, recycle, U weel! 

Emmwel ubwe akkame peirágh kka emmwel sibwe yááli sefááli me ngáre e biodegradable

Bwughiló tenda fuuto kkewe emmwelil sibwe yááli sefááli 

Ebwal yoor maas mille emmwel ubwe fféérú 

Emmwel ubwe alisi bwulasiyo reel igha rebwe toowow aramasal téél Marianas

Emmwel ubwe schúú me schóóluwóómw bwe ówbwe aghasaghas arol leppi me ngáre iya igha e ppwel

Ngáre u lo leppi, park me ngáre leliyel ukkur, bwughiló leeimw bwasuulóómw ngáre ataraló llól leliyel bwasuula

Bwal eew emmwel ubwe fféérú nge prevention

Fféérú mille ebwe ghitighiitiló bwasuula

Mángi ekke mweteló iya bwasuulóómw

Nge uwa mángemángeló efaisúl ubwe pileey bwasuula bwe ete toolong llól sáát

Aghatchú yóómw mwóghut bwe akkááschay rebwe bwal attabwéégh

Óóleghiló reel schóóluwóómw me familiyóómw rebwe aghatchú me aghasaghasa arol leppi me llól sáát.

Growing & Strengthening a Culture of Recycling to Reduce Marine Debris in Saipan-Chamorro

With support from a NOAA Marine Debris Community-based Removal Grant, the Mariana Islands Nature Alliance, expanded local waste management infrastructure by installing mixed-waste and recycling bins at seven locations on the island of Saipan. The project also produced a marine debris educational video, available in English, Chamorro, and Carolinian, the two indigenous languages of the Commonwealth of the Northern Mariana Islands.

Transcript

I tasi esti 

I tasi ha nånå ́i hit nengkano ́, guma ́ yan pruteksion 

Esti na tasi ha pribeniyi para hita

Debi na ta adahi 

Taiguihi ni ha adadahi hit

Esti na tasi para guåhu

Esti na tasi para hågu

Esti na tasi para i mañe ́lu-mu 

Esti na tasi para i mañaina-mu

Esti na tasi para i famagu ́on-mu yan i famagu ́on famagu ́on-mu

Esti na tasi iyo-ta 

Låo i tasi guaha prublema na

Meggai na sakkan man malofan, ya I basula-ta manhahalum gi hanom ta. 

I Basula siha ni man makkat para u fan mayamak papa’. Or malingu

I Basula ni ti debi di u fanggaigi gi halom hanom 

Ta a’agang esti or fanana’an esti, “Basulan Tåsi”

I basulan tåsi madifina komu I manmahetok na materiat gi halom tasi nu i fina’tinas tåotåo tano’

I mås bula na klåsin basulan tasi, fineni’na, i plastik, dispues i manmamafak na kosas siha, i pappit siha, yan i kuddet siha.

Kosas siha ni mana’fansesetbi para u fan makonni' i guihan siha, yanggin manmayuti’ ha’ gi tasi, siempri bula distrosu fina’tinas-ñiha gi halum tåsi.

I basulan tåsi siña måttu ginin i batku pat ottru såhyan gi tasi, siña lokkui’ gumuaha basulan tasi ginin i kosas siha ni mambinaksala halum gi tasi ni milak hånum, yan lokkui’, siña gumuaha basulan tasi sa’ manmayutti’ kosas siha gi tasi nu i taotåo siha.

Ta kumprendi na i basulan tåsi måffatu ginin hita mismu ni taotåo tano.

Guaha na biåhi na i basula mansen dikiki ya tisinia ta li’i’ gi holom I tasi.

Guaha na biåhi na i guihan yan ottru gå’ga gi tasi man linaisen ya makåkanu’ i basula sa’ sa inason niha na nengkanu’.

I butsiyun plastik siña uma’achuli’ yan i “jellyfish” pat i manlåmlam na kosas siha, yan i impiridoma siña man a’achuli’ yan i mandikiki’ na gå’ga’ gi tasi.

I basulan tasi siña ha’ sen dikiki’, siña ha sen dångkulu, siña todu klåsin mineddung.

Gi halum tåsi, 

Guaha basulan tåsi gaigi gi hilu ́ tåsi

Guaha gaigi manmåma’ya desti i hilu’ tåsi asta i fondun tasi 

Yan guaha gaigi gi fondun tåsi.

I mandångkulu yan manmakkat na basulan tasi para u disnitrosa I ribentasion ni manasaga yan manochocho I guihan ni man dikiki siha.

I basulan tasi ha na’ dådañu i lina’lå’-ta sa’ta depepende I nengkano’ ta ginen i tasi.

I basulan tåsi ti ha na’såsafu’ i lina’lå’-ta, ya ha afefekta i håfa guaha gi uriyå-ta, i ikunumiha, i hinanao gi tasi, yan i hinemlo’ta.

Ta nisisita tåsi ni bula manlåla’la’ na gå’ga’ yan nengkanu’, åhi, ti tåsi ni guaha plastik.


På ́gu maila ́ ya ta fanguentos put i singku (5) na mås sanhilu ́ na basula gi todu i tano ́ 

1. Cigarette butts – otpus chuppa 

2. Balutan Nengkano ́ 

3. Straws- ngasan gumimen 

4. Tanpin Buteya 

5. Plastik na Buteya siha     

Gof atan todu esti siha

Håfa mohon inachule’-niha este siha? 

Kåo guaha ineppe-mu? Pura ha’ esti na kosas ni mana’fan setbi gi un biåhi ha na manera. 

Sina ha’ un usa un biahi despues un yuti ́. 

Håfa taimanu ni siña un ribåha usamu nu esti siha na kosas?

Påra. Chuli ́ un mumentu ya un hassu håfa taimanu nai siña un ribåha

I basula-siha ni humahatmi hånom-ta. 

Yanggen un sångan hagon ma ́usa, ma ́usa, ribåha, pues un danchi!  

Siña un fåhan produktu nai sina manna’usa pat biodegradable na produktu siha.

Yan fañuli ́ buksiyon pappet guatu gi tenda.

Lao guaha lokkue’ nai siha mås para un cho ́gui

Siña hao sumånao yan i otro na ahensia siha ya manayuda gi okasion I kumunidåt siha. 

Siña manhamyu yan i manggå ́chong-mu yan fan na ́gåsgas gi uriyan tasi pat gi otru na lugåt ni ma nisisita mana’gasgas.

Yanggen gaigi hao gi kanton tasi pat lugat sagan humugåndu, munga maleffa para un yute’ todu i basula gi propiu na sagan basula pat sino chule ́ hånao para i guma-mu.

Otru lokkui siña un cho ́gui i para ufan chomma’.

Ribåha i ma ́usan i man ma’uusa na kosas siha.

Hasson maolek amånu ni para hinanao-niha i basula mu. 

Pues faisin maisa håo, håfa taimanu ni para un adahi na ti u fama ́basulan tasi.

Na ́ihemplu hao para otru siha na taota-ta.

Abiba i mangga  ́chong-mu yan familia-mu siha ya para u makontinua muna ́gåsgas i kanton tasi yan I halom tasi siha.  

Large Scale Marine Debris Removal in Beaufort, NC.

Through a grant from NOAA's Marine Debris Program, N.C. Coastal Reserve, the Town of Beaufort, and TowBoatUS Beaufort removed thousands of tons of large scale marine debris and conducted an abandoned vessel clean-up. BoatUS Foundation documented this effort and highlights this amazing project's impact.

Transcript

00:00 So I hope that you'll consider what the

00:02 work that's been done here and Beaufort

00:03 is kind of a benchmark for for other

00:05 things and the template that you can use

00:06 in other locations. (Rett Newton, Mayor of Beaufort, NC speaking) It's twofold right

00:09 you're cleaning up the waterways but

00:11 this is a public health issue and I

00:12 actually add a third isn't this good for

00:15 commerce wouldn't people want to come to

00:17 Beaufort to a clean water of coastal

00:19 community the answer is clearly yes. (Paula Gillikin, Central Site Manager speaking) to

00:21 undertake a project like this first you

00:24 need to understand the extent of the

00:26 problem so collecting data on the

00:28 problem understanding how much debris

00:30 there is and what the risk is to the

00:33 environment and people and then knowing

00:35 how many resources you need to address

00:37 that problem. We couldn't do a project

00:40 like this without great partnerships and

00:44 I think we have the best example of

00:47 partnership working well in the Beaufort

00:50 area with this project. We have the

00:53 coastal reserve and it's protected

00:56 Nature Reserve which is used as an

00:58 outdoor laboratory in an outdoor

01:00 classroom and we have overlapping waters

01:03 with the jurisdiction of the Town of

01:06 Beaufort. So we're both invested in the

01:09 issue for a lot of the same reasons.

01:11 We're both passionate about keeping our

01:14 environment beautiful and clean and

01:17 available for public use. (Lee Skykes, Atlantic Coast Marine Group, Inc. speaking) This project

01:21 showed how local organizers can reach

01:26 out within the community and find

01:28 various stakeholders that had unique

01:30 talents and skill sets to take an idea

01:34 and make it a viable project. And that's

01:37 what Beaufort did here. When the reserve

01:41 came to me and wanted me to get involved

01:44 with this project I said not only are we

01:46 gonna get involved from the operation

01:48 side but we're gonna get involved on the

01:50 money side too. In return we matched a

01:52 lot of money to help pull this off

01:54 because this was a big project. (Dr. Liz DeMattia, Research Scientist speaking) It's been

01:57 really fun to work with NOAA on this

02:00 project because our students can pick up

02:03 small pieces of debris but as the larger

02:06 abandoned derelict vessels

02:08 and other pieces that our students can't

02:11 pick up but that we all see when we walk

02:13 on the beaches or walk in downtown

02:15 Beaufort, this partnership allows greater

02:18 resources to take some of those out and

02:21 actually clean up our beaches from some

02:23 of the bigger things that we as

02:25 individual citizens can't do. (Lee Skykes, Atlantic Coast Marine Group, Inc. speaking) The risk

02:29 and dangers involved in a project like

02:31 this are kinda at every stage. You've got

02:34 guys underneath the water working you're

02:36 taking an item that is decomposing so

02:40 it's not as structurally intact so when

02:43 it comes up something may break and

02:45 separate. And then once you successfully

02:47 get it to the surface then you have to

02:49 get it ashore and the towing operation

02:52 of towing a partially submerged boat or

02:54 towing a piece of a boat presents its

02:57 own risk. Then when you go to shore side

02:59 trying to crane this out and a lot of

03:02 these vessels if you can just imagine in

03:05 your head that it's like wet cardboard.

03:06 So when you go to take the load it kind

03:09 of settles in the straps and it moves on

03:12 you a little bit and then you have to go

03:14 through the dismantling and disposing of

03:17 it. (Dr. Liz DeMattia, Research Scientist speaking) And some of the derelict vessels and

03:21 big pieces can pollute, right, so rubber

03:24 overtime those smaller pieces of plastic

03:27 and break up into smaller pieces of

03:29 plastic and that can enter our food

03:31 chain. Getting rid of the bigger pieces

03:33 not only improves the beauty of the area

03:37 but also decreases the probability that

03:39 any of the pollutants will break up and

03:42 enter our food chain in the ocean.

03:44 (Paula Gillikin, Central Site Manager speaking) Vessels are a problem for people they're

03:47 problem for the water and they're

03:48 problem for a wildlife. (Lee Skykes, Atlantic Coast Marine Group, Inc. speaking) I've got two

03:51 little kids they like to swim and play

03:53 on the island over there, I don't want

03:55 them getting cut up on debris there's a

03:58 lot of families that are using these

03:59 shorelines and using these waters. (Kyle Garner, Planning & Inspections speaking) We've

04:02 been extremely pleased we had no idea

04:04 that we'd be this successful this short

04:07 of time into the project. We've removed

04:09 thousands of pounds of debris as well

04:12 some abandoned vessels. We're already

04:15 starting to hear positive comments from

04:16 our community and the budding community.

04:18 (Rett Newton, Mayor of Beaufort, NC speaking) A large part of this is the education

04:22 just making sure that they understand

04:23 sometimes marine debris can be out of

04:25 sight out of mind but it doesn't mean

04:26 it's not there

04:27 doesn't mean that it's not impacting us.

04:29 (Paula Gillikin, Central Site Manager speaking) We want to bring the public out to the

04:31 Nature Reserve out to the Rachel Carson

04:33 Reserve and have them participate in

04:36 marine debris cleanups, have them

04:38 invested as a part of the project so

04:42 that they understand marine debris

04:43 issues better, and we'll go home and

04:46 think about perhaps the products that

04:49 they're using that can contribute to

04:51 marine debris. Start at home securing

04:54 your debris in the proper way.

04:56 Making sure it's not overflowing in your

04:58 recycling bin think about the things

05:00 that you use in your home and instead of

05:02 putting those vegetables in a plastic

05:04 bag at the grocery store try just

05:06 putting them in a reusable bag and then

05:08 you won't have to worry about that bag

05:09 getting away from you. (Rett Newton, Mayor of Beaufort, NC speaking) You’ve got the federal level

05:12 you've got the state level you've got

05:13 the municipal level and you've got

05:15 commercial entities and you've got

05:17 academic entities that are involved as

05:19 well.

05:19 And this is all part of a clean water

05:21 coastal community.


First Place Winner: 2020 Ohio PSA Competition

This video is the first place winner for the 2020 "Communicating for a Clean Future" Ohio Marine Debris Challenge. This competition invited students from Ohio's Lake Erie coastal communities to create public service announcements to bring awareness to the issue of marine debris.  

Transcript

Imagine visiting Lake Erie just like the millions of others seeking entertainment and relaxation. Through Canada and the U.S alone, 12 million people rely on clean drinking water from the lake...Does this look enjoyable to swim in?... Does this make you feel relaxed?... Unfortunately, this is the modern day reality of water conditions in Lake Erie. One of the biggest problems in our lake is human pollution. Over a hundred million pieces of plastic are estimated to be floating around, invading Lake Erie. Plastic litter from humans ends up traveling up the food chain from animals eating it, to it seeping in toxic chemicals to our organs. The build up of pollution in our lake is causing very serious consequences to our ecosystem. Plastic and litter get lodged into fishs' bodies causing many organisms to die. Pollution from farmers causes runoff which also leads to algae in our lake. However, there is something we can all do to slow down the pollution rate. We can use reusable water bottles, metal straws, throw away garbage properly, eliminate plastic usage, and do cleanups on the beach. These are all small steps everyone can take to help make Lake Erie's water conditions healthy. 

Third Place Winner: 2020 Ohio PSA Competition

This video is the third place winner for the 2020 "Communicating for a Clean Future" Ohio Marine Debris Challenge. This competition invited students from Ohio's Lake Erie coastal communities to create public service announcements to bring awareness to the issue of marine debris.  

Transcript

Marine debris is a subject that is constantly being discussed and dealt with in all bodies of water. It is human created waste that harms the environment and the animals living in the lakes. Around the world, there are 5.25 trillion pieces of plastic debris floating in the oceans. This acts as a serious threat towards not only the people who benefit from the beautiful waters, but also to the animals that inhabit it. More than 3,500 different species live in the Great Lakes, all of whom depend on clean water to thrive. We all need to take action by cleaning the bodies of water so we do not see the harsh consequences that our planet will suffer from. Some easy ways we can work together to solve this problem are by using reusable water bottles and bags. Be part of the solution, not the pollution! 

Second Place Winner: 2020 Ohio PSA Competition

This video is the second place winner for the 2020 "Communicating for a Clean Future" Ohio Marine Debris Challenge. This competition invited students from Ohio's Lake Erie coastal communities to create public service announcements to bring awareness to the issue of marine debris.  

Transcript

“Only we humans make waste that nature can't digest." - Captain Charles Moore 

Marine Debris is solid material that has been disposed of or abandoned into the marine 

environment or the Great Lakes. 

Plastic makes up about 80% of the marine debris in the Great Lakes. 

Microplastic is extremely small, broken down plastic debris. It poses a large threat to the Great 

Lakes.

Microplastic severely harms animals in and around the lakes. 

What can we do to help? 

Organize a beach cleanup. 

Recycle. Keep as much plastic out of the water as you can. 

Keep our Great Lakes Clean. 

Lake Erie Love 

TRASH TALK Special Feature

Don’t you think it’s time we all have an honest trash talk? Ocean Today, in partnership with the NOAA Marine Debris Program, presents TRASH TALK, a 15-minute special feature on marine debris for World Ocean Day.  

This feature video includes the TRASH TALK video shorts What is Marine Debris?, Where Does Marine Debris Come From?, Impacts of Marine Debris, Marine Debris and Plastics, What is the Great Pacific Garbage Patch?, and What Can We Do About Marine Debris?

Northwestern Hawaiian Islands Marine Debris Project Webinar – July 2019

On July 24, 2019, the NOAA Marine Debris Program hosted a NOAA Science Seminar. James Morioka, with the NOAA Pacific Islands Fisheries Science Center, presented on the 2018 Marine Debris Removal and Assessment in the Northwestern Hawaiian Islands, a large-scale mission to survey and remove marine debris from the islands and atolls of the Papahānaumokuākea Marine National Monument. Over the course of 41 days, two ships, and with the support of a shore-based mission, the team was able to successfully remove over 74 metric tons (164,000 lbs) of derelict fishing gear, plastic, and other marine debris from the shallow coral reef and shoreline environments. This webinar provides an overview of the project’s history, survey, and removal methods, recent research, and future missions.

About the Speaker:
James Morioka is the Operations Manager for the Ecosystem Sciences Division (ESD) at NOAA Pacific Islands Fisheries Science Center (PIFSC). He specializes in project planning, logistics, and field operations. He has been with NOAA PIFSC since 2011 and has managed large-scale marine debris removal operations in the Northwestern Hawaiian Islands since 2015. 

Transcript

Introduction and chatter before the presentation begins.

MaryLee- Everybody, we will get started in just a few min.

Tracy -Looks like we have a good turnout today, 33 people. I wish there was 133 people James, you have such a cool slide deck. Can you tell I’m a fan?

James- Yes, very excited to be here

MaryLee – I’m going to wait one more moment.

Tracy -Can you hear MaryLee as well as you can hear me?

MaryLee- Ok, let’s get started. Good morning and good afternoon to you depending on where you are. I want to welcome you to NOAA s NOS science seminar. The goal of this seminar is to communicate and discuss a variety of coastal and marine topics of interest to NOAA and to the coastal and marine community. My name is MaryLee Haughwout and I’m with the Marine Debris Program and I’m cohosting this seminar with Tracy Gill who’s the coordinator for the NOAA NOS Science seminar series. I want to thank Tracy for all your help pulling this seminar together as this is the first time I’ve been using Adobe connect and leading the science seminar.
 

Before I introduce our speaker today, I want to get though a few housekeeping items. The audio for today’s event is over your computer speakers. We will have time for questions at the end of the presentation. You are welcome to enter your questions into the chat box during the talk but we will not address the questions until the end. If you’re interested in getting a PDF copy or a recording of today’s presentation you can contact me, at Marylee.Haughwout@noaa.gov or Tracy.Gill@noaa.gov, our email addresses are in the chat box. And we would be happy to send you a copy and if you are also interested in being on the subscription list for the NOAA weekly science seminar email list, you can contact Tracy gill she will add you.
 

So without further ado, I’m going to introduce our speaker. I’m very excited to have James Morioka as our guest speaker today. James will be discussing the 2018 Marine Debris removal and assessment in the Northwest Hawaiian Islands within in the Papahānaumokuākea Marine National Monument. James is the Operations Manager of the Ecosystems Sciences division at the NOAA Pacific Island Fisheries Science Center in Hawaii. Where he specializes in project planning, logistics, and field operations. James has been with NOAA Fisheries since 2011 and has managed large-scale marine debris removal operations in the Northwestern Hawaiian Islands since 2015. So welcome James and thank you for all your hard work you put into this presentation. And I’m going to turn it over to you, so take it away.
 

James begins his presentation

(Numbers below correspond to the slide number in the PowerPoint presentation)

  1. Aloha to all those tuning in from Hawaii and hello to all those tuning in from across the United States. Thank you very much for having me, and thank you MaryLee for the introduction….(next slide)…As MaryLee mentioned, my name is James Morioka and I am the Operations Manager for the Joint Institute for Marine and Atmospheric Research at the NOAA Pacific Islands Fisheries Science Center, Ecosystem Sciences Division in Honolulu, HI. And today, I have the privilege of sharing with you a project I am very passionate about. Many of you in the audience today have been tremendous supporters of this project over the years, and for that, we are very thankful.
  2. Today, I’ll be presenting in detail, the ins and outs of the Northwestern Hawaiian Islands Marine Debris Project: a survey, assessment, and removal operation at the islands and atolls of the Papahānaumokuākea Marine National Monument. I’ll be going over background information on the Hawaiian Islands and why Marine Debris is so prevalent here, the Project History, our Survey and Removal methods, highlights and accomplishments from the 2018 field mission, on-going research, what we’ve got in store for the future, and at the end, I’ll be taking questions pertaining to this project.
  3. Before I get started, I wanted to thank and acknowledge all of our project partners that make this project possible. Our partners include the NOAA Pacific Islands Fisheries Science Center, the Joint Institute for Marine and Atmospheric Research, the NOAA Marine Debris Program, the NOAA Damage Assessment, Remediation, and Restoration Program, the National Fish and Wildlife Foundation, the Nets-to-Energy or Fishing-for-Energy program Schnitzer Steel and H-Power Covanta, the University of Hawaii, the NOAA Papahānaumokuākea Marine National Monument program, US Fish and Wildlife Services, the National Marine Sanctuaries Foundation, SatLink Global, and of course, all of the Co-trustees of the Papahānaumokuākea Marine National Monument including the State of Hawaii Department of Land and Natural Resources and the Office of Hawaiian Affairs.
  4. Quick background information on the Hawaiian Islands. The Hawaiian archipelago is centrally located in the North Pacific Ocean, in the middle of the world’s largest gyre, the North Pacific Gyre. This gyre is made up of a system of ocean currents and oceanographic factors, and moves large bodies of water, and subsequently marine debris, around the Pacific Rim, from East Asia, the Aleutian Islands, the Pacific Northwest, and the Equator. In the middle of this gyre lies the Hawaiian Islands, made up of the 8 Main Hawaiian Islands, and the uninhabited Northwestern Hawaiian Islands. The Papahānaumokuākea Marine National Monument, the world’s largest contiguous marine protected area, encompasses the Northwestern Hawaiian Islands and the water around them, and is more than 2 times the size of the state of Texas. The Papahānaumokuākea Marine National Monument is home to 70% of shallow water coral reef habitat in the United States, and is home to more than 7,000 marine species, a quarter of which are endemic, or found only in Hawaii. The most important protected species are the critically endangered Hawaiian monk seal, threatened green sea turtle, and the humpback whale.
  5. Here are a few photos of the beautiful islands and reefs of the Northwestern Hawaiian Islands. You have your beautiful low-lying islands and islets, reticulated coral reefs located within ancient atolls, the turquoise blue shallow sandy lagoon areas, and your beautiful stretches of white sand beaches.
  6. And at these beautiful islands and atolls, is rich, diverse, marine wildlife. From your Hawaiian monk seals, sea turtles, reef fish, vibrant coral reefs….(next slide)… to your resident spinner dolphins, schools of sharks, and charismatic seabirds. And if you’ve ever been up to the Northwestern Hawaiian Islands, you know it is nature as it’s intended to be, wild and raw. On the bottom right, you can see a large tiger shark, a couple of feet from the beach, about to pick off a Laysan Albatross fledgling chick.
  7. But as I mentioned before, the Northwestern Hawaiian Islands lie in the middle of the North Pacific Gyre. And within this gyre, debris from all across the Pacific swirls around and concentrates in convergence zones, or what they may refer to as garbage patches. But these aren’t patches of garbage that make up floating islands. This is more like debris soup, an area with a higher concentration of debris than the rest of the open ocean….(next slide)… And these high density, high concentration areas are then affected by many different factors that make Hawaii so susceptible to being on the receiving end for large deposits of debris on our shorelines and reefs. Such factors include your powerful northeast trade winds, which are prominent here in the Hawaiian Islands. …(next slide)…. Large swell, predominantly from the North – northwest during our winter months… (next slide)… and of course, we here in Hawaii are very susceptible to storms, such as hurricanes and tropical storms. And this is amplified during El Nino years, where the water warms in the North Pacific causing a shift in the North Pacific subtropical high, bringing warm water and debris closer towards the islands. The warm waters also tend to cause storms to develop closer to the islands of Hawaii, and storms to travel towards Hawaii… (next slide)… And all of these factors ultimately cause the marine debris issue to amplify in the Hawaiian Islands. These Hawaiian Islands, then act as a comb, to filter out all of this floating debris.
  8. As you can see on this map, the islands, atolls, islets, reefs, and seamounts that make up the Hawaiian archipelago extend wide, some 1500 miles across the North Pacific Ocean. This is more than half the distance across the continental U.S. That’s a lot of area….. (next slide)…. On your right you have your 8 Main Hawaiian Islands, and to the left you have the VERY different islands, atolls, shoals, seamounts, and reefs that make up the Northwestern Hawaiian Islands. They are different in shape, structure, and habitat which make them even more susceptible to marine debris accumulation.
  9. For those of you that may be unfamiliar with the geology of the Hawaiian Islands, I’ll take just a minute to describe it. The Hawaiian Islands literally emerged from the seas. The Hawaiian Islands are the exposed peaks of a great undersea mountain range known as the Hawaiian-Emperor seamount chain, formed by volcanic activity over a hotspot in the Earth’s mantle. The Hawaiian Islands developed as the Pacific tectonic plate moved slowly northwest over a hotspot in the Earth’s mantle. The hot spot is fixed, but the plate is moving. So the island of Hawaii, or the Big Island, currently sits atop the hotspot, and has live volcanic activity. The other islands which have moved slowly northwest are older islands, no longer with active volcanoes.
  10. From the Main Hawaiian Islands to the Northwestern Hawaiian Islands, all of the islands and atolls you see today were once formed by volcanoes….(next slide)…the Big Island being the youngest at about 400,000 years old, and Kure Atoll being the oldest at about 28 million years old.
  11. And just as the volcanoes emerged out of the sea, over time, the older islands have also subsided, or sunk, back into the ocean, often turning into shallow reefs or atolls around the area where a volcanic island once was. And the older islands in the Hawaiian archipelago, such as the Northwestern Hawaiian Islands have formed atolls, shoals, and other expansive reef areas. If you look at the graphic on your screen, you’ll see how an atoll is formed. The volcano emerges out of the ocean, corals begin to settle and grow around the island forming a fringing reef expanding over the next 100,000 years, and as the reef expands, the interior island begins to subside, and the fringing reef turns into a barrier reef. When the island completely subsides beneath the water, it leaves a ring of growing coral with an open shallow lagoon in the center, and the formation to an atoll is complete.
  12. You can see a perfect example here in the picture of Pearl and Hermes Atoll, where you can distinctively see the barrier reef, and the shallow lagoon within it. **This distinctive feature of the Northwestern Hawaiian Islands make them extremely susceptible to accumulating entangling marine debris like derelict fishing nets. Unlike the Main Hawaiian Islands, which have a steep incline of reef from the depths to the surface, the Northwestern Hawaiian Islands stretch far with shallow water coral reef habitats between 0-20 feet. That’s why the marine debris often accumulates on shore in the Main Hawaiian Islands, and on the reef in the Northwestern Hawaiian Islands. To give you a visual, in all of the Northwestern Hawaiian Islands, there is about 15 square kilometers of emergent land area. That’s about the size of Los Angeles International Airport, LAX. But there is about 350 square kilometers of reef area between 0-20 feet deep. That’s 20 times larger than the area of emergent land. And we are only talking reef area between the depths of 0-20 feet.
  13. And because of that, 52 metric tons of floating derelict fishing gear accumulates on the reef in the Northwestern Hawaiian Islands annually. And when these islands and atolls are comprised of very sensitive ecosystems, that sustain and perpetuate tons of marine wildlife, you have to do what you can to protect it. You folks have probably heard of the 3 R’s, Reduce, Reuse, Recycle. We like to teach the 5 Rs. The first R is the first line of defense, to Refuse. But the fifth R, that’s where we come into play… Remove. With so much wildlife depending on these essential keystone habitats, there needs to be constant maintenance and cleaning to make sure the healthy reef and ecosystem can thrive. And that’s why this project plays such an important role in the success and health of the Northwestern Hawaiian Islands. So how does marine debris affect the NWHI? The 4 main ones we are concerned about are entanglement of marine mammals, turtles, and fish…. Ingestion of debris whether that is seabirds, turtles, seals, or other marine wildlife…. Habitat damage such as the destruction of live vibrant reefs from derelict fishing gear…. and the introduction of non-native species through travelling marine debris.
  14. Here are a couple of photos of what we’ve observed over the years.
  15. And here are some photos we’ve snapped of wildlife entangled or engaging in direct contact with derelict fishing gear.
  16. So this project, the NWHI Marine Debris Project got its start back in 1996 when monk seal and turtle researchers stationed in field camps across the NWHI observed copious amounts of marine debris. They also were the first to see first-hand, the alarming rate of entanglement of wildlife in derelict fishing gear. The first full marine debris season kicked off in 1999, starting with 3 separate ships deployed concurrently for 120 days. In 2006, the President announced that the Papahānaumokuākea Marine National Monument be created to protect the Northwestern Hawaiian Islands and the surrounding waters. And by 2006, the heavy lifting for debris removal was said to be complete, the backlog of derelict fishing gear on the reef was said to be cleared, and removal operations were scaled back to maintenance mode, which was to annually remove the 52 metric tons of debris from the reefs, which it is estimated to accumulate each year. In the 20 years of the project, we’ve removed over 922 metric tons or 2 million lbs of debris and help disentangle countless animals.
  17. In a recent study, they mentioned that 28% of the 1,400 remaining critically endangered Hawaiian monk seals alive today are because of marine debris removals, disentanglements, and rehabilitation efforts.
  18. Now I will discuss our survey and removal methods for removing debris in-water and on land. Our project focuses primarily on derelict fishing gear removal from shallow coral reef environments between 0-30 feet deep. We survey and remove debris in-water using two methods, 1). Tow-board or towed diver, and 2). Traditional swim. For land, we follow standard NOAA Marine Debris Program protocols.
  19. For tow-board surveys, or towed-diver surveys, we use a 17-19’ inflatable boat to tow a team of freedivers, or snorkelers, at 1-2 knots, 50 feet behind the boat. The divers use breath-hold techniques, not scuba, and wooden boards to fly through the water to rapidly visually survey for nets. Using the boards our divers are able to move quickly left and right, up and down, through the water to effectively survey the most area.
  20. This is used most predominately in the back-reef areas of fringing reefs….(next slide)… The waves typically have enough energy to bring the floating nets over the deeper forereef and into the backreef before it gets caught up.
  21. This is an example of how we conduct towboard surveys….(next slide)….First we use a program called ArcGIS and benthic habitat maps to identify how much surveyable reef area between 0-30 feet each island and atoll has, focusing on the shallower areas of reef where the floating nets tend to get caught up…(next slide)…. Then we establish our survey area, by creating a survey polygon or box, with an area of 0.25 square km. Please note that the box on this slide is not to scale… (next slide)… We deploy our team of divers and maneuver the small boat through the shallow survey area. We use a pattern similar to “mowing the lawn” …(next slide)  Once a net is identified, data is collected, the net is cut safely off of the reef to prevent further damage, and the survey continues. …(next slide)… the survey will continue until the survey area is complete or the boat is full of net
  22. Here is an example of what the spatial data looks like after a field mission. Each track line is set at 15m wide, which is the minimum visibility criteria for our two divers. This ensures accurate representation and calculation of our survey area. You can see that all measures are taken to ensure complete survey and maximum net removal.
  23. For swim surveys, the boat team helps direct freedivers to navigate through and around patch reef areas to swim, survey, and find net.
  24. This is a picture of the patch reef area at Pearl and Hermes Atoll… (next slide)… similarily to the towboard surveys, the survey area is created (next slide until divers) and the divers are deployed. …(next slide)… once deployed, the divers swim side by side in a zig-zag pattern, covering the reef area…(next slide)… they will continue to swim until they find a net… (next slide)… just like the other method, once a net is identified, data is collected, the net is cut safely off the reef, and the survey continues until the survey area is complete or the boat is full of net….(next slide)…. Once the survey is complete, the survey area is calculated and the net locations are mapped using our GPS tracks and waypoints.
  25. This is the spatial data from this year’s tow and swim surveys at Pearl and Hermes Atoll… (next slide)… here’s a close up…(next slide)…. And here are the locations of the 315 net cluster removed.
  26. For both in-water methods, once the net is identified, data is collected on the net such as net type, size, volume, fouling, coral growth, as well as habitat data such as depth and benthic composition (% coral, macro-algae, turf algae, crustose coralline algae, sand, etc). Then the dive teams breath hold dive to safely cut and remove the net without damaging the reef. The nets are then manually hauled into the small boats until the boats are full. Once full, the nets are craned out of the boats onto the ship.
  27. Here are some pictures of the process. In your top left you have a net on the reef, a team of divers carefully removing the net, a boat team hauling the large net into the deck of the boat, and the ship craning the net load out of the boat onto the ship.
  28. Land debris is straight forward. The team accesses the beach via small boat, the team is deployed on land, they storm the beach, and all of the nets and other entanglement hazards are removed from the shoreline. The debris is loaded onto the boats and offloaded onto the ship similarly to the in-water debris.
  29. Play debris video. I’d like to show a quick 2 minute video of the survey and removal process.
  30. In 2018, we had a 41-day mission in September-October 2018, which was 3 part, on two separate ships with a shore-based mission in-between. In total we yielded over 164,000 lbs, or over 74 metric tons of debris removed.
  31. The mission commenced on September 19, with Leg 1 aboard the NOAA research vessel, Oscar Elton Sette. It was staffed with 17 divers and coxswains – coxswains are folks that drive the boats, 1 UAS pilot, and 1 data manager. It focused exclusively on in-water removal operations at Pearl and Hermes Atoll, and 2.23 square km of shallow reef area was surveyed and cleaned, resulting in over 51,000 lbs of derelict fishing net removed.
  32. Here are some highlight photos.
  33. At the tail end of leg 1, the ship pulled into port at Midway Atoll, which lies near the end of the Northwestern Hawaiian Islands chain. On October 5, 14 diver and coxswains and 1 UAS pilot got off the ship to continue Leg 2 of the field mission. The NOAA ship began its transit back to Honolulu to offload the debris. The staff of 15 at Midway Atoll executed in-water and shoreline removal operations for one week. On October 12, 10 staff got onto a new ship, the merchant vessel Imua, to continue leg 3 of the field mission. Leg 2 continued with 5 field staff members before flying home on October 25. Leg 2 of the mission resulted in 1.35 square km of reef area surveyed and cleaned, and 0.41 square km of shoreline surveyed and cleaned, yielding over 63,000 lbs of debris removed.
  34. Here is a spatial map of the tow and swim survey areas, and the land debris shoreline survey areas.
  35. Here are a few highlight photos from Leg 2.
  36. Leg 3 of the mission started on October 13 with 10 staff aboard the chartered vessel Imua. It focused exclusively on shoreline removal operations at Kure Atoll, Pearl and Hermes Atoll, Lisianski Island, Laysan Island, and French Frigate Shoals. 0.18 square km of shoreline were surveyed and cleaned, resulting in over 49,000 lbs of debris removed.
  37. Here a few highlight photos from Leg 3. As you can see many of these beaches are littered with derelict fishing gear and other marine debris. In the top right of your screen, you see 3 marine debris team members carrying loads of debris miles across sandy beaches to the nearest boat access point.
  38. On October 30, the field mission came to an end. The debris was offloaded from the two ships, and sorted and organized for outreach and education, and a media day event. Leading up to, and following the field mission, 906 people were directly reached through outreach and education. We spoke at 10 elementary or intermediate schools before the mission, and 3 high schools attended outreach events following the mission to help sort and tally the marine debris brought back to Honolulu. Information about the project was also shared on blogs, local television networks, magazine articles, and even CBS’s 60 Minutes.
  39. Following the field mission, we worked to properly recycle and dispose the debris. Our partners at the Nets-to-Energy Program at Schnitzer Steel and Covanta helped down-cycle all of our nets by incinerating them to create electricity for homes on Oahu. The clean, usable plastic was provided to artists for artwork, and to non-profit organizations for outreach. A portion of the plastics was donated to a non-profit to recycle and create new products such as soap dispensers, skateboards, and sunglasses. The remainder was sent to the Waste-to-Energy program to create electricity here on Oahu.
  40. For this year’s field mission, not only did we remove 74 metric tons of debris, which roughly translates to the weight of 45 mid-size cars… but we got to continue and pilot some awesome research. We continued our shoreline accumulation study at Midway Atoll, and gathered shoreline accumulation data from 5 new islands and atolls this year. We also started a Structure-from-Motion pilot study to measure the negative impacts of nets on coral reefs. We paired that with a satellite buoy pilot study. Lastly, we got to use UAS’s or drones to try and determine if net detection from the air was feasible.
  41. The shoreline accumulation study has been going on since 2012, with our first data set collected in 2013. The Midway Atoll data set has a 5 year time series, and the data set at Kure Atoll, Pearl and Hermes Atoll, Lisianski Island, Laysan Island, and French Frigate Shoals is now at 1 year. With data over time and now over space, we hope to analyze and better understand shoreline accumulation rates, which are not accounted for in the 52 metric tons annually, across the NWHI.
  42. So our study site started in 2012. Due to ship delays, a team of divers were left on Midway Atoll for an extended period of time, allowing them to completely clean the entire atoll of all debris, including the backreef area and the shoreline area. This helped create a clean slate to start assessing for accumulation….(next slide)…The backreef area was stratified by direction into 5 classes, with 7 survey polygons each. The shoreline was divided into 300m survey segments….(next slide)… our shoreline accumulation rate data focused on Sand Island, Eastern Island, and Spit Island.
  43. Each shoreline was divided into 300 meter linear segments, measured along the vegetation line. These islands and sandy shorelines often shift in shape and size from weather, but the vegetation line remains fairly consistent. ..(next slide)….The boats access the shoreline and deploys the field team. ..(next slide)….Using their handheld GPS, the team makes their way down the beach, staying within the water line and vegetation line, collecting all marine debris 10cm or larger, which is about the size of your palm. Smaller debris that is easily identifiable, such as bottle caps and lighters are collected. Hazardous debris such as metal, glass, and lumber, are not surveyed for or collected. . ..(next slide)….Debris is then piled up and staged in several locations along the shore. . ..(next slide)….The team carries on until the survey is complete. ..(next slide)….Once the survey is complete, a team member walks back and tracks the survey area. They use information from their GPS and visually assess where they surveyed and cleaned. . ..(next slide)….Once that is complete, the survey area can be calculated. ..(next slide)….The debris is then loaded into the small boats and transported back to the ship, or in Midway’s case, back to Sand Island, where it is weighed and each debris item is tallied.
  44. Here are some examples of the spatial data from the shoreline surveys at Midway Atoll.
  45. For each 300m shoreline segment surveyed, we have pertinent information that will help us assess accumulation rates. We have the date of last survey, to easily calculate how many days the debris has been accumulating, accurate shoreline survey area, the weight of the debris removed from that survey area, and the tally of each debris item. Therefore, over time, we can measure the rate of change in accumulation, and the change in debris items or debris composition.
  46. Here are some photos of the debris we find. It’s predominantly derelict fishing gear, such as your hard plastic floats, foam floats, eel cone bait traps, and oyster spacer tubes which are used for aqua-culturing. However, we do find a lot of plastic you may use in your everyday life, such as tooth brushes, umbrellas, cigarette lighters, shoes and slippers, and of course, the plastic single-use beverage bottle.
  47. We were able to carry this study forth to 5 new islands and atolls. Here is some spatial data from Green Island on Kure Atoll, Laysan Island, and Lisianski Island.
  48. A real interesting project we were able to pilot this year was the Structure-from-motion study to quantitatively measure the impact of nets on reefs. Structure-from-Motion uses thousands of overlapping still 2-D images to stitch together a 3-D mosaic. Mosaics of the reef were created at impact sites, before the net was removed from the reef, and after the net was removed from the reef, to compare net size to scar size. The impact sites were paired with nearby control sites. Analysis and results are still pending.
  49. Here is a screenshot of what a 3-D mosaic looks like in space. It creates an accurate depiction of the reef by taking each point from each picture and projecting it in a 3 dimensional space. It’s as if you threw sand over an invisible reef. . ..(next slide)…. Here is a mosaic of an impacted site… (next slide)… I will be sharing with you some short videos of the impact sites with the net in place, and after the net was removed. …….. You can clearly see the scar site where the net used to be. . ..(next slide)…. This technology can be used to measure damage caused by the net on the reef.
  50. The net locations were randomly selected by surveying stratified sites based on likelihood or probability that a net would be caught on the reef, using historical survey data. ..(next slide)…. This is a spatial map of the impact sites and control sites at Pearl and Hermes Atoll
  51. The Structure from Motion study is a great opportunity for us to learn how much direct impact a single net has on a single reef. To better understand the total impact of a net on reef ecosystems, we paired the Structure-from-Motion study with a satellite buoy pilot study. The goal of the satellite buoy study is to better understand how many reefs a single net impacts or comes in contact with, before settling. Therefore, we tagged 6 nets that fit our criteria, which meant the nets had to be over 75% buoyant, level 1 bio-fouling, meaning they were fairly clean, and a minimum of 0.5 m3. We will be monitoring them for the duration of this year. Preliminary data has shown that some nets have began to move from reef to reef within the atoll.
  52. Lastly, we used UAS, or drones, to try and detect nets from the air. We used a fixed wing, vertical take-off and landing UAS, deployed and recovered from the small boat. The UAS was flown at 60m altitude, which was determined the optimal altitude for getting good area coverage without compromising image quality. We used RGB or Red-green-blue and IR or Infrared sensors. We were able to map 3.39 square kilometers of reef area in less than 10cm resolution. The area mapped using the UAS were then ground truth after, using swim survey methods to identify all net location points. Although analysis is still pending, the preliminary results using the IR spectrum seems promising.
  53. Here is a photo of a net on the reef using the IR sensor. ..(next slide)….You can see it circled here in red. ..(next slide)….Here is a map of the flight areas in orange, with the swim survey area and net locations identified via in-water surveying overlaid. We hope that UAS can be a tool used in the future to identify large nets or high density accumulation zones to reduce in-water survey time.
  54. So what’s in store for us in the future? 2020 is a data analysis year. We hope to analyze the shoreline accumulation data, the Structure-from-motion data, and UAS net detection data. We hope to achieve results that will correlate net size and weight with the damage caused to coral reefs. 2021 is our next projected field mission. This will be a large-scale, 30 to 60 day field mission, to remove as much debris from these sensitive habitats as possible. We will go and resurvey the impact and control sites using Structure-from-Motion, to measure successional change in benthic habitat composition, and measure the rate of coral growth. Hopefully we can present quantitative data that shows the positive impact that net or marine debris removals have on coral reef ecosystems.
  55. That’s all I have for today, but if you want to learn more about the project or about the NOAA Marine Debris Program, please visit marinedebris.noaa.gov, or fisheries.noaa.gov. If there is time at the end following the questions session, I’d like to show a 6 minute video highlighting the Papahānaumokuākea Marine National Monument and this project. My information is listed there on this slide, please feel free to reach out to me at any time. Thank you.

Video

(Kalani Quiocho speaks on the video) – There is an olelo no’eau a Hawaiian proverb and it goes ku’i ka’lei mokua Kanaloa, and what that means simply in English is that the islands are strung together like a lei by the ocean. And even deeper than that, in a Hawaiian context, it means the islands are strung together by Kanaloa, or the Ocean Deity, a Hawaiian God. But if you look further into the meaning, the kauna, that deeper meaning, it means that humanity is united by the ocean. Humanity is united by the ocean.
 

(Kevin O’Brien speaks on video) In the North Pacific there is a system of ocean currents and oceanographic factors that are in play and are a big part of the reason why the Northwestern Hawaiian Islands have such a big problem with marine debris. Anything that is dropped into the ocean around the Pacific Rim ends up getting swirled around by this North Pacific Gyre. And the Northwestern Hawaiian Islands lie in the very center of this North Pacific Gyre.  The Northwestern Hawaiian Islands act then as a big comb and filter out all that floating marine debris.
 

(James Morioka speaks on the video) There’s about 1,400 Hawaiian Monk Seals left in the world, 1,100 of which live in the Northwestern Hawaiian Islands. Our job is to ensure that these animals have a chance at success. So, cleaning up their habitat and cleaning up where they live is our number one priority.
 

(Kevin O’Brien speaks on video) Every year, 52 metrics tons of derelict fishing gear accumulates in the Northwestern Hawaiian Islands and that doesn’t even include any of the ocean plastics that end up washing up on the shorelines of these islands and atolls.
 

(Kalani Quiocho speaks on the video) When I see the images of the ingested plastic in seabirds, when I see the entanglements of marine wildlife… I didn’t necessarily put those things in the water but I am part of this system that sourced those things. So, trying to figure out what in my reach, what in my immediate reach can do? That’s what I have control over.
 

(James Morioka speaks on video) Whether you live by the shorelines or you live up in the hills or you live up in the mountains, our debris is making its way into the oceans. Whether that’s changing your lifestyle at home, reducing the amount of single-use plastics you utilize, or reusing some of the plastics you’ve already purchased or already have at home. I think everybody can make a difference by making a small change. Now get to work!
 

(Kalani Quiocho speaks on the video) The work being doing in Papahānaumokuākea is really really important andI’m very proud of our marine debris team. The work that they do is an extension of the work that were are trying to achieve as well within the Monument.
 

(James Morioka speaks on video)  I think there is a lot of hope for this project because people do care about the environment and people do care about how we can make a change. If you love something, it’s really to want to protect it.

James- Awesome, well thank you guys very very much. I see Sarah’s comment down there and I will be sharing this video with all of you. Thank you for having me, this has been a real pleasure.

Tracy and MaryLee – Bye everybody, thanks for coming!

Chat from 7/24/19 NOAA/National Ocean Service webinar by James Morioka

Tracy Gill/Marylee Haughwout:

The seminar starts at 3pm EDT. The audio is over the computer (or voice over IP). If you cannot hear anything, turn up the volume on your computer speaker or headset. If you still cannot hear, log off and back on; sometimes that works. If you want to expand the presentation window, there is a small button with arrows to the upper right of the presentation; this will toggle the presentation size larger or smaller; you will lose the chat and captioning boxes if you toggle to the larger view, but you can always can always toggle back to smaller. If you are interested in viewing the video or obtaining a PDF of this presentation, please contact Marylee.Haughwout@noaa.gov or Tracy.Gill@noaa.gov

General chat comments posted inside Adobe Connect during the presentation:

Tracy Gill: Great video!

Sara Roberts: I'd love to get the recording of this webinar when we're finished if possible!

Tracy Gill: Hi Sara, Email me and I will send you a recording.

Annette DesRochers: will the presentation be available online?

Tracy Gill: Yes, the plan is to have the presentation and webinar on the marinedebris.noaa.gov website but you can also email me if you want a copy directly.

Michael Le: Hi Tracy, I would like a copy.  Thanks.

Tracy Gill: Hi Michael, It is easiest if you email me directly with your request.

Tracy Gill: If folks have any questions please feel free to type them in the chat box and we will get to them at the end.

Ya'el Seid-Green: Question for the end: 1) How long does it generally take to cover a .25 km survey square? 2) Is the marine debris distributed heterogeneously or relatively homogenously? -  would the amount of debris on un-surveyed areas be about the same as those surveyed?

Sherry Lippiatt: Thanks for a great presentation! It sounds like you are planning to analyze the shoreline data next year, but have you seen any preliminary trends in the amount or composition of debris?

Michael Le: Does the survey include microplastic onshore deposition and in the water column?

Ya'el Seid-Green: Thanks so much!

Brittney Wong: What do you think is the best way to prevent future/increase derelict fishing gear?

Laura Ingulsrud: Do you have data on the types of fishing gear you find? (e.g., crab/lobster traps, larger nets, fishing line)

Sara Roberts: we've all seen pictures of albatrosses eating and being affected by plastics on land - have you seen albatrosses harmed by entanglement offshore?

Matthew Clark: Is shore-based debris mainly based on what is clearly visible at the surface, or do you also account for possibly buried debris that may become exposed over time?

Marina Psaros: 70% of the nets you find are from trawl...did you say that's mostly trawl gear that originates in Hawaii?

Raquel Aki 2: Excellent presentation! Papahānaumokuākea is culturally significant to the native Hawaiian people and we mahalo you and your team for your hard work

Mark Manuel: No trawl fishery in Hawaii

Marina Psaros: thought so, I think I heard James incorrectly.

Mark Manuel: Yeah, longline is the main commercial fishing fleet

Marina Psaros: ok, makes sense! :)

Marina Psaros: which fishery?

Marina Psaros: (which fishery is the gear associated with, I mean)

Laura Ingulsrud: Are you able to track the general area the fishing gear originates from?

Marina Psaros: Super interesting presentation. The tow boards look SOOO FUN!  :)

Mark Manuel: Difficult to identify specific fishery. Any fishery (both domestic and international) utilizing trawl or purse seine gear could be responsible.

Annette DesRochers: AWESOME presentation! Thank you for sharing

James Morioka: https://marinesanctuary.org/blog/video-spotlighting-the-threat-marine-de...

Tracy Gill: If you are interested in the open Marine Debris Program grant opportunity you can visit marinedebris.noaa.gov. The opportunity is open until September 4.

Tracy Gill: This is for removal. We will have another FFO for prevention announced in September.

Jennifer Samson: Great presentation and excellent work protecting such a special place.

Sara Roberts: Thank you so much for all the hard work you've done to clean up these incredible islands.

Sara Roberts: James - did you say that you could share these great videos with us?

Sara Roberts: thank you!

Elzbieta (Ela) Gajewska: Thank you

Trash Counts

If you wish to be part of the solution to marine debris and are ready to do more than talk trash, watch our new TRASH COUNTS video featuring a citizen science project that is making a difference, one data entry at a time.

Transcript

Teacher: “Falcons” on three! One, two, three... Falcons! All right, let’s go!

These students from Scotts Valley High School near Santa Cruz California are fired up. Over the next few hours they will be scouring the beach, searching not for treasure, but for trash.

Student 1: We got a spoon!

Student 2: A cigarette butt.

Student 3: Oop… bottle cap.

They are painstakingly identifying each item and keeping count.

Their class will track trash over time. It's all part of a program that helps scientists drive new plans to reduce marine debris, through understanding what ocean trash ends up where.

Did you know that eight million metric tons of plastic ALONE enters our ocean every year? That’s equivalent to over 2.5 million elephants or more than 27,000 747 jets; and yes, you heard it right - that’s every year!

Marine debris, or trash in our ocean and Great Lakes, can cause a lot of problems for the health of animals and people.

Luckily, there are many people out there that are doing something about it. They’re spreading the word and cleaning up the trash,

BUT If we want to figure out the best way to solve this problem, we need to learn more about it. We can do that through monitoring.

Student 1: Is that larger than 2.5 centimeters?

Student 2: It is… not, so we do not have to categorize it. We just keep on walking. Ooh! Straw! Delicious.

Marine debris monitoring means that we’re keeping an eye on debris in a certain location and tracking changes over time.

Student 1: Um, we have found a lot of plastic fragments… a lot of food wrappers. Plastic bottles… just kind of food-related trash.

By recording the amount and types of marine debris, we can learn valuable information, like what kind of trash is the biggest problem, what locations have the most debris, and during what time of year more debris can be found.

People all over the country, and the world, are working together to monitor the marine debris they find on their shores.

Student 1: Obviously, this isn’t the only beach that has accumulated plastic, and by taking the census of all the trash around here, basically could give anyone even a rough estimate of how much there is on just any beach, in general.

This big picture can give us ideas for solutions and tell us if the prevention programs we already have are working.

Now, students like you can make a real difference using resources like the Marine Debris Tracker app or the Marine Debris Monitoring Toolkit for Educators. With these powerful tools students can now collect local data, and share that information with their community and neighbors so they can come up with solutions to reduce trash on their shores.

OceansLIVE! Talking Trash: A Call to Action

Join Amy Uhrin, NOAA Marine Debris Program's Chief Scientist, as she talks about marine debris with Katie Register, Executive Director of Clean Virginia Waterways, during Capitol Hill Ocean Week 2016's OceansLIVE! segment put on by the National Marine Sanctuary Foundation. This segment, titled "Talking Trash: A Call to Action," was originally live-streamed and talks about marine debris and what you can do to help.

OceansLIVE! Talking Trash: A Call to Action transcript

0:50 welcome to day two of Capitol Hill ocean week 2016 here on oceans live
0:56 i'm your host Kate Thompson coming to you live from Capitol Hill ocean talk
1:00 don't forget to be part of our conversation by tweeting us questions
1:03 using hashtag child 2016 or chat us at oceans live . org this morning will be
1:09 turning to one of the biggest and most preventable problems facing the ocean
1:12 today
1:13 marine debris but before I introduce this morning's panelist i want to tell
1:17 you about the highlights from last night's ocean prom
1:20 the National Marine Sanctuary foundation hosted the 14th annual oceans awards
1:24 gala at the ronald reagan building an international trade center in washington
1:28 DC
1:29 many of the oceans most influential leaders such as the Lifetime Achievement
1:33 Award winner and I Noah Thompson came out to celebrate the importance of our
1:37 ocean
1:38 senator maria cantwell was honored with the leadership award and recognition for
1:42 her leadership in the fight for ocean conservation and for her advocacy for
1:46 sustainable fisheries expanding ocean acidification research and increased
1:50 ocean monitoring and science
1:52 the Foundation also honored volunteer of the year captain Scott hickman from the
1:57 flower garden banks national marine sanctuary
1:59 now back to today's panel on marine debris so what happens the litter on the
2:04 street or trash on the beach too often it ends up in the ocean which is filled
2:08 with items that don't belong there
2:10 huge amounts of consumer plastics metal rubber paper
2:14 textiles derelict fishing gear and other lost or discarded items enter the marine
2:18 environment every single day
2:20 joining us to talk today about that enormous and preventable problem is my
2:24 colleague from Noah
2:26 aimie Amy urine amy is the chief scientist for knows marine debris
2:30 program will talk with her about the sources and impacts of marine debris and
2:35 what knowing know is doing about it
2:37 we're also joined by Katie register the executive director of clean Virginia
2:41 waterways which works with long university to improve Virginia's rivers
2:46 and other water resources through citizens stewardship for more than 20
2:50 years now clean Virginia waterways has coordinated the International coastal
2:54 cleanup in Virginia
2:55 thanks ladies so much for joining me today in the studio
2:59 hey everybody here yeah i'm really excited to talk about this crazy problem
3:02 of marine debris
3:04 so I'm going to start us off with a quick question take a look at a picture
3:07 here
3:08 so what do you see and just give me one word of of what what that means to you
3:13 well i would say preventable and i have to say three words surprised but not
3:19 surprised
3:20 yeah right for words haha well you know what I'm just to me I look at that and I
3:28 go
3:29 that could be mine and I you know I'm gonna hold this up right here this right
3:35 here is a toothbrush that you know it's a transportable toothbrush that you
3:41 everybody sees when they go on vacation or a trip they they take this toothbrush
3:45 with them but it hits home because everybody uses a toothbrush every single
3:49 day
3:50 so how does that end up that was at the monument how does that toothbrush end up
3:54 the monument up in the northwestern Hawaiian Islands
3:57 I mean it's just it's crazy to think about that that that albatross right
4:00 there is looking at somebody's toothbrush from who knows where in this
4:04 world so I mean every day we use things such as cans or coffee cups or plastic
4:17 water bottles all of these things can become marine debris
4:23 so those are a few examples but Amy can you tell me a little bit about what
4:28 marine debris is and what and why it's such a big problem right so you kind of
4:32 hit on some of the high points
4:34 k and that is the definition of marine debris tells us that they are the solid
4:39 and persistent man made materials so their manufacturing process materials
4:44 that are intentionally or unintentionally directly or indirectly
4:48 abandoned or discarded into the Great Lakes and the marine environment and as
4:53 you indicated it's an everyday problem and it's a global problem
4:56 it's an everyday problem because as you said everybody across the globe uses
5:01 these products in their everyday life in some capacity right so it's an everyday
5:05 problem
5:06 it's a global problem because there are a lot of people in the world and people
5:09 across the planet are using these products everything
5:12 single day and if they are mismanaged if their waist is mismanaged if the
5:16 recycling is managed they can find their way into the environment into waterways
5:20 and eventually into the ocean
5:23 it's also a global problem in the sense that we are all connected by the ocean
5:27 right the continents are surrounded by water and so something that ends up in
5:31 on a beach end up in the water on a shoreline say in Florida you know could
5:38 find its way up the coast to Virginia could find its way into the Caribbean
5:42 things that wash into the ocean off the coast of Japan could find their way to
5:45 the west coast of the United States due to tides currents you know wind waves on
5:50 the surface and so debris
5:52 Marie connects us in that way it's not necessarily going to be a local problem
5:56 but your local problem we can extend beyond your immediate vicinity right I
6:01 read a book once it was called Moby duck and it-it-it talked about a container
6:06 ship the container was lost off the ship in the middle of the ocean and it was
6:10 carrying rubber duckies
6:12 so you know we all can relate to a rubber ducky and and being in the
6:15 bathtub with rubber ducky
6:17 but what was interesting about the book is it is we are completely
6:21 interconnected it is one ocean that these environmentalists and research
6:26 scientists were tracking these rubber duckies all over the world people were
6:30 finding them everywhere so it doesn't matter if the u.s. is completely clean
6:35 of marine debris and say you know Africa isn't and they have Tom marine debris
6:40 it doesn't matter it goes everywhere find its way it can find his way
6:43 everywhere so I mean at that
6:44 that was pretty impactful book for me to read just to understand how that all
6:48 works but you know speaking of that so where does it come from
6:52 I mean do what I do in my backyard can that go into the ocean oh absolutely i
6:57 mean as you point out trash travels
6:59 it travels from tiny streams two rivers to base to the ocean and most of the
7:05 trash has been documented it comes from inland even though it's called marine
7:10 debris most of it comes from inland
7:13 we're talking about a tennis ball that somebody loses we're talking about a
7:16 cigarette but that was tossed out of a car window
7:19 and in fact there's a group the ocean conservancy does the International
7:24 coastal cleanup were thousands of volunteers pick up debris items and they
7:28 record data and you're looking right now at the top 10 most frequently found
7:34 debris items
7:35 this was collected last year by nearly 800,000 volunteers worldwide notice
7:40 number one cigarette butts
7:42 almost everything on the list after cigarette butts have to do with what we
7:46 eat and what we drink
7:48 so a lot of that's coming from inland however about 20 or so percent comes
7:53 from the marine environment mostly we're talking about things that go fishing
7:58 that's crab pots lobster pots things that are designed to capture animals and
8:04 so when they become derelict or abandoned in the ocean in the coastal
8:09 environments they can be very very deadly to the animals and the wildlife
8:13 that live there
8:14 right right i think we were diving in the Florida Keys just the other day and
8:18 you know the the season for lobstering what had been over for two months and we
8:22 found one on the bottom that was still goes fishing and had like eight lobster
8:26 still in it so easy craving it's no longer attached to its float:right still
8:31 catching and killing animals and then the animal that it get in the trap
8:34 become bait for the next right animals come along right
8:38 so Amy I'm going to ask you a couple Tuffy's back
8:42 so where is all this stuff end up and basically how much I mean can you give
8:48 me a figure like poundage or weight of how much marine debris end up in the
8:52 ocean
8:52 deriving that kind of exact statistic is very difficult for a number of reasons
8:57 but perhaps the largest one is just the vastness of the ocean right it's a huge
9:02 water body and so if you want to try to derive some statistics about how much is
9:06 in the action you have to make sure that your sampling all the different oceanic
9:09 compartments and so when debris finds its way to the coast
9:13 it can become stranded on the shoreline so that's a compartment
9:17 it can find its way into the nearshore surface waters and eventually out to the
9:20 open ocean surface water so it can be on the surface it can possibly sink and
9:25 become vertically distributed in the the water column
9:29 it can completely think to the sea floor right and be laying on the bottom both
9:34 in nearshore environments and debris has been found on in deep submarine canyons
9:38 in the ocean
9:39 it can become buried when it's on the sea floor and also animals take up the
9:44 debris and so in order to try to figure out how much is out there you would have
9:49 to effectively and accurately sample all those different compartments which is a
9:52 very very difficult task
9:54 um what we do know though is study came out last year by researchers at the
9:58 University of Georgia
10:00 they looked at a hundred and ninety-two coastal countries across the globe and
10:04 looked at waste management practices and what they found was that about
10:09 on average eight million metric tons of mismanage plastic waste actually ends up
10:14 in the ocean and out of those a hundred and ninety two countries there were a
10:19 top 20 which contributed to eighty-three percent of that eight million metric
10:23 tons so we have numbers like that where we know how much is entering the ocean
10:27 but once it enters it becomes distributed right again I said the ocean
10:31 is vast and so we do know that there are areas where it tends to accumulate rack
10:36 line on beaches so where vegetation comes up and get stranded is kind of a
10:41 hot spot for marine debris if you will and then also in the open ocean areas
10:45 where currents converge on one another are natural areas of debris accumulation
10:49 and also everyone is probably heard of the North Pacific Garbage Patch well the
10:54 reason
10:55 that debris is accumulating there is because there's an oceanic gyre there
10:59 and what a gyre is a system of rotating currents so they can be clockwise or
11:04 counterclockwise depending on which hemisphere in but think of them as a
11:07 giant expansive slow-moving whirlpool if you will right so they're rotating like
11:12 this and what happens in a whirlpool things get drawn into the middle so they
11:16 tend to be areas of accumulation of debris on
11:19 but even though debris accumulates there you can't just go out and encounter
11:23 sample it or collect it because there tend to be very small particles in the
11:29 gyre so the larger plastic items can break down through UV radiation hitting
11:35 the particles some bacterial action and so a lot of the materials that are in
11:40 those generals are very tiny like this and it's difficult to sample this kind
11:44 of material when it's so small
11:46 the other problem is that the jurors move it so they're slowly rotating but
11:52 depending on wind patterns and the temperature of the water the gyres can
11:55 actually shift within a water body and they can shift as much as a thousand
11:59 miles north or south depending on conditions and so on
12:05 I think I made a good point to indicate that it's not having it you can just go
12:08 with a dip net and then quantify how much is out there
12:11 unfortunately yeah he's shaking your head fortunately
12:14 oh ok well Katie I mean what are the impacts mean all this stuff in the ocean
12:20 and the environment can't be good
12:22 so what are some of the impacts that that are found out there
12:25 the most famous impacts are those on wild animals
12:29 seabirds dolphins sea turtles even whales have been documented to eat
12:34 they ingest the plastic and trash mistaking it for food especially plastic
12:38 bags can look a great deal like a jellyfish and jellyfish are the favorite
12:42 food of many sea turtle species of so ingestion
12:46 but by wildlife is a big issue another big impact is entanglement animals that
12:51 become entangled in nets or fishing line or the ribbons on balloons are usually
12:57 plastic so in addition though to the impacts on wild animals we also impact
13:03 on habitat for example of a plastic bag or a piece of fabric even on a coral
13:08 reef can destroy and kill the living coral
13:12 there are also impacts on human safety and you don't want to be on a boat
13:16 get your prop caught up in a fishing net and burn out your engine so you've got
13:20 safety issues there right
13:23 there's also food chain issues right now there's a concern that some of the
13:27 animals that form the base of the food chain in the oceans like plankton so
13:32 plankton smaller juvenile fish when they ingest marine debris typically smaller
13:36 plastic particles like I indicated earlier larger fish eat the smaller fish
13:40 an even larger fish eat those fish so what we really don't have a good handle
13:44 on right now is how those effects translate up the food chain and then
13:48 eventually to us because there are some species or plastics have been documented
13:52 from their guts and then their species that we eat
13:55 the other concern is that there could be population-level effects for the species
14:00 that do in jest marine debris so not only does it impact individual organisms
14:05 in terms of their biology or their physiology but it can have impacts in
14:09 the next generation so a study came out earlier this year looking at oysters and
14:14 so they found that oysters didn't just tiny micro plastic particles microbeads
14:18 what they found was that it affected the aspects of the reproductive system of
14:23 those oysters so sperm or less motile eggs were smaller
14:28 there weren't as many eggs and also in the next generation of oysters those
14:32 oysters were smaller
14:33 so we're starting to get indication that yes there can be individual level
14:37 impacts but possibly we could be talking about impacts up the hierarchy at the
14:42 population level
14:43 so essentially we are ingesting the plastic that can kind of scary to think
14:48 sir
14:50 so you work for noah and obviously this is such a large problem that that no one
14:57 Congress that we need to create a program
15:00 so can you tell us a little bit about Noah's marine debris program for I do so
15:03 I love to
15:04 so the program is actually established through an act of congress the marine
15:08 debris act in 2006 so this year is our ten-year anniversary which is very
15:12 exciting and the act was real
15:14 rise in 2012 and so what the active is it instituted the program and provided a
15:19 number of mandates that we were to operate under or a number of activities
15:23 that we were supposed to coordinate and and and and handle and so from those
15:28 mandates our program actually developed five pillars coordination emergency
15:33 response prevention through education and outreach removal and research and so
15:39 coordination is a big one we have nine regional coordinators across the United
15:43 States alaska and hawaii and they serve as our eyes and ears on the ground for
15:48 the program because we're here in washington DC at headquarters
15:51 but they also serve as a focal point for folks in that region that are working on
15:55 marine debris issues so they know who they can contact if they have questions
15:58 and they can get people to network that are working on similar issues and things
16:02 of that nature for emergency response in the last 10 years we've actually help to
16:07 respond to four different events the american samoa tsunami the japanese
16:11 tsunami and then hurricanes Katrina and Sandy and so we assist states or
16:16 territories that are impacted by those events and trying to get a handle on
16:21 what washed up
16:23 how much of it where it came from and then prevention remove one research and
16:27 so each year we hold grant competitions for prevention and removal projects and
16:34 so removal projects might include these are larger ticket removal larger ticket
16:39 items so this might be a project where a community has a derelict vessel in there
16:43 harbor and they just been wanting to get rid of it they just haven't had the
16:46 means to do so and then the prevention grants seek to a fun project looking at
16:52 education and outreach so how can we teach folks about marine debris and how
16:56 it can be prevented and so this might be someone developing a curriculum for
17:00 school to teach students
17:02 it could be a community that wants to put up signage because their community
17:05 is on a water body and they want to make people aware of what marine debris is
17:09 and and how we can combat it
17:10 and then lastly research so withheld grant competitions for research in the
17:15 past we also fund research through other mechanisms but looking at several
17:18 different aspects of the marine debris issue source
17:21 how much how its distributed how it moves through the environment
17:25 and how it impacts animal this Katie was talking about
17:28 and so again our ten-year anniversary we're really excited about all our
17:31 accomplishments
17:33 you can check us out on marine debris . know . go to learn more
17:36 yeah well I know that sanctuaries has received quite a few of those amazing
17:40 grants to go out each year and bring up that either derelict fishing gear or
17:45 just pounds of trash and it
17:48 it really is amazing that the marine debris program does these grants because
17:52 it helps us to to clean up and make somewhat of an impact anyway so Katie
17:59 tell me a little bit more about the clean Virginia waterways program and
18:03 what you do all right well for 22 years clean Virginia waterways has led the
18:07 international coastal cleanup in the state of Virginia
18:10 we've our volunteers of removed more than 3 million pounds of trash from
18:15 Virginia streams rivers and beaches
18:17 they also collect data because it is part of the international coastal
18:21 cleanup we've also done some groundbreaking research our first big
18:25 research project was on cigarette butts which is the number one source of
18:29 plastic that people don't understand that those filters are made of cellulose
18:33 acetate
18:34 we've also recently been working on research about balloon releases balloons
18:39 are very unique source of marine debris
18:42 it's one of the few things that people purchase they go outside with the intent
18:46 of releasing it into the environment and i think most people have no idea or
18:52 don't think about how one hundred percent of those balloons will return to
18:56 Earth or the ocean and we find hundreds and hundreds on the ocean beaches of
19:01 Virginia
19:02 we also recently with our partners the Virginia coastal zone management program
19:07 and Noah wrote the Virginia marine debris reduction plants so Virginia is
19:13 one of the very few states in the United States that has a plan to deal with
19:18 marine debris and reduce it over the next 10
19:21 yours well we actually have a question from our live chat you can chat your
19:25 questions in and we will answer in your life which we're going to do right now
19:30 so our question is how can civilians get involved in the cleanup
19:33 oh boy getting involved and clean up there in first of all the International
19:37 coastal cleanup
19:38 you can learn about it through Ocean Conservancy and they will tell you where
19:42 in your state of who to contact
19:45 wherever you live not just in your state is international but people can also get
19:49 involved by prevention prevention is one of the biggest solutions to marine
19:53 debris cleanup SAR great data collection very important but prevention by the 3
19:59 r's reduce the amount of trash you're producing everyday SE nota straws reuse
20:06 things reusable shopping bags coffee mugs things like that
20:10 recycle of course whatever trash you do end up producing but yes it's very
20:16 preventable whether you're in fourth grade or you're a country i mean there's
20:20 so much we can do with education legislation and innovation and that you
20:26 just wanted to share one little thing when the Virginia Institute of Marine
20:30 Sciences worked on a panel to put on crab pots and this panel is made up of
20:37 readily biodegradable plastic so if a crab pot gets severed from its float and
20:42 it's down there in the Chesapeake Bay or coastal waters after a while this panel
20:47 will biodegrade in any animal that's captured can come out
20:50 well the scientist who created this said well let's do that with shotgun wads
20:54 shotgun
20:55 if you're a hunter and you're off shooting there's a piece of plastic that
20:59 separates the powder from the shot made out of plastic
21:03 unruh treatable once the shotguns been shot
21:06 so they are gearing up to make available commercially these biodegradable odds
21:12 for shock and so it's just a sample of innovation right to solve the problem
21:18 can I see on facebook or something the other day there is that a beer company
21:21 because because that's always the this six-pack rain and that's what you always
21:26 see like around turtles or whatever but there's actually a beer company that now
21:30 they're making edible rings like it
21:32 turtles can actually eat the ether rate I think it's genius like we all need to
21:37 move forward and come up with these innovative ideas to prevent this from
21:41 happening
21:42 so what are some of the solutions that your organizations are working on to
21:48 combat marine debris
21:50 I think Katie touched on several of those but I didn't want to make kind of
21:53 a plug for her
21:55 our marine debris monitoring and assessment project so again if you go to
21:58 our website it's under the research header and so this was a project that
22:02 was initiated as a result of the japan Tsunami and 2011 that i mentioned before
22:06 and our partners were really interested our partners on the west coast were
22:10 interested in determining what kind of debris was on the shorelines all ready
22:13 to serve as a baseline before the potential influx of debris from the
22:18 japan Tsunami and so our staff developed some rapid assessment protocols so folks
22:23 would go out on their shorelines on the west coast of the US and do some random
22:27 recounts and get a handle on you know what was out there and so that project
22:31 has been around for for a while now and just at the beginning this month we
22:35 launched an online tool box for that project that's called to get started
22:39 toolbox and so it's kind of a one-stop shop online for folks who participate in
22:44 the monitoring project as Katie group does where they can find all the tools
22:49 that they need to get started if they're not yet a partner or to continue being a
22:52 partner things like all the data sheets can be found there in the field manual
22:57 and a photo field guide folks sometimes are not sure what to call a piece of
23:01 debris when they find it so there's a nice handy field guide they can look at
23:04 there's a video tutorial for folks who are interested in getting involved in
23:07 the project so they can watch the tutorial and figure out what exactly is
23:11 involved how do we actually monitor on the beach on
23:14 yeah so I would encourage folks to get involved if you want
23:17 don't want to take on something as large as being an official part of the
23:20 monitoring project just participating in in beach cleanups in your area or even
23:25 if you don't live on the coast line participating in a clean up wherever you
23:28 live because as we've you know it's been a theme in this discussion it can end up
23:32 in the ocean and often times it does right and just looking back at that top
23:36 10 list that collected by the International coastal cleanup volunteers
23:40 tells you a lot of what we could do we can say no two straws for example you
23:45 know most people really don't absolutely need a straw smokers can use pocket
23:50 ashtrays or they're also a strange that you can buy for your car since i don't
23:55 have ashtrays built into them anymore
23:57 i mean if if smokers stop littering if people who eat and drink
24:01 stop littering or if they go to reusable water bottles and reusable shopping bags
24:07 so this top 10 list gives us a lot of answer right right so again let's show
24:12 that that reusable water bottle
24:15 this one we can go here first over this
24:18 this verse this there we go if your reusable the plastic use reusable and if
24:26 you have to use single-use disposable make sure you get it recycled right
24:30 right
24:31 recycle recycle recycle I think it's important we talk about recycling to to
24:35 make sure you understand the recycling policies in your area because they vary
24:39 they vary across stage at a very across communities within States so really find
24:44 out what is and is not recyclable in in your community and so that you know
24:47 because it can be a problem for the recycling industry when things are mixed
24:51 commingled the Sun can be recycling some can so it does create problems for that
24:56 industry so so knowing knowing the rules and regulations in your area is really
25:01 important for example important you know such a large problem but so completely
25:05 preventable
25:06 absolutely so completely confident we can solve it right reduce reuse recycle
25:10 thanks ladies your money for joining me they and discussing this incredibly
25:14 important topic
25:15 you can learn more about knows marine debris program at marine debris . Noah .
25:19 gov and about the clean Virginia waterways program at longwood dot edu /
25:24 clean VA at 11:15 a.m. child will continue discussing this issue with a
25:30 panel on turning trash into cash
25:32 innovation and industry leadership will be back with Capitol Hill ocean talk at
25:36 twelve-fifteen with a panel on ocean acidification
25:40 but before we go I want to extend a special thank you to our presenting
25:43 sponsors the national oceanic and atmospheric administration the US
25:46 Department of the Interior and the walton family foundation the co-host of
25:50 chow
25:51 the Campbell foundation
25:52 the Gordon Betty Moore Foundation and all the sponsors
25:55 because without their support the success and accessibility of child would
25:59 not be possible
26:00 thanks so much for watching and I'll see you right back here at 12:15

First Place Winner: 2019 Ohio PSA Competition

This video is the second place winner for the 2019 "Communicating for a Clean Future" Ohio Marine Debris Challenge. This competition invited students from Ohio's Lake Erie coastal communities to create public service announcements to bring awareness to the issue of marine debris.  

Video Transcript

Lake Erie is the eleventh largest lake in the whole world and we are lucky to be able to call it our home. Lake Erie is beautiful and provides us with many things to do. Our islands are full of life, and on any given day in the summer, hundreds of people will be out enjoying the lake and its beaches. But what seems like just having some fun, can actually badly harm our environment. When people do not properly dispose of their trash or just leave it behind, it leads to the pollution of our waterways. And as a result of debris in our lake, marine life is endangered, animals can get entangled within nets, swallow cigarette butts and plastics, and be poisoned by chemicals in the water. But we can prevent this from happening by properly disposing of trash, recycling when possible, participating in local cleanups, and using reusable items instead of single-use items.

Second Place Winner: 2019 Ohio PSA Competition

This video is the second place winner for the 2019 "Communicating for a Clean Future" Ohio Marine Debris Challenge. This competition invited students from Ohio's Lake Erie coastal communities to create public service announcements to bring awareness to the issue of marine debris.

Video Transcript

Imagine coming to Sandusky, Ohio and wanting to go fishing, swimming, and to do many other water activities but the water is covered in plastic and trash. There are more than 100 million pieces of plastic in Lake Erie alone. Plastic is getting into our waters by wind, garbage trucks, and ourselves, whether we know it or not. Plastic is not only ruining our waters but it is also killing marine life. Marine debris, also known as marine litter, injures and kills marine life, interferes with navigation safety, and poses a threat to human health. Our oceans, lakes, rivers, and streams are being polluted with a wide variety of marine debris ranging from soda cans and plastic bags to run down fishing gear. Reducing, reusing, and recycling is a great way to keepplastic out of our waters. By refusing the straws, the bags, the bottles, we can be the change we wish to see in the world.

First Place Winner: 2018 "Communicating for a Clean Future" Ohio PSA Competition

This video is the first place winner for the 2018 "Communicating for a Clean Future" Ohio Marine Debris Challenge. This competition invited students from Ohio's Lake Erie coastal communities to create public service announcements to bring awareness to the issue of marine debris.

Video Transcript

[Clips of recreational activities on Lake Erie]
Lake Erie is home to many beautiful things. The lake and islands are full of activities and adventures. We know it as a place we can relax with friends and enjoy our time.

[Clips of specific debris types]
But there is a bigger issue, items are being disposed into the Great Lakes. It can range from litter to abandoned vessels.

[Clips of large amounts of marine debris]
This marine debris is hurting our environment, economy, and health. Marine debris can kill and injure marine wildlife through ingestion and entanglement, endanger human health, and hurt businesses and tourism by polluting our beaches and coastline.

[Prevention clips]
Reduce, reuse, and recycle to keep debris out of the ocean in the first place. You can bring your own shopping bag, drink out of a reusable bottle, and participate in things like a shoreline cleanup to help stop marine debris.

Second Place Winner: 2018 "Communicating for a Clean Future" Ohio PSA Competition

This video is the second place winner for the 2018 "Communicating for a Clean Future" Ohio Marine Debris Challenge. This competition invited students from Ohio's Lake Erie coastal communities to create public service announcements to bring awareness to the issue of marine debris.

Video Transcript

Ohio is home to one of the most signifiant bodies of water in the world - Lake Erie. The great lakes combined are the largest surface freshwater system on Earth.
In addition with Lake Erie, Ohio is home to the Ohio River, along with 3,300 named rivers, as well as 60,000 lakes and ponds.
Lake Erie and the Ohio River have been engrained with North American physical and cultural heritage for decades. The question is, are humans doing their part to keep these special bodies of water clean?
As a resident of Ohio, or better yet, as a resident of Earth, we all have a responsibility to keep our waterways clean and clear.
Every year, over a million lives are lost due to marine pollution.
No, not human lives, but animals.
Nearly 1 million birds and 100,000 marine animals die as a result of marine litter.
This is unacceptable.
We not only have the possibility, but the responsibility to make a difference. Reduce, reuse, and recycle.

Third Place Winner: 2018 "Communicating for a Clean Future" Ohio PSA Competition

This video is the third place winner for the 2018 "Communicating for a Clean Future" Ohio Marine Debris Challenge. This competition invited students from Ohio's Lake Erie coastal communities to create public service announcements to bring awareness to the issue of marine debris.

Video Transcript

A dream in paradise is a day at the beach... but is this what you imagine paradise to be?
Marine debris has been a growing global problem.
It is man made, including everything we produce, consume, and throw away, which then gets thrown, drifted, and carried into our lakes, rivers, oceans, and all this garbage is consumer by marine animals, killing and harming them, entangling them and destroying their habitats and families.
All it takes is one piece of garbage to harm or potentially kill an animal.
One person at a time, we are reducing trash in our water systems, reducing the world's largest patch of trash at 7 million square miles in the North Pacific Ocean. Within one square mile, scientists recovered 1.9 million pieces of marine debris.
We are working every day, one day at a time, in saving animals and keeping our seas free of debris!

NOAA Divers Free Green Sea Turtle from Net in Hawaii

In October 2014, a team of 17 NOAA divers sailing aboard NOAA Ship Oscar Elton Sette returned from a mission to remove marine debris from Papahānaumokuākea Marine National Monument in Hawaii, a World Heritage Site and one of the largest marine conservation areas in the world. Divers encountered and rescued three sea turtles tangled in different nets.

Video Transcript

In October 2014, a team of 17 NOAA divers removed 57 tons of derelict fishing nets and plastic litter from Papahānaumokuākea Marine National Monument in Hawaii.
They also rescued this protected green sea turtle entangled in derelict fishing gear at Pearl and Hermes Atoll.
Three green sea turtles were freed during this mission.

Permit PMNM-2013-001
Co-Trustee Conservation and Management activities in Papahānaumokuākea Marine National Monument

NOAA Marine Debris Program Removal Webinar, April 2017

On April 27, 2017, the NOAA Marine Debris Program highlighted three Community-Based Marine Debris Removal Grant projects focused on crab pots around the United States in a "removal webinar." This webinar provided an opportunity for NOAA’s existing partners to learn and exchange information pertaining to crab pot removals from different regions. The presentations covered project overviews, key measures of success, lessons learned, and general project highlights from the following removal projects:

  • Fisherman-led Dungeness crab gear recovery in Northern and Central California, UC Davis School of Veterinary Medicine
    Presenter: Kirsten Gilardi
  • Creating a self-sustaining strategy to remove derelict fishing gear in North Carolina, North Carolina Coastal Federation
    Presenter: Ladd Bayliss
  • Derelict crab trap removal and prevention in shallow coastal bays: transferring a sustainable marine debris program, Stockton University
    Presenters: Mark Sullivan and Steve Evert

Transcript

Jenna Malek: Good afternoon everybody, thank you so much for joining us for the Marine Debris Program communications webinar series. Just a quick introduction for those of you that might not be super familiar with the NOAA Marine Debris Program. We are in NOAA”s Office of Response and Restoration and our mission is to investigate and prevent the diverse effect so of marine debris. To fulfill this mission, we have 5 pillars which include: regional coordination, emergency response, research, prevention, and removal which we are going to be focusing on today. In future webinars, we will be focusing on other things such as prevention. One of the big things that our program does is that we give out grants to different partners in order to do things such as removal and prevention, and since 2006 when the program started, with our partners, we have removed over 5500 tons of debris from the coastlines of the United States and the Great Lakes. Today we’re going to focus on a few of the current removal grants that we have, and these are all really interesting because they revolve around the removal of derelict crab pots, but they take place in different parts of the country. A really cool characteristic that these projects have is that they are all working with local fishing communities. So we are really excited for you to join us today and to hear about these projects. We will start first with Dr. Kirsten Gilardi at the University of California Davis in the School of Veterinary Medicine. Kirsten take it away!
Kirsten: Thanks! Happy to be here with all of you spread out all over the country and maybe even in other parts of the world. Thanks for organizing. My name is Kirsten Gilardi, I am the co-director of the Wildlife Health Center at the UC Davis School of Medicine in CA and am presenting today on behalf of my staff person Jennifer Renzullo as well. So we’re going to talk about this project for which we currently have NOAA MDP funding for implementation.
(next slide)
That’s a photo of Jen Ren, my colleague. We launched the California lost fishing gear recovery gear recovery project well over 10 years ago, July 2005, with some initial funding form the California Ocean Protection Council. We modeled our program very closely on the derelict fishing gear recovery programs that were underway at the time in Washington state and Hawaii and the Northwest Hawaiian Islands. To date, overall, our project have recovered more than 120 tons of fishing gear and debris and that has been comprised of many hundreds of nets and traps and pots, as well as millions of feet of monofilament fishing line. As we’ve gone through this project, as I’m sure we’ll hear from the other projects, we’ve documented many entanglements, well over 1000 entanglements and entrapments including marine mammals and sea birds, sharks, fish, live and dead, and of course a lot of lobsters, Dungeness crabs, other crab species, other invertebrates.
(next slide)
Our first several years, we did most of our work in the Southern California Bight. Our grants were fairly geographically specific. We worked very closely with urchin harvesters as our contractors and they essentially did search and collection underwater for derelict fishing gear, both for nets and also lobster gear.
(next slide)
That was keeping us plenty busy for quite a while and then we started receiving calls as our project became well known in the state, we were receiving calls from fishermen on the north coast of California just talking about what they perceived to be a really growing problem with derelict Dungeness crab gear. This is a photo just to show you how big and harsh the ocean can get. Those aren’t crab pots, those are boats. But basically, ocean conditions on the north coast are pretty severe, there is a lot of boat traffic, kelp and the combination of those factors means that everybody in the fleet loses gear and there was too much of that accumulating as far as the fishermen and other ocean users were concerned.
(next slide)
We first received funding from the National Fish and Wildlife Foundation (NFWF) through their fishing for energy program in the summer and fall of 2015 and launched this program in partnership with the Humboldt Fisherman’s Marketing Association (HFMA). The HFMA themselves selected 3 boats to serve as the primary crews in the field recovering gear and the HFMA members themselves agreed that those fisherman would be paid $50/trap that they pulled and $75 per pumped trap. They would also have their fuel costs reimbursed and then HFMA, the gear that they bought from the fishermen, the derelict gear, would then be sold back to original owners, for the same price.
(next slide)
So the result of that pilot effort was that the three different fisherman spent 20 days on the water and ended up recovering 666 lost and abandoned Dungeness crab traps, as well as a lot of buoys and line. And that gear represented by gear lost by 65 different boats.
(next slide)
And if you look at what I call the fiscal snapshot, out grant from NFWF was $109K and we sub awarded the HFMW $50K to cover gear retrieval costs and boats and fuel, etc. HFMA, of that $50K sub award, spent about $45K to pay fishermen for retrieval and to cover some of the reimbursable costs and when the HFMA turned around and sold the retrieved traps back to the original owners, they earned $25,805 which they put into an Escrow account to support future gear recovery efforts.
(next slide)
So this program was successful enough that we started to field inquiries from other parts of the coast. There was an interest in continuing the work in the North coast, but there were parts further down the coast also interested in getting involved. So we applied for funding from the Marine Debris Program and continued our partnerships with the HMFA but then also expanded and partnered with the Commercial Fishing Association of Bodega Bay (CFABB) and this time around, having gone through the pilot effort and having had success with that, we tried some new strategies. We set just one price per trap whether pulled or pumped. We decided not to continue fuel reimbursement to the retrievers. For those retrievers who had already been working on the projects, we did not place project staff on the boat as an observer. And then the fisherman themselves handled all of the gear sales back to original owners.
(next slide)
This is kind of a dense slide, I apologize for that, but it does kind of itemize or describe the result of this NOAA funded effort. On the North coast, again partnered with HMFA in fall 2015 and 2106. We worked with a couple different crab fishermen who retrieved 326 traps in 10 days of effort. Those traps represented gear lost by 28 different permit holders and of those 326 traps, 243 were returned to owners. Only 16 were purchased and 83 traps were recycled. In the San Francisco Bay area, with HMFA brokering this effort in fall 2015, we worked with 3 new fishermen who recovered 200 traps in 6 days, this is in fall 2015. Of those 215 traps belonging to 54 different permit holders and 128 of those traps were returned to the owners, with most of those being purchased back by the original owners and 72 traps were recycled. And then this last fall, again in the San Francisco Bay area, we had our agreement set up with CFABB, working with a couple of their members, they spent just 3 days in the water and retrieved 33 traps, 4 of which were returned to owners but not purchased, and 29 were recycled. You all asked us to list or think about what were our particular successes or challenges. So just listing here, the quantity of gear retrieved, the number of crabs that were released back to the ocean, an estimation of the sea floor that was cleaned up, the numbers of fisherman involved, and this is all right here. But I wanted to focus on the challenge, the fact that our fisherman’s association partners really did not earn funds in selling gear back to original owners as had gone so well in our pilot project. And this was in part because first of all, word kind of got with the fishing community that is wasn’t requirement to pay for the gear, as well there was one effort on the north coast where a huge number of traps were retrieved for a particular fisherman who had unfortunately undergone a family tragedy and had not been able to go out and get his own pots. So this was done by one of our fishermen and the association itself decided not to charge him.
(next slide)
This was kind of how things were going when as you all know, I don’t need to tell you, there was a big up-kick in the last couple of years in the entanglements of large whales in commercial fishing gear off the U.S. West coast. These are figures pulled from NMFS report 2016 West Coast Entanglement Summary. There were 71 whales in 2016 and of those, 33 of 47 where they could identify the gear, the gear was Dungeness crab gear.
(next slide)
So this prompted the Dungeness Crab Task Force to advocate for and work with the state senator to draft Senate Bill 1287, the Whale Protection in Crab Gear Retrieval Act, which was signed by the governor last fall and basically allows the California Department of Fish and Wildlife (CA DFW) to permit gear retrieval and also allows them to require that a fee be charged to permit holders for derelict traps that are recovered. They are in the process of figuring to how to set that fee at a level that allows for being able to cover the cost of the regulatory program and compensate fishermen who recover lost traps. We are currently in the process of helping the CA DFW develop a plan for implementation and the Dungeness Crab Task Force continues to coordinate Dungeness crab working group.
(next slide)
That’s it in a nutshell and I think I hit my 10 minute mark and wanted to leave time for questions, I’m very happy to field those.
Jenna: Thank you so much Kirsten, that was really interesting, really great numbers, good to see. We would like to open it up to anybody on the line ask questions.
Q: Was it determined that most of the entanglements were in derelict gear?
A: Are you talking about the large whale?
Q: Yeah.
A: No. I was just at the Pacific States Marine Fisheries Commission workshop on the particular topic last month. The point we all discussed is that it’s really impossible to know whether the gear the whales are getting entangled in was legally deployed in season and they got tangled in it, and of course the minute it’s on a whale, its derelict, it’s not fishing anymore. It has been difficult to tell that.
Q: But the incentive for the legislation was to allow for permitted recovery, was this prompted by the number of entanglements?
A: I can’t speak for the fishermen, but I do know that first of all, they knew it was the right thing to do because there shouldn’t be a large amount of gear being left in the water by their fishery and I think that there was concern that if they weren’t being proactive about it as a problem, that there was going to be an even higher level of scrutiny on the fishery and so first and foremost, the impetus was to do the right thing. But I think on the background being that there was also a higher level of attention now being paid to fishing gear in the ocean and how it’s impacting marine mammals. I hope that answered the question.
Q: Yeah, I just didn’t know what it was a direct correlation between…
A: It was really more the fact that with the pilot effort that proved to be effective and have so much buy-in from the fleet, that there was an opportunity to do something bigger, more permanent and sustainable.
Q: It looked the removal numbers were decreasing year on year. Is that a function of there being fewer traps on the bottom?
A: Yeah, the trouble with the state over is of course we had the domoic acid closures and significant delay in the opening of the fishery, so there was just not nearly as much gear in the water during the season as in normal years. That’s what we ascribe it to. I think there is also stepped up effort on the part of DFW, their enforcement division, so DFW was also recovering gear which was great. There is a group of fishermen down working out of Half Moon Bay that were also engaged in derelict pot recovery work and so there was some areas that we had worked in the previous year that they had also worked on. But I think that the real issue is that there was not nearly as much gear in the water during the 2015-2016 season.
Q: Thank you and I guess one follow-up, for the gear that you’re pulling up, is there any sense of how long it’s been sitting on the bottom?
A: No, we don’t. Sort of subjectively, we have a sense of whether is was gear from the previous seasons or been out there much longer, depending on how much growth there is on the buoy and the line.
Q: Is there not a year tag on each crab pot?
A: There is, but we don’t record that in our log. So, it would be good bit of information to be collecting going forward for sure.
Great, thank you.
Q: This is Jenna, real quick question. For the whale entanglements, you said you identified 31 out of 47 as Dungeness crab gear…
A: We didn’t, NOAA did, I was just taking the data from their report.
Q: I was just curious what other fisheries you have out there that might be an entanglement issue? I’m not very familiar with the California coast.
A: Well, of course these whales are showing up on our coasts, but they’re not necessarily getting entangled off the California coast. Of course we have big purse-seine fisheries and other trap fisheries, like lobster trap fisheries down in southern California. I can go to my copy of that report and see what they were saying, again, this was West Coast wide. Fishery type: Dungeness crab, gillnets, spot prawns, sable fish, Dungeness crab recreational, spiny lobster fishery were the fishery types they could identify. But by far the most were the Dungeness crab commercial fishery.
Ok, thank you.
Sure.
Any other questions?
Q: I have another question if there is some blank time to fill here.
A: Yes, we have another minute before we switch over so go ahead.
Q: Thank you. One of my challenges with the project we have is the perception of there being a bounty on these traps and the proprietary nature of the fishery. I wondered if you had encountered any of that with the crab fishery – whether they don’t try to lose the gear, but then have to pay to recover it. Just curious if there has been any challenge there. Is it seen as bounty hunt, or begrudging having to pay for their own property.
A: I have heard through the grapevine that there is a certain portion of the fleet is very concerned about us Bill 1287, because they’re concerned about being required to pay for any of their traps that are retrieved, so yes, there is a certain amount of concern and I think that is what the DFW is grappling with as they figure out how they’re going to implement it. But I think it was also the fact that there were fisherman going through the effort of doing gear retrieval and this is all happening outside of the season. When our initial model looked to be going in a good direction in terms of return on investment and making it something that would be somewhat self-sustaining, but in this last go-round, that was not the case and that was in part because there was no requirement that fisherman pay for any of their gear that was retrieved. That was part of the impetus I think behind drafting of the legislation that the Dungeness crab task force advocated for. It doesn’t mean that all crab fisherman were behind that.
Great, thank you so much! I’m going to switch over to Ladd – are you on the line?
Ladd: Thank you guys so much for having me. My name is Ladd Bayliss, I work with the North Carolina Coastal Federation. Today I was going to talk about our lost fishing gear recovery project. This project has gone on since 2014, through various sources of funding. Today, I’m going to focus on our most recent efforts in 2016-2017. But before we get there, just talk through the history briefly.
(next slide)
As I said, this project began back in 2014, with funding from NC Sea Grant and NOAA Marine Debris Program. We basically started this program as a pilot project, we felt we had a lot of concepts to prove and a short time to prove it. So we asked to begin with the basics. We wanted to prove that fishermen could pick up crab pots during the closed period. In North Carolina there is a period in the winter, January 15-Feb 7 where anything left in the water as far as pots go, they are considered illegally set and can therefore be removed. Typically, historically, this is done by marine patrol, which is kind of our marine enforcement body under the Division of Marine Fisheries, which has been efficient as far as anyone can tell, but we believe that if the state would allow agents of the state, as we would call them, i.e. commercial fisherman, to do this work, we would be able to find more pots using both groups. So, with this funding we were able to complete a successful pilot project in the first 2 years, 2014 & 2015 in one part of the state, the northeastern part of North Carolina. After this success we received another round of NOAA Marine Debris Program funding and moved into our second two year set of work.
(next slide)
In 2016, we continued funding and stuck with our pilot area in the northeast part of the state and after the cleanup that occurred in January, we had been working with some politicians in the state government and in the fall of last year, we got news that we had received $100K from the state to continue this pilot program, but on top of the past 3 cleanup seasons, we had the money to expand state-wide.
(next slide)
Before I get into the nuts and bolts of the program and how it works, this is a really good chart to show the background of this project over time. This is a chart that shows how pots, derelict crab pots, have been collected in the state since 2003. As I said before, North Carolina marine patrol is typically responsible for this collection. You can see if you look to the far right column, the total, that number has significantly declined, there’s a declining trend over the years, which is interesting to look at because it basically points to you know, less lost crab pots being in the water, which we attribute mainly to cost. Back in 2003, crab pots were $15/pot, today they are nearly $45/pot. So that increase in cost we believe has led to less fishermen simply leaving their gear out because they would not incur a large financial loss if they did that. The other important part of this that helps to delineate where our program has taken place as the cells that are yellow, they outline the years that this project has been completed. As you can see on the far left column, District 1 which is the northeastern district where the pilot project has occurred for the past four years, obviously it’s been done longer than the rest of the state, which was just competed in that is past January in 2017.
(next slide)
For this program, for the past 4 seasons, we’ve conducted it with basically two components. There is a shoreline cleanup component and then of course the water cleanup. The idea here is to essentially kickoff the project during the no-potting period once the water is closed. Before the watermen get on the water to go and look for pots, we have shoreline cleanups where we get volunteers to go to local popular areas that need cleaning up, as a way to boost the awareness and the engagement of the program outside of the group of fisherman that do the work. Next comes the water cleanup where obviously fishermen go out to retrieve the gear.
(next slide)
This past year in January, the shoreline cleanup as I said, as this project went statewide, we collected over 3.5 tons of gear just on our one-day shoreline cleanup which occurred in 3 different coastal areas in North Carolina. In one day, again, nearly 140 volunteers, which was a great kick-off to the project. As we moved into the water cleanup, we began hiring fisherman as soon as we were sure of our funding in October of last year. The whole point with this cleanup is to let the fishermen decide where their cleanup is going to take place. We obviously have general ideas of where pots are and what areas we need fisherman in and that depends on where we hire fisherman from, but the guiding principle behind this project is that we’re hiring waterman for a reason because of their natal knowledge and inherent knowledge about the waters, the way they move and how that knowledge points them to where most pots end up and can be retrieved. This obviously was an incredible scaling up compared to previous years. The fisherman worked for 2.5 weeks, we hired 72 fisherman whereas past years had been a handful of a dozen. Three districts improved form our three year pilot project of just one district with over a million acres of water covered. We pay fisherman $400/boat/day. We require two fisherman/boat. This year was, as you could see back in the graph that I showed in the beginning, we collected a significant number of pots, over 4000 pots, which is the most that has been collected in over a decade. Again, looking at 2016-2017 numbers, over 35 tons, and about half of that was recycled.
(next slide)
In addition to asking fisherman to simply look for buoyed pots left behind, we have had a side-scan sonar component with money from the NOAA Marine Debris Program, we were able to buy some of these units to give to fisherman. It has been a very interesting piece of this project, difficult in some ways which I will talk about later on. Just so you know, this is one of the technology components that we use to look for pots without buoys that were still on the bottom but not visible from the water’s surface.
(next slide – unable to see)
Another piece of technology that we use, that any of you that are involved in this type of work, if you are looking for some kind of program to help you along in data collection, this has worked really well for us. We have used the Cybertracker program working in conjunction with NC Sea Grant who initially found it. It is a free program that you install on a digital Samsung tablet and it uses the internal GPS of the device and can collect waypoints and any other data that comes from a program that you create in a very simple form and doesn’t require any cell phone signal or Wi-Fi. This program was created in the middle of Africa several years ago to employ native bushmen and give them a career essentially in tracking and translating that local knowledge. So this program has worked really well. As you can see from this map, this free program generates these maps. As you can see, each dot represents a crab pot that was retrieved. So you have great data from the beginning that is all entered and cataloged perfectly as well as tracks. You can obviously see in these different areas, the little lines between the dots is a live GPS track of where each fisherman went to find the pots. It also provides a little bit of accountability as well. As you can a see a closer view.
(next slide – unable to see)
This is the state-wide map for pots that were retrieved this year. As you can see, the previous map covered the depiction of what was found in years past. This is, as you can see, a very large scaling-up of this effort which nearly tripled the amount of pots that we were able to retrieve. Again, each yellow dot represents a crab pot and is difficult to see in areas where there are pots essentially on top of each other.
**At this point, realized that the presentation was not being broadcasted successfully. Ladd finished her presentation orally without visuals**
Question during pause: How many commercial crab fishermen are there in North Carolina?
A: Last time I looked, between 3000-4000, that’s off the top of my head. But again, those are license holders, but not every commercial license is a crabber.
Q: How many pots are they allowed to fish?
A: There aren’t any pot limits in North Carolina currently, so typically there is no requirement when you purchase a commercial license to list how many pots you fish or if you’re going to be using a gillnet or a crab pot. It is very different from other states as there are no pot limits.
Ladd: The average number of pots that were retrieved per boat per district. In the Northern part of the state there is a much greater proportion, by at least two fold, of commercial fisherman, compared to other parts of the state. Because this project has been conducted in that area for the past three years and only expanded state-wide just recently, we basically found very clearly that proportionally, the fishermen in the other two districts were collecting many more pots than our District 1 fisherman because this type of cleanup using fisherman had not occurred ever. We see that as a positive trend. Moving on to the rest of the data we collected using this program. First and foremost, the most important thing we are looking for is waypoint information, where these pots are being pulled so we can gather further information. Prevention moving forward, how we can prevent the loss from occurring. In addition to that, we collected data on the condition of the pot as well as what was inside of the pot. We had about 46% of the pots that we collected did not have any bycatch in them and the majority of crabs that were found in the pots were alive and released. This is depicted in the graphs that you can’t see. Essentially, the successes that we experienced with this project is that technology is important. We experienced that with the Cybertracker program as well as the side-scan sonar to a degree. Again, watermen have inherent knowledge of this type of work that marine patrol agents and the general public don’t have. But when we work with these groups in conjunction - waterman, marine patrol, non-profits, it seems to garner a more successful project. Also, we learned that the state is trying to continue to support this work. Our first round of $100K was not recurring and the legislature is working to make the funding recurring in this session. Some of the challenges, year after year we realize that using the side-scan sonar is difficult with the limited time that we do have. It’s a very great technology but again, but the no-potting period is a very short amount of time comparatively speaking, and the learning curve for the side-scan sonar is pretty high. So we’re trying to find ways to work through that by giving fisherman these units to work with throughout the year. Another challenge, like our first presenter outlined, how do you continually fund this project moving forward, it’s a constant question. Each area of this project is different and it’s hard to manage it moving forward across the state in such different regions. Moving forward, we’re looking at ownership over the long term and how we’re going to make sure that each fisherman continues to get paid and invest in their resource. I’m happy to take any questions right now, sorry that you could not see the rest of my presentation.
Q: Your numbers of recovery are really impressive, I’m just curious what’s the percentage of buoyed vs. unbuoyed pots? You mentioned you started using a Humminbird, which we’re going to end up talking a little bit about, most of our work has used that. Just wanted to hear a little bit more about that and how many of those pots needed to be recovered through those methods vs. buoyed pots.
A: Because of a lot of different factors, mainly weather, the middle of January in North Carolina is often challenging, which makes the use of side-scan sonar difficult. We definitely, by and large, collected more pots with just looking for buoys. The side-scan did not retrieve a large number of pots this year. I can go back and get the number, but it was a handful and we’re using Garmin units this year.
Q: What is the typical depth that you are working in?
A: Up in the northeast, we’re averaging 11 ft. As we move farther south, it’s much shallower, so it’s not a lot of water, but a lot of water movement, if that makes sense.
Jenna: Ladd, thank you so much, we really appreciate it. I’m sorry about the technical difficulties again. Maybe there is a way we can get some of your figures out to the folks that were with us today. We’re going to move on to our last presentation. I’m going to mute the conference. We’re very excited to hear from Dr. Mark Sullivan and Steve Evert from Stockton University about their crab pot removal in New Jersey.
Mark: Great, thanks Jenna. Before we get started, I just wanted to acknowledge the other co-principal investigators that were involved in this project. Of course our commercial crabber partners that we’ve been working with over the last 5-6 years, Stockton University Marine Field Station support, dozens and dozens of undergraduate students have been involved in this project over the last couple of years, and then of course we’d like to acknowledge the generous support from the NOAA Marine Debris Removal Program.
(next slide)
So I think most folks are probably familiar with some of the larger derelict fishing gear projects that have been completed in areas like Chesapeake Bay and the Gulf of Mexico, but sometimes crab pot loss goes undocumented or a little bit underappreciated in smaller estuary systems. Some of the coastal bays that we’ve been working with in southern New Jersey are quite shallow and have a complicated mix of sediment types. Some of these are often muddy or very soft and it’s difficult to pluck some of these pieces of fishing gear out of this sediment type. Most of this loss occurs where recreational boating intersects with commercial and/or recreational crabbing activities. One of the big benefits of this project has been partnering with the commercial crabbing industry. At this point, we’ve recovered upwards of 2200 pots as part of this project.
(next slide)
All of our projects have the same set of objectives so I’ll go through these quickly. Objective 1 is to identify ghost pots with a scientific grade side-scan sonar, map the hot spots that result from that survey, and then create waypoint files that can be transitioned over to our commercial crabber partners. All of our partners are trained on low-cost sonar units, i.e. Humminbirds and other similar systems. And all of our crabber partners are working from their own small vessels, so they tend to be less than 28 feet and they typically don’t have larger A-frames and somewhat limited hauling capacity. Hopefully, in Objective 2, recover ghost pots, identify associated bycatch species, and then recycle/reuse fishable pots and hopefully put some of these pots back in the system for our commercial partners. Objective 3 revolves around constantly trying to maximize the efficiency of our projects, so find ways that we can recover more pots from the water and less time looking for pots. And then the final component of this is educating boaters, recreational and commercial crabbers, as to the various issues surrounding derelict fishing gear and really trying to break the cycle of gear loss so that 5-10 years down the road we don’t have to repeat these recovery efforts again.
(next slide)
Any folks out there that are interested in setting up a similar recovery type project in their own shallow estuary system, we have a couple of steps that we want to share with folks. One is that you have to have a good idea of where the loss is occurring and this can be either commercial or recreational crab pots, but for the most part, most of the loss is occurring around well-traveled waterways, docks, marinas, water-front restaurants, and things of that nature.
(next slide)
But you just can’t go by your intuition so typically you need to do a scientific-grade side-scan sonar survey. This gives you a little bit more confidence in your IDs so that when your commercial crabbers are going out on their recovery efforts, they are targeting actual pots rather than natural debris that might be on the bottom. You always want to have the best position data available so that your commercial crabber partners aren’t spending a lot time looking for the pots. You want to send them out to a waypoint and minimize the amount of time they are spending actually recovering the pots.
(next slide)
Step 3, transfer the waypoints to the low-cost sonar units, Humminbirds, etc.
(next slide)
And of course you have to train your recovery team and preferably you want to work with industry partners. We found this to be a really rewarding aspect of the project over the last 5-7 years. Training involves getting folks familiar with the different pieces of equipment, having preset instruments, limiting the options that are available, spending a good amount of time understanding the imagery so that the commercial partners are able definitively ID crab pots as opposed to some other item that might be on the bottom. And then you also want to end this with on the water training so that everyone gets the sense of issues related to currents and tides and how those can impact recovery efforts.
(next slide)
We’ve really tried to reduce the amount of time that our commercial crabber partners are recording data in the field so anything that you can do to speed up the recovery process and limit the data collection is beneficial. One of the things that we’ve done is we streamlined this to the point where when folks are out in the field, they are taking a photo of the crab pot, a photo of the bycatch and then additional data is typically collected down the road on land, typically by undergraduate students that are involved in the project.
(next slide)
Step 5 is to process your recovered crab pots. We have a crab pot processing day every spring where our commercial partners, scientists, colleagues, volunteers, undergraduate students, get together, disassemble pots that are not going to be put back into the fishery and set aside those pots that are deemed fishable. There’s a nice image at the bottom here of pots that were recovered as part of this effort and are now being deployed back into the fishery with a considerable amount of cost savings involved for the commercial community.
(next slide)
What I’d like to do now is turn things over to Steve Evert and Steve’s going to really get into the nitty gritty about the on the water recovery efforts.
Steve: Thank you Mark and thanks everybody for being with us today, and for Jenna and everybody at NOAA for putting this together.
The derelict gear that we’re talking about here is primarily unbuoyed pots, most of what we’re talking about does have to do with the sonar work, which does present quite a few challenges. But once you get past those challenges, there are some benefits that we’re beginning to realize for the commercial fishermen, which I’ll hit on at the end.
(next slide)
Pretty much all recovery efforts have some common needs. One is that you see, I’d say a strong target, when we’re talking acoustically, we want to be certain that it is a crab pot or a piece of fishing gear, not a piece of sod bank or piece of marsh. There are opportunities in some systems, and I’m sure you’ve seen it in North Carolina and in some of the other states in smaller estuaries, where you do have opportunities with the low tides, blow out tides in the winter, to do some visual surveys, to do some visual recovery of unbuoyed pots that go dry or bare on a low tide. Most of our work has been underwater through sonar recovery. See a target, mark a target. We use a buoy to mark our targets when necessary, and then recover the target. So all of our projects have these common needs.
(next slide)
These are some of the tools that we’ve ended up with. There’s been some modifications over the years for the type of work that we’re doing, for the type of loss that we have in our system. There’s no more valuable tool than the low-cost sonar. We use Humminbird, North Carolina I think you said you’re using Garmin, they’re getting pretty common in the recreational fishing community and they can be pretty valuable instruments. A buoy to mark the target. So when we see a target we will mark it with a buoy. Not much longer line than the water depth you’re working in, and by the way, we’re working in generally 3-4 to maybe 10 ft of water, something like that in most of our areas. Single grapple hooks, literally just a grapple hook, we do bend the hook a little bit vertical than what you get out of the box, with a long amount of line. And then we also use daisy chains of hooks that are rigged through the line. If anybody ends up with questions about this gear, we can talk about it later. We’re more than happy to take calls after today.
(next slide)
See the buoy, whether it’s usually acoustically, mark it with a buoy, so if you see a target at say 10 ft to your starboard side, yell 10 ft or if you see it yourself, throw a buoy. Now you have a visual marker on the surface of the water that is reasonably close to your known target. Some of our partners prefer to use the longer daisy chain method where they’ll circle that buoy. When we hook a pot, usually it just about stops the boat and I’ll talk more about that. Most of our pots are at least in the sediment a few inches if not more. And we’ve also come to start to throw individual grapples. Sometimes we can do that without buoying, especially in dense areas.
(next slide)
So this kind of leads to this, see it and snag it, type of scenario. Best case scenario for a good day of recovery, works especially well in dense areas. Works well with high quality survey data from earlier efforts. Basically we have two grapple hooks ready at the back of the boat, see in the bottom right picture, a grapple hanging there on the transom that has probably 40 feet of line on it. Depending on how many people you’re working with or what you’re boat set-up is, basically you have people ready to throw those grapples. If you are fortunate enough to literally split the pot, which that top left image is just that, where the transducer went directly over top of the target, and you saw it on both sides, you can literally just throw that grapple right off the back and I’d say 7/10 times you’d get it on your first attempt. If its a few feet to the right like the lower image, that is also attainable by just tossing the grapple in that general direction. And I added a little note here, this year in particular we started using a bow mounted transducer, so we took the transducer from a Humminbird, made a basically fold-up wooden, you could do it out of aluminum, whatever, mount that went off of the bow. The advantage of that in doing sonar recovery is that it gives you that 20 ft lead time. So if you’re working out of a 20 ft center consul for instance and you have a bow mounted transducer and you split that pot or come close to splitting that pot, you’re just dropping your grapple hooks off the back and maybe making a little adjustment with the boat or what have you, and that has worked pretty well for us. If anybody wants more information about that, again we’re happy to talk a little bit more after today’s conference, individually.
(next slide)
If we had to sum up some of the keys to our success in recovering these pots using sonar, technique 1 is that we feel it is very important to conduct broad, professional grade side-scan sonar surveys. We do that as the science-side, we do that type of work at Stockton. We’ll spend several days surveying coastal bays and putting together the waypoints and then we do our recoveries at a later date. This helps identify hot spots. If you’re sending commercial partners being paid $300-400 a day to an area that doesn’t have fairly dense pots, they’re going to be looking for an awful long time with a little hummingbird sonar to find a pot. You’ve got to get them good waypoint information to increase that efficiency. Understanding the recovery challenges of some systems. I don’t know if they see this in North Carolina, I suspect they might, but one of the things that we have in these soft sediment systems is our pots are literally in the mud, sometimes a few inches, sometimes half of a pot has vibrated into the soft sediment through storm events. This is especially true of the older legacy pots. Those do not just come right out of the bottom. We’re using small boats, you need to use low speed. If you don’t use these methods, you’re going to end up just ripping through, getting frustrated, not getting the whole pot out of the water. It makes it more difficult, but to truly get the gear out of the water, it’s what needs to be done. That picture in the middle is one of our fisherman towing a pot in a circle to get the sometimes hundred pounds of mud out of the pot before being able to physically bring it on the boat. Now that’s not every pot, but it can be quite a few so it’s important to know that. And as both of the other projects have mentioned, and Mark mentioned earlier, partnering with the commercial community is extremely beneficial. These guys and girls know where the areas of loss likely are, they know what they’re doing on the bay, obviously. We train them on how to use the sonars, we hire them to work on our project. We on our most recent project were paying $350/day for this type of work. But probably one of the best things that has come out of our project and come out of using the sonars is our trained partners, maybe they put in 15-20 days each on the project, they know how to use that Humminbird sonar and as wary of it as they are on Day 1, they love it now because during the season, they’re taking the time to recover probably 80, attempting to recover any of their lost pots and in most cases, recovering about 80% of their lost pots during the season. We believe that is the most effective way 1) to help commercial fisherman by them not losing gear and not losing money, and 2) to break the cycle of lost gear in systems like this. This really hinges on the Humminbird aspect of our work in particular.
(next slide)
Just a couple of things we’ve been able transfer some of these programs to other funded projects in the area. This is just a quick bullet list of some of the benefits. We’ve had two funding cycles through NOAA, kind of a timeline of how we got into all of this. We benefited a lot from the Chesapeake group, Kirk Havens and others. When we first started, we developed a lot of our own techniques, made a lot of partnerships with the fishermen, and there’s some of the numbers. We put about over $60K worth of direct pay or returned gear into relatively small commercial fishing community in south New Jersey, over 2000 pots, other projects, undergraduate research, all sorts of good things have come of this program to date.
(next slide)
This is another thing that’s come from our first project and is being worked on by another group now as well, Jacques Cousteau Reserve, and that’s the WeCrab NJ website. I encourage you to go check that website out, we have some recovery resources on there, videos from our earlier efforts, and that website is actually set to be updated quite a bit in the next little bit and there will be even more recovery resources on that website. Feel free please to reach out to Mark and I if you have questions about working in these types of environments and certainly check out WeCrab and thank you NOAA for today and for the funding. With that, we’ll take any questions.
Jenna: Does anybody have questions for Mark and Steve? I will say that they just had a very successful Earth Day pot processing day where they went through about 600 pots and were able to recycle about 50-55 of them and got a lot students and everything involved. Really great, good successful event. If there are no questions right now, I want to thank all of our presenters for joining us today and we really appreciate you taking the time to share your projects with us. We will be planning to hold another Marine Debris Program webinar probably in the fall to talk about prevention projects. Thank you all for joining, have a great afternoon.

TRASH TALK: What is the Great Pacific Garbage Patch?

It’s not a floating island of trash, like a garbage dump or a landfill. It’s also not the only patch. They exist all throughout the ocean, and the Pacific Garbage Patch just happens to be the most famous. Garbage patches are large areas of marine debris concentration that are formed by rotating ocean currents called gyres - kind of like big whirlpools that suck things in. A garbage patch is made up of tiny plastic pieces called “microplastics” that are less than 5 millimeters long. It’s more like pepper flakes swirling in a soup than something you can skim off the surface.

First Place Winner: 2017 "Communicating for a Clean Future" Ohio PSA Competition

This video is the first place winner for the 2017 "Communicating for a Clean Future" Ohio Marine Debris Challenge. This competition invited students from Ohio's Lake Erie coastal communities to create public service announcements to bring awareness to the issue of marine debris.

Video Transcript

Imagine you are swimming at Cedar Point beach. Imagine the water is smooth against your skin and the sun is warm on your face .
Now imagine this is what you have to swim in. This is an example of the unfortunate reality of marine debris and pollution.
Over 1 million sea birds and mammals are killed each year at the expense of laziness of human beings.
An estimated 14 billion pounds of garbage and debris have been dumped into the Earth's oceans and waterways
Our Earth is irreplaceable , and it is not only the possibility, but the responsibility for every individual to be capable of maintaining our world.
The residents of Ohio are gifted with an extraordinary state with a magnitude of natural beauties.
Dispose of your garbage properly and recycle if possible. No action can be considered too small in protecting our marine environment, the world's value is immeasurable.
Only you can prevent marine debris and pollution Reduce, Reuse, and recycle.

Second Place Winner: 2017 "Communicating for a Clean Future" Ohio PSA Competition

This video is the second place winner for the 2017 "Communicating for a Clean Future" Ohio Marine Debris Challenge. This competition invited students from Ohio's Lake Erie coastal communities to create public service announcements to bring awareness to the issue of marine debris.

Video Transcript

Marine debris causes wild life entanglement and ingestion, economic costs, and habitat damage.
Many animals, such as sea turtles. seabirds. and marine mammal s have been known to ingest marine debris. Debris ingestion may lead to loss of nutrition, internal injury, intestinal blockage, starvation, and even death.
It can scour, break, smother, and otherwise damage important marine habitats. Many habitats serve as the basis of marine ecosystems and are critical to the survival of many other species.
Marine debris is defined as any persistent solid material that is disposed of or abandoned into the marine environment or the Great Lakes.
There is no part of the world that is unaffected by marine debris, however it is preventable.
Get involved in local cleanups and encourage your community to help stop marine debris. You can also help by bringing reusable items instead of disposable ones to the beach. Keep the sidewalks, streets, and gutters free of trash because they empty into our Great Lakes.

First Place: 2016 “Communicating for a Clean Future” Marine Debris PSA Competition

This video was the first place winner for the 2016 “Communicating for a Clean Future” Marine Debris Public Service Announcement Competition in Ohio's 9th Congressional District.

Video Transcript

Marine Debris - what is it?
Marine debris is any man made solid material that is released in a lake, sea, ocean or waterway, deliberately or accidentally.
It can be something as simple as a discarded soda can, a cigarette butt, or a plastic bag; which are potentially harmful to marine life.
It affects things from the environment to the economy, from fishing and navigation, to human health and safety.
There are many ways to reduce marine debris, and there are many alternatives to items to use, but you can easily begin by following three main rules...
Reduce
Reuse
Recycle

DOC Talks: What We Can Do About Marine Debris

Join Krista Stegemann, the NOAA Marine Debris Program's Communications and Education Specialist, as she talks about marine debris at the first "DOC Talks" for the Department of Commerce. This 10-minute video gives an overview of what marine debris is, where it comes from, and what we're doing about it.

Our Debris Filling the Sea

What do a tropical island in the Pacific Ocean and the Antarctic have in common? Unfortunately, it's marine debris. Even the most remote locations on Earth are fouled by man-made garbage and cast-outs. And a majority of the debris that's found comes from land-based sources.

Ocean Today is an interactive exhibit that plays short videos on ocean related themes.
Visitors can select from 150+ videos on topics ranging from deep-­‐sea exploration, marine species, and restoration projects to hurricanes, oceans and human health, and
climate science and research. These videos are a free resource and are available on our
website at oceantoday.noaa.gov.

What is Marine Debris?

Did you know that 52 metric tons of marine debris accumulate on uninhabited islands around the world? Marine debris is trash in the ocean that animals may confuse with food or plants. Seals get tangled in old nets and can die, turtles eat plastic bags hoping for a tasty jellyfish and can drown. Watch this video to see how NOAA is leading the way to minimize marine debris and find out what you can do to help marine animals and our oceans!

Marine Debris

Marine debris is the trash that eventually enters the ocean. It includes trash on the beach and trash that you can't see that is floating in the ocean. It is a big problem. The NOAA Marine Debris Program is working to tackle this problem that can harm marine mammals and sea turtles. What will you do to help?

"Marine Debris" is just one of many exciting videos on The Ocean Today Kiosk. For full effect, visit the Ocean Today Kiosk at the Smithsonian Institution's Sant Ocean Hall or at an aquarium near you.

TRASH TALK: Impacts of Marine Debris

Would you want to swim at a beach littered with trash? Of course not. And the animals who live in the ocean don't either - the difference is they don't have a choice.
Marine species often become tangled in debris, from fishing nets to six-pack rings and many mistake plastic debris for food, and eat it. This fills their stomachs with junk they can't digest.Debris can also damage important habitats, like coral reefs, by breaking or smothering them. Corals serve as the base of the marine ecosystem, and impacts here can be felt all the way to you and me. Let's prevent those impacts on wildlife. We need the ocean - and everything in it. And the ocean needs us to keep it free of debris.

TRASH TALK Webinar for Educators

This webinar provides fun activities that you can organize to engage people in museums, zoos, aquariums, learning centers and schools.
Featuring NOAA Marine Debris Program Educational Specialist Leah Henry, this fun and informative ten minute webinar provides a quick demonstration of hands on activities you can easily offer after you show any TRASH TALK videos.

TRASH TALK: What Can We Do About Marine Debris?

There are marine debris solutions, and together, we can prevent litter from ending up in the ocean. So what can we do? Well, the ultimate solution is prevention, and we need to keep that as our highest priority. We can reduce, reuse, and recycle to keep debris out of the ocean in the first place. You can bring your own shopping bag, drink out of a reusable bottle, and participate in things like a shoreline cleanup. Join a group cleaning the beach, or grab some friends and clean up your street! It's easy.

TRASH TALK: Marine Debris and Plastics

The 5 most common items found during the International Coastal Cleanup are plastic cigarette butts, food wrappers, plastic beverage bottles, plastic bottle caps, and plastic straws & drink stirrers. Notice anything in common with those things? It's a lot of single-use, disposable plastic.

TRASH TALK: Where Does Marine Debris Come From?

Marine debris comes from many different sources and enters the ocean in many ways. Intentional littering and dumping are a big cause of marine debris. Sometimes the trash goes directly into the ocean, like when beachgoers don’t pick up after themselves. Or sometimes, marine debris is indirectly generated in a city hundreds of miles from the ocean.

TRASH TALK: What is Marine Debris?

Marine debris is one of the biggest pollution problems facing the world's oceans and waterways today.
Marine debris is any man-made, solid material that enters waterways directly through littering or indirectly via rivers, streams and storm drains. Marine debris can be simple items such as a discarded soda can, cigarette butt, or plastic bag that ends up in the ocean potentially harming marine life. What this video to find out more and share it with others.

1 of 40