We've just launched Vizpresso – a visual way to consume interesting facts and news! Find your inspiration here


No complex design software. No heavy designer fees.
Just a simple, intuitive tool that helps you and your team tell stories with the visual impact they deserve.


Go ahead, be picky - there are plenty of ways to make your story speak louder than words.
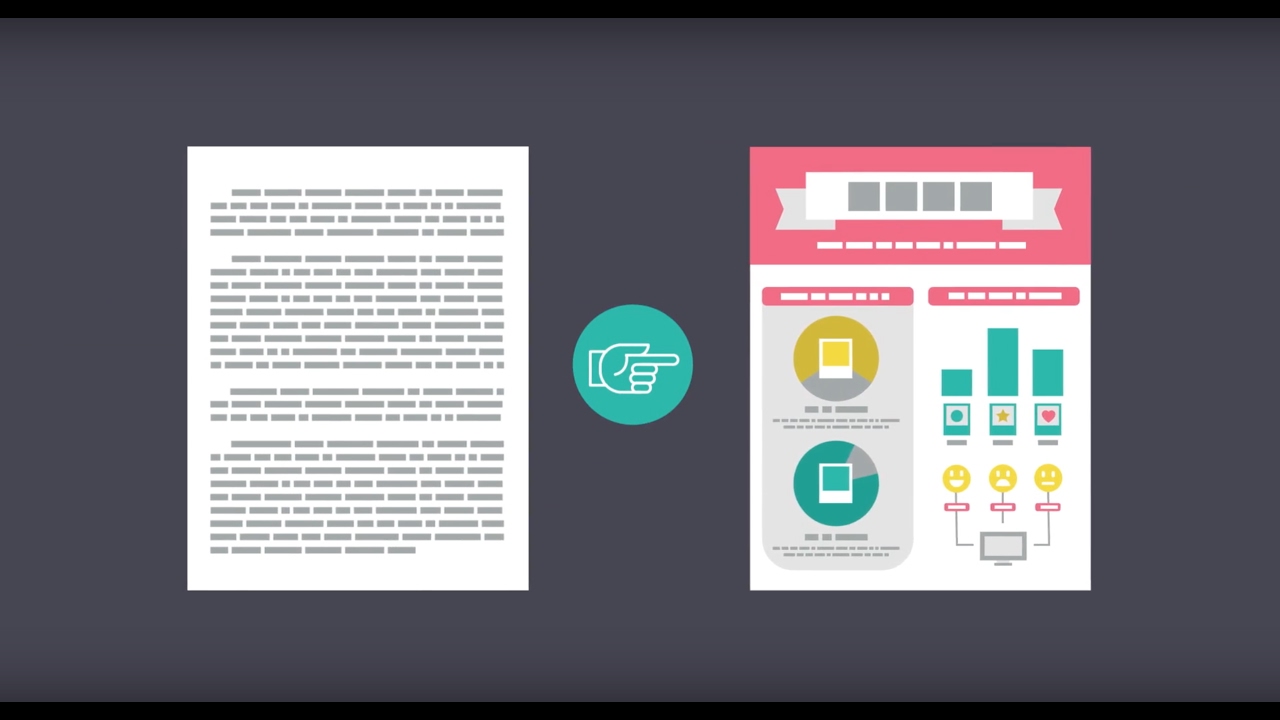
Your data contains stories worth telling, but spreadsheets rarely create connection with anyone. Now, there’s a better way.
Too many good points get drowned in a sea of bad slides. This is Presentations — like you’ve never delivered them before.
Create posters, flyers, reports. Then ship ‘em off to the printers and out into the hands of the people who matter to you.


Our talented designers work hard to make it easy.
 Conference Poster
 Business Presentation
 Annual Overview
 Meeting Agenda
 SWOT Analysis
 Pitch Deck
 Promotion Flyer
 Checklist Infographic
 Sales Flyer
 Financial Presentation
 Data Infographic
 Creative Presentation
 Product Flyer
 Product Presentation
 Party Flyer
 Marketing Plan
 Holiday Poster
 Sales Presentation
 Minimalist Infographic


Step 1
Choose from a library of over 800 professionally designed infographic, presentation, and print templates. Wherever your ideas take you, you might just get there faster with our ready-made designs.


Step 2
Add beautiful interactive charts, animated icons, images, and videos. Edit fonts. Change colors. Move things around. It's design on your terms - right from within our intuitive drag-and-drop editor.


Step 3
Put your visual work out for the virtual world to see. Print it. Share it directly to your social media accounts, or password-protect it for sharing with clients and colleagues. Whoever you want to reach, we want everything you touch to delight each life it touches.


Bring your team members into one single location. Share your visual work, your brand assets, and review your peers’ work on the fly. With Piktochart for Teams, everyone’s on the same page. Finally.

 Meet Piktochart for Teams
Watch how small businesses like Aussie Mum Network craft stories that foster meaningful connections with their customers.
Watch how NGOs like Techgirlz empower girls to become future technology leaders with Piktochart.
Watch how large companies like Booking.com make their team communications better with Piktochart.
Watch how innovative teachers like Rachelle use visual learning to spark creativity and engagement in the classroom.
Watch how a 66 year-old organization like PRIA uses Piktochart to tell its rich story with greater emotional impact.


