Coal
Current Issues & Trends See more ›


Recent Data
| Coal commodity regions | Week ending | ||||
|---|---|---|---|---|---|
| Central Appalachia 12,500 Btu, 1.2 SO2 |
|||||
| Northern Appalachia 13,000 Btu, < 3.0 SO2 |
|||||
| Illinois Basin 11,800 Btu, 5.0 SO2 |
|||||
| Powder River Basin 8,800 Btu, 0.8 SO2 |
|||||
| Uinta Basin 11,700 Btu, 0.8 SO2 |
|||||
| Source: With permission, Coal Markets | |||||
Updated Data Series
- Overview of consumption, production, and exports
- Net generation for coal, monthly
- Consumption of coal for electricity generation by sector
Survey Forms, Changes & Announcements
Recent Analysis & Projections

Coal Markets
Released January 23, 2017 inventories/stocksmost popularpricesproduction/supplyrecurringspot pricesweekly-
Weekly Coal Production
Released January 19, 2017 most popularproduction/supplyrecurringstatesweekly -
Annual Coal Report
Released November 03, 2016 annualconsumption/demandenvironmentexports/importsindustrialinventories/stocksminingmost popularpricesproduction/supplyrecurringreserves -
Quarterly Coal Distribution
Released August 17, 2016 exports/importsmost popularquarterlyrailrecurring
See more analysis & projections ›
Upcoming Releases
Release days may change on weeks with Federal holidays.
*Coal Markets: 5:00 p.m. ET, Monday (* Formerly Weekly NYMEX Coal Futures and Coal News & Markets)
Weekly Coal Production: 5:00 p.m. ET, Thursday
Interactive Visualizations, Data, & Multimedia
- Coal Data Browser
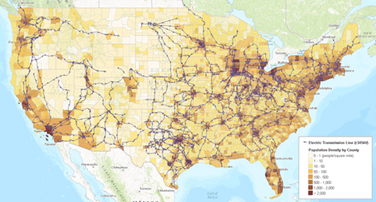
- U.S. Coal Infrastructure Map
- U.S. Fossil Fuel Resourse Map
- U.S. Energy Disruptions Map
-
STEO
Data Browser -
AEO
Table Browser