|
Download Data (XLS File) |
|
||||||||
|
||||||||
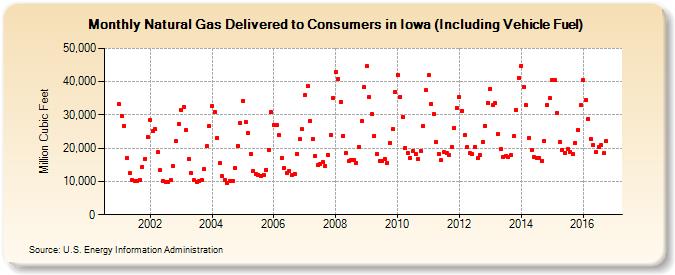
| Natural Gas Delivered to Consumers in Iowa (Including Vehicle Fuel) (Million Cubic Feet) | ||||||||
| Year | Jan | Feb | Mar | Apr | May | Jun | Jul | Aug | Sep | Oct | Nov | Dec |
|---|---|---|---|---|---|---|---|---|---|---|---|---|
| 2001 | 33,183 | 29,626 | 26,788 | 17,172 | 12,430 | 10,449 | 10,249 | 10,177 | 10,494 | 14,476 | 16,865 | 23,400 |
| 2002 | 28,527 | 25,072 | 25,693 | 18,706 | 13,413 | 10,076 | 9,731 | 9,815 | 10,403 | 14,561 | 22,219 | 27,225 |
| 2003 | 31,445 | 32,450 | 25,482 | 16,870 | 12,421 | 10,288 | 9,892 | 10,030 | 10,550 | 13,644 | 20,542 | 26,599 |
| 2004 | 32,639 | 30,955 | 23,081 | 15,569 | 11,543 | 10,481 | 9,546 | 10,080 | 10,193 | 14,132 | 20,759 | 27,591 |
| 2005 | 34,272 | 27,838 | 24,671 | 18,370 | 13,180 | 12,206 | 11,888 | 11,542 | 11,838 | 13,551 | 19,595 | 30,763 |
| 2006 | 26,997 | 26,909 | 23,941 | 17,158 | 14,088 | 12,588 | 13,244 | 11,886 | 12,277 | 18,360 | 22,732 | 25,747 |
| 2007 | 35,848 | 38,728 | 28,204 | 22,726 | 17,742 | 14,922 | 15,363 | 15,754 | 14,595 | 18,051 | 24,001 | 35,021 |
| 2008 | 42,753 | 40,871 | 33,999 | 23,807 | 18,581 | 16,140 | 16,565 | 16,382 | 15,563 | 20,496 | 28,090 | 38,424 |
| 2009 | 44,565 | 35,347 | 30,286 | 23,799 | 18,262 | 16,195 | 16,111 | 16,749 | 15,604 | 21,636 | 25,748 | 37,038 |
| 2010 | 42,120 | 35,470 | 29,344 | 19,989 | 18,557 | 17,079 | 19,054 | 18,316 | 16,766 | 19,194 | 26,732 | 37,412 |
| 2011 | 41,922 | 33,359 | 30,262 | 21,892 | 18,333 | 16,326 | 18,839 | 18,406 | 17,910 | 20,451 | 26,192 | 32,208 |
| 2012 | 35,325 | 31,279 | 23,887 | 20,339 | 18,483 | 18,190 | 20,467 | 16,924 | 17,830 | 21,917 | 26,812 | 33,585 |
| 2013 | 37,938 | 32,944 | 33,515 | 24,292 | 19,705 | 17,302 | 17,637 | 17,200 | 17,832 | 23,586 | 31,615 | 41,177 |
| 2014 | 44,798 | 38,406 | 32,877 | 23,136 | 19,546 | 17,262 | 16,980 | 17,116 | 16,247 | 22,297 | 33,053 | 34,956 |
| 2015 | 40,462 | 40,554 | 30,517 | 21,913 | 19,581 | 18,577 | 19,651 | 18,908 | 18,212 | 21,652 | 25,435 | 32,862 |
| 2016 | 40,532 | 34,426 | 28,787 | 22,807 | 21,011 | 18,931 | 20,344 | 20,865 | 18,465 | 22,145 | ||
| - = No Data Reported; -- = Not Applicable; NA = Not Available; W = Withheld to avoid disclosure of individual company data. |
| Release Date: 12/30/2016 |
| Next Release Date: 01/31/2017 |