|
Download Data (XLS File) |
|
||||||||
|
||||||||
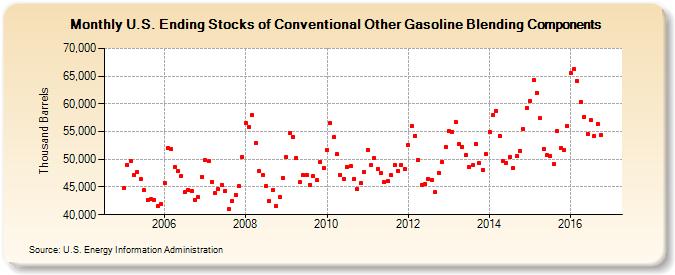
| U.S. Ending Stocks of Conventional Other Gasoline Blending Components (Thousand Barrels) | ||||||||
| Year | Jan | Feb | Mar | Apr | May | Jun | Jul | Aug | Sep | Oct | Nov | Dec |
|---|---|---|---|---|---|---|---|---|---|---|---|---|
| 2005 | 44,743 | 48,977 | 49,646 | 47,075 | 47,690 | 46,427 | 44,385 | 42,714 | 42,773 | 42,691 | 41,503 | 41,878 |
| 2006 | 45,765 | 51,974 | 51,886 | 48,645 | 47,879 | 47,040 | 44,051 | 44,488 | 44,294 | 42,724 | 43,152 | 46,886 |
| 2007 | 49,843 | 49,620 | 45,963 | 43,877 | 44,556 | 45,380 | 44,314 | 40,968 | 42,520 | 43,517 | 45,151 | 50,420 |
| 2008 | 56,527 | 55,871 | 58,016 | 52,865 | 47,860 | 47,205 | 45,118 | 42,410 | 44,498 | 41,565 | 43,171 | 46,624 |
| 2009 | 50,367 | 54,756 | 54,010 | 50,265 | 45,855 | 47,134 | 47,219 | 45,410 | 46,894 | 46,193 | 49,525 | 48,385 |
| 2010 | 51,759 | 56,519 | 53,943 | 50,867 | 47,241 | 46,453 | 48,689 | 48,775 | 46,480 | 44,568 | 45,669 | 47,699 |
| 2011 | 51,744 | 48,887 | 50,317 | 48,260 | 47,498 | 45,833 | 46,052 | 47,097 | 48,903 | 47,955 | 49,011 | 48,276 |
| 2012 | 52,601 | 56,079 | 54,259 | 49,951 | 45,439 | 45,555 | 46,529 | 46,248 | 44,016 | 47,586 | 49,589 | 52,247 |
| 2013 | 55,051 | 54,940 | 56,760 | 52,750 | 52,278 | 50,768 | 48,596 | 48,891 | 52,795 | 49,251 | 48,121 | 50,933 |
| 2014 | 54,970 | 58,043 | 58,735 | 54,266 | 49,672 | 49,347 | 50,449 | 48,450 | 50,543 | 51,501 | 55,372 | 59,316 |
| 2015 | 60,566 | 64,293 | 62,031 | 57,356 | 51,929 | 50,743 | 50,552 | 49,121 | 55,139 | 52,004 | 51,683 | 56,064 |
| 2016 | 65,585 | 66,201 | 64,106 | 60,412 | 57,652 | 54,588 | 57,038 | 54,167 | 56,431 | 54,332 | ||
| - = No Data Reported; -- = Not Applicable; NA = Not Available; W = Withheld to avoid disclosure of individual company data. |
| Release Date: 12/30/2016 |
| Next Release Date: 1/31/2017 |