|
Download Data (XLS File) |
|
||||||||
|
||||||||
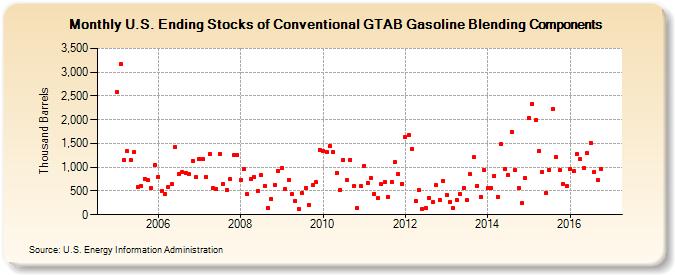
| U.S. Ending Stocks of Conventional GTAB Gasoline Blending Components (Thousand Barrels) | ||||||||
| Year | Jan | Feb | Mar | Apr | May | Jun | Jul | Aug | Sep | Oct | Nov | Dec |
|---|---|---|---|---|---|---|---|---|---|---|---|---|
| 2005 | 2,581 | 3,171 | 1,148 | 1,332 | 1,149 | 1,321 | 583 | 605 | 759 | 736 | 561 | 1,044 |
| 2006 | 799 | 506 | 438 | 582 | 636 | 1,415 | 855 | 903 | 888 | 855 | 1,139 | 788 |
| 2007 | 1,178 | 1,164 | 796 | 1,277 | 561 | 536 | 1,288 | 649 | 520 | 751 | 1,250 | 1,253 |
| 2008 | 727 | 966 | 426 | 744 | 795 | 503 | 828 | 611 | 143 | 334 | 626 | 930 |
| 2009 | 981 | 542 | 735 | 431 | 293 | 120 | 460 | 566 | 213 | 622 | 680 | 1,371 |
| 2010 | 1,348 | 1,316 | 1,437 | 1,322 | 880 | 529 | 1,154 | 721 | 1,161 | 604 | 139 | 602 |
| 2011 | 1,032 | 675 | 768 | 442 | 344 | 636 | 693 | 373 | 693 | 1,107 | 858 | 648 |
| 2012 | 1,636 | 1,667 | 1,388 | 292 | 519 | 125 | 143 | 351 | 258 | 618 | 300 | 717 |
| 2013 | 421 | 264 | 131 | 316 | 436 | 556 | 300 | 849 | 1,208 | 613 | 380 | 939 |
| 2014 | 557 | 558 | 820 | 381 | 1,478 | 952 | 835 | 1,742 | 931 | 566 | 243 | 775 |
| 2015 | 2,040 | 2,336 | 1,983 | 1,342 | 900 | 447 | 949 | 2,224 | 1,205 | 936 | 646 | 596 |
| 2016 | 952 | 912 | 1,277 | 1,163 | 984 | 1,297 | 1,516 | 892 | 730 | 962 | ||
| - = No Data Reported; -- = Not Applicable; NA = Not Available; W = Withheld to avoid disclosure of individual company data. |
| Release Date: 12/30/2016 |
| Next Release Date: 1/31/2017 |