Maps
Overview & General
- Interactive maps with energy infrastructure and real-time storm tracking
- Historical Disruption reports
- Gulf of Mexico Fact Sheet
Flood Vulnerability Assessment Map - Interactive map that includes flood hazard information from FEMA as well as energy infrastructure layers.
U.S. Climate Zones for 2003 Commercial Buildings Energy Consumption Survey (CBECS)
State Energy Profile Maps | Map Details and Data
- Federal lands
- Market hubs: NGL and natural gas
- Oil/gas refining and processing
- Oil and gas wells
- Pipelines and electric transmission
- Power plants
- Resources: coal, oil and gas, shale, tight gas, biomass, geothermal, photovotaic solar, wind
- Storage
- Waterborne transport: petroleum ports, waterways, and LNG import/export terminals
Coal
Asia coal consumption by country, 1980-2010 (animation)
Asia coal production by country, 1980-2010 (animation)
Coal-Producing Counties Map, Kentucky
Coal-Producing Counties Map, West Virginia
Coal Production by Coal-Producing Region, 2011
Electric Power Sector Consumption of Coal by Census Region, 2010
International coal production (animation)
Top Coal Producing States, 2010
World coal consumption by region 1980-2010 (animation)
World coal production by region 1980-2010 (animation)
Electricity & Nuclear
Annual net power flows among regions in North America, 2010
Independent System Operators (Electricity Transmission)
Map of Electricity Restructuring by State
North American Electric Reliability Corporation (NERC) Regions
Selected Wholesale Electricity and Natural Gas Pricing Locations
Oil and Gas
Barnett Shale production (animation)
Low Permeability Oil and Gas Plays (interactive) - major tight oil and shale gas plays in lower 48 States
Detailed oil and gas field maps
Eagle Ford shale drilling and production (animation)
Liquid fuels production in Middle Eastern and North African countries
Map of reformulated gasoline areas
Marcellus area spot natural gas trading points
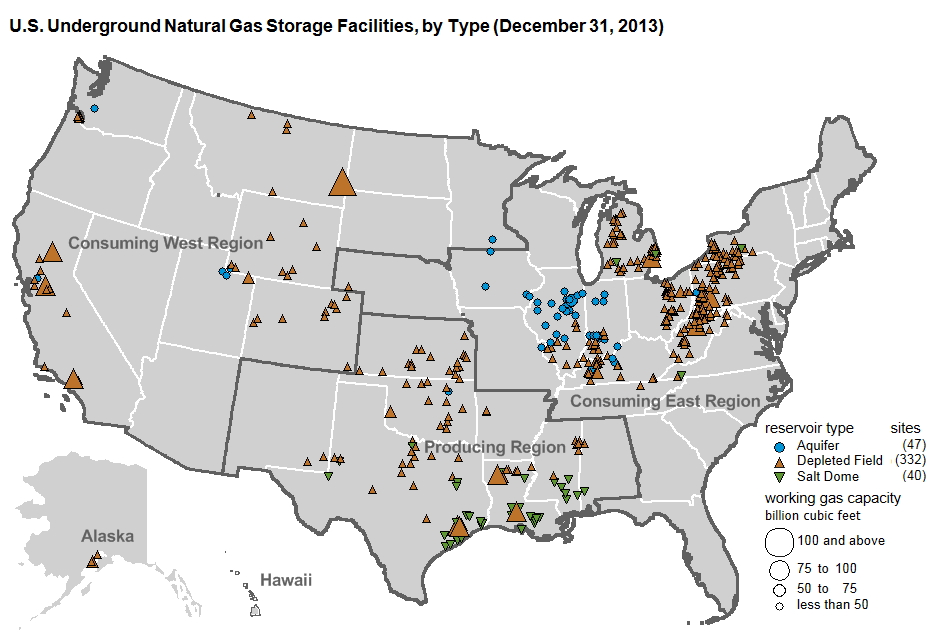
Underground natural gas storage facilities
PDFMarketed production of natural gas in the United States and
the Gulf of Mexico, 2009
National Petroleum Reserve – Alaska
Natural gas deliveries to the electric sector
PDF natural gas market centers
Natural gas pipeline/transportation maps
Natural gas production in Middle Eastern and North African countries
PDFOil and gas fields in the Gulf of Mexico federal offshore
Oil and gas related exploration, resources, reserves, and production
Oil production in Bakken shale play from 1985-2010 (animation)
Petroleum Administration for Defense District (PADD)
Regional gasoline price differences
Resource basins in the Arctic Circle region
Selected wholesale electricity and natural gas pricing locations
Top crude oil producing states
U. S. natural gas deliveries per capita by state and sector, 2010
PDFU.S. Crude Oil, Natural Gas, and Natural Gas Liquids Reserves Summary,
2008
Maps of Selected State Subdivisions
U.S. residential natural gas prices by state
World shale gas map (Map of 95 major basins in 42 countries)
Renewable
Concentrating solar resources of the U. S.
Photovoltaic resources of the U. S.
“Ring of Fire” map shows that volcanic activity occurs around the Pacific Rim
State rankings for geothermal power
State Renewable Electricity Profiles
States with renewable portfolio standards, mandates, or goals, 2010
U.S. Energy Mapping System

Energy Disruptions