|
Download Data (XLS File) |
|
||||||||
|
||||||||
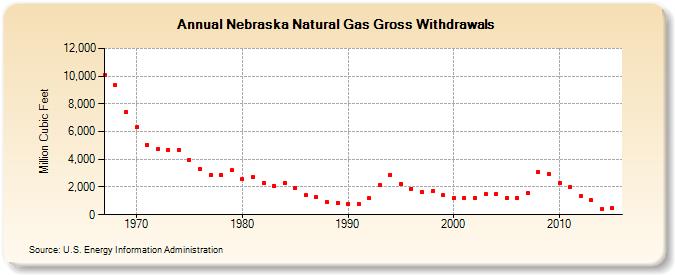
| Nebraska Natural Gas Gross Withdrawals (Million Cubic Feet) | ||||||||
| Decade | Year-0 | Year-1 | Year-2 | Year-3 | Year-4 | Year-5 | Year-6 | Year-7 | Year-8 | Year-9 |
|---|---|---|---|---|---|---|---|---|---|---|
| 1960's | 10,082 | 9,329 | 7,416 | |||||||
| 1970's | 6,309 | 5,054 | 4,741 | 4,670 | 4,675 | 3,963 | 3,308 | 2,849 | 2,882 | 3,208 |
| 1980's | 2,550 | 2,713 | 2,280 | 2,091 | 2,300 | 1,944 | 1,403 | 1,261 | 910 | 878 |
| 1990's | 793 | 784 | 1,177 | 2,114 | 2,898 | 2,240 | 1,876 | 1,670 | 1,695 | 1,395 |
| 2000's | 1,218 | 1,208 | 1,193 | 1,466 | 1,499 | 1,201 | 1,217 | 1,560 | 3,083 | 2,916 |
| 2010's | 2,255 | 1,980 | 1,328 | 1,032 | 417 | 477 |
| - = No Data Reported; -- = Not Applicable; NA = Not Available; W = Withheld to avoid disclosure of individual company data. |
| Release Date: 12/30/2016 |
| Next Release Date: 01/31/2017 |