Fact Sheet | Hispanic Women | January 2012
Workplace Injuries, Illnesses, and Fatalities to Women of Hispanic or Latino Ethnicity
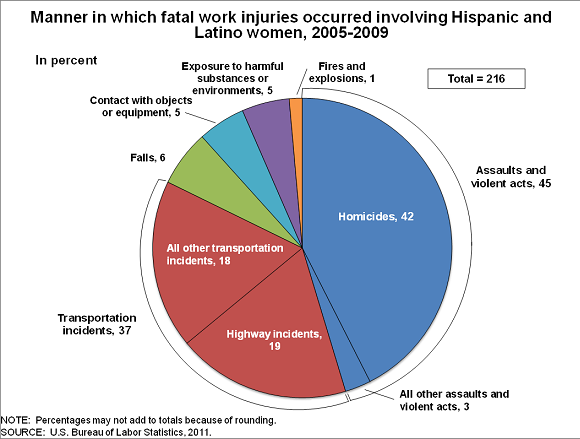
From 2005 through 2009, a total of 216 Hispanic or Latino1 women were
fatally injured on the job--an average of 43 fatal injuries per year. Over the same period, Hispanic or Latino
women accounted for 11 percent of all fatal occupational injuries incurred by women, roughly the same as Hispanic
women’s share of all women’s employment. Fatal work injuries to Hispanic or Latino men have declined 29 percent
since 2006, while fatal work injuries among Hispanic or Latino women have remained at about the same level.
Of the 216 fatal work injuries involving Hispanic or Latino women from 2005 to 2009, 116 (or 54 percent) involved
women who were born in a country other than the United States. From 2005 to 2009, the states with the greatest
numbers of fatal injuries involving Hispanic or Latino women were California (23 percent of fatal injuries to
Hispanic or Latino women), Texas (15 percent), and Florida (8 percent).
In 2009, Hispanic or Latino women incurred 37,310 nonfatal injuries and illnesses requiring days away from
work, accounting for 30 percent of injuries to Hispanic or Latino2 workers
and 4 percent of all private industry injuries. Ten percent of all women workers who incurred occupational injuries
and illnesses were Hispanic or Latino. Injuries to Hispanic or Latino women occurred primarily in the health and
social assistance (28 percent) and leisure and hospitality industries (20 percent) in 2009.
Fatal injury data reported are for all ownerships (private sector, state, local, and federal government),
whereas nonfatal injury and illness data are for private industry only, so data are not directly comparable.
By occupation
The occupation groups with the highest number of fatal work injuries incurred by Hispanic or Latino women from
2005 to 2009 were sales and related occupations (19 percent of Hispanic or Latino women fatalities), office and
administrative support occupations (13 percent), building and grounds cleaning and maintenance occupations
(11 percent), and fishing and forestry occupations (11 percent). Over the same period, Hispanic or Latino women
recorded a higher percentage of fatalities in sales and related occupations, building and grounds cleaning and
maintenance occupations (especially building cleaning workers), and farming, fishing and forestry occupations
(especially agricultural workers) than non-Hispanic or Latino women.
Of the nonfatal injuries and illnesses that were incurred by Hispanic or Latino women, 19 percent were to workers
in building and grounds cleaning and maintenance occupations in 2009. (See chart below.) Within that occupational
group, Hispanic or Latino women who were maids and housekeepers accounted for 57 percent of the injuries.

The occupations with the most injuries, illnesses, or fatalities incurred by Hispanic or Latino women are
similar to the occupation groups in which they account for a large portion of the workforce.
By event
Homicides accounted for about 40 percent of fatal work injuries to Hispanic or Latino women from 2005
to 2009 (this compares with 24 percent for non-Hispanic or Latino women for the same period). Fatal
highway incidents accounted for another 19 percent of fatal work injuries and 10 percent of fatalities
involved pedestrians who were struck by vehicles or mobile equipment (See chart below).
Overexertion was a leading event or exposure accounting for 23 percent of the nonfatal injuries and illnesses
to Hispanic or Latino women in 2009. Falls on the same level accounted for 19 percent and being struck by
object or equipment accounted for 12 percent.
PDF file of this Fact Sheet
Last Modified Date: January 26, 2012