Southeast Information Office
Select area on the map:
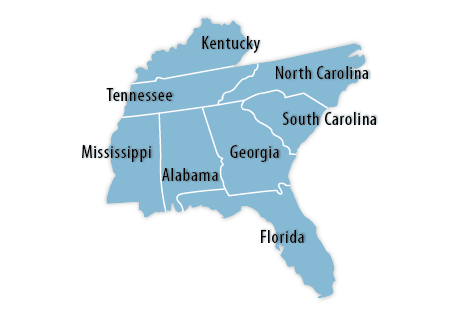
Click a state from the map or pick a state from the list:
Alabama | Florida | Georgia | Kentucky | Mississippi | North Carolina | South Carolina | Tennessee

Economic Summaries:
Economic Summaries are specialized products that combine data graphically from subjects such as unemployment, inflation, and wages into a single document for selected metropolitan areas. To view a specific area in this region, use the dropdown list below or click here.
News Releases:
Consumer Price Index, South Region – December 2016
The Consumer Price Index for All Urban Consumers (CPI-U) for the South inched up 0.1 percent in December, the U.S. Bureau of Labor Statistics reported today.
Consumer Price Index, Cincinnati-Hamilton — Second Half 2016
The Consumer Price Index for All Urban Consumers (CPI-U) in the Cincinnati-Hamilton area increased 1.9 percent from the second half of 2015 to the second half of 2016.
Consumer Price Index, Atlanta – December 2016
The Consumer Price Index for All Urban Consumers (CPI-U) for Atlanta declined 0.4 percent over the November-December pricing period.
Consumer Price Index, Miami-Fort Lauderdale – December 2016
The Consumer Price Index for All Urban Consumers (CPI-U) for Miami was up 0.8 percent over the November-December pricing period.
Consumer Price Index for Tampa-St. Petersburg-Clearwater – Second Half 2016
The Consumer Price Index for All Urban Consumers (CPI-U) in the Tampa-St. Petersburg-Clearwater area rose 1.8 percent from the second half of 2015 to the second half of 2016.