Highest and Lowest Paying Occupations
Highest and Lowest Paying Occupations
Here you will find the most recent annual averages for the highest and lowest paying occupations, including number of people employed by sex (full-time), gender shares of employment by occupation, median weekly earnings, and women’s earnings as a percentage of men’s. This page is updated annually; sign up to receive e-mail alerts when new or updated content is available.
Highest Paying Occupations (both sexes)
Chart 1

Text Version of 25 Highest paying occupations by median weekly earnings, 2014 annual averages.
Chart 2

Text Version of 25 Highest paying occupations by number of people employed, 2014 annual averages.
Chart 3

Text Version of 25 Highest paying occupations by number of people employed, 2014 annual averages.
Highest Paying Occupations for Women
Chart 4

Text Version of 25 Highest paying occupations by number of people employed, 2014 annual averages.
Chart 5

Text Version of 25 Highest paying occupations by number of people employed, 2014 annual averages.
Chart 6

Lowest Paying Occupations for Women
Chart 7
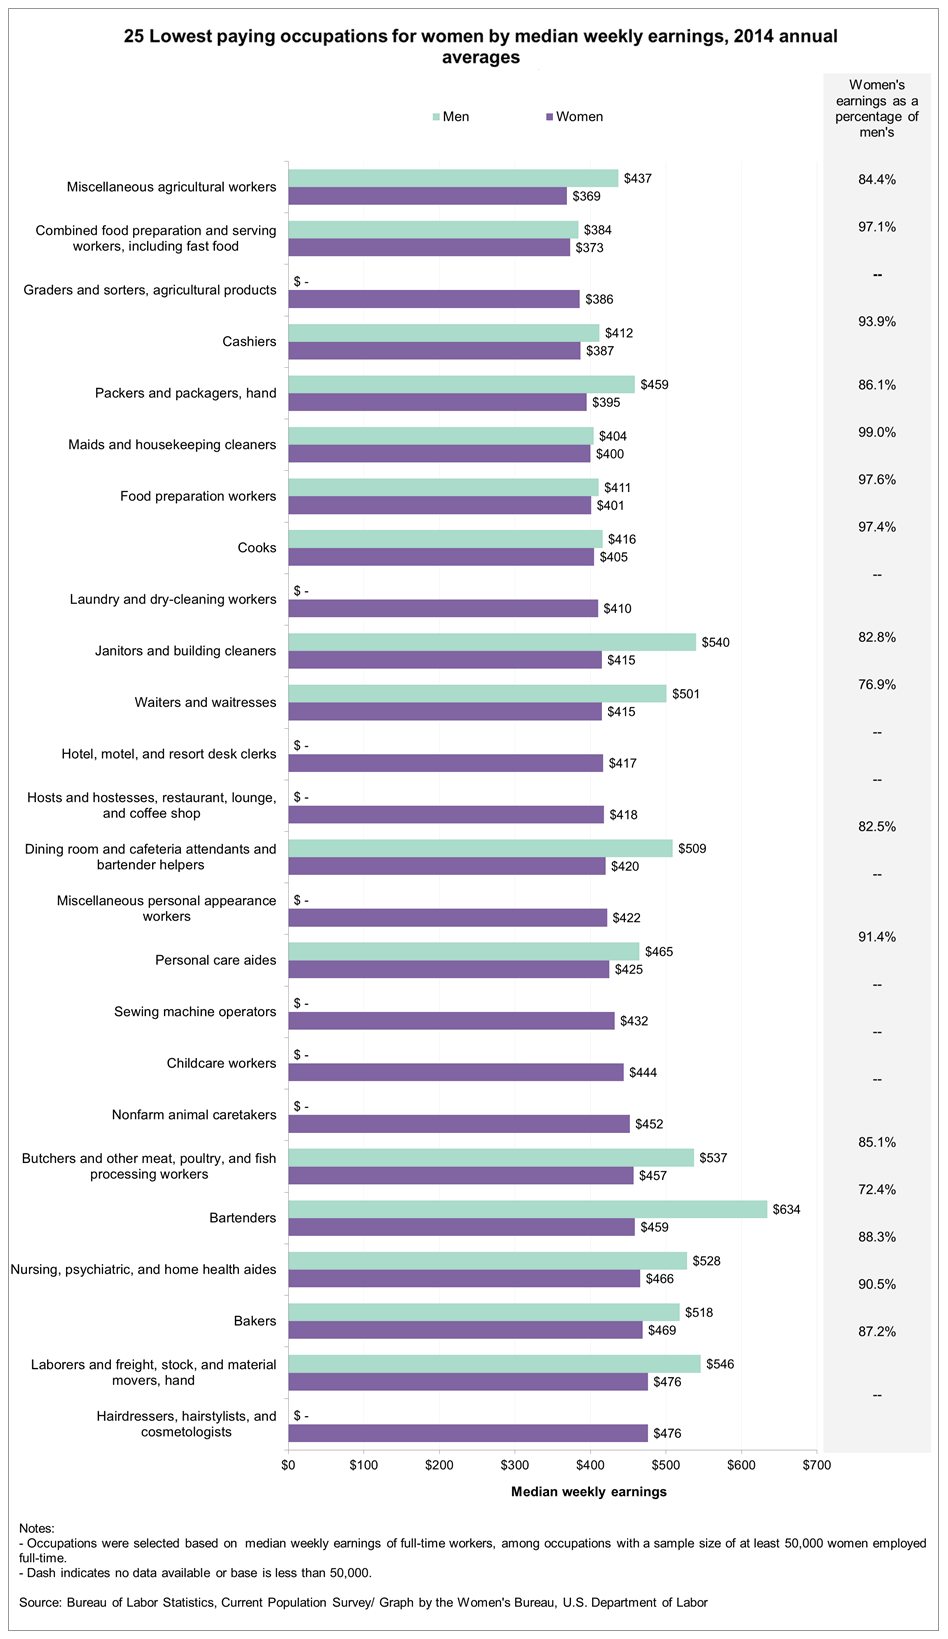
Chart 8

Chart 9
