Drought - Annual 2016
NCEI added Alaska climate divisions to its nClimDiv dataset on Friday, March 6, 2015, coincident with the release of the February 2015 monthly monitoring report. For more information on this data, please visit the Alaska Climate Divisions FAQ.
The data presented in this drought report are preliminary. Ranks, anomalies, and percent areas may change as more complete data are received and processed, but they will not be replaced on these pages.
|
Contents Of This Report: |

|
National Drought Overview

|

|
Percent area of the U.S. very warm, very cold, very wet, or very dry for January-December 2016. Very warm and very wet are defined as temperatures or precipitation in the upper tenth percentile of the historical record. Very cold and very dry are defined as temperatures or precipitation in the lowest tenth percentile of the historical record.
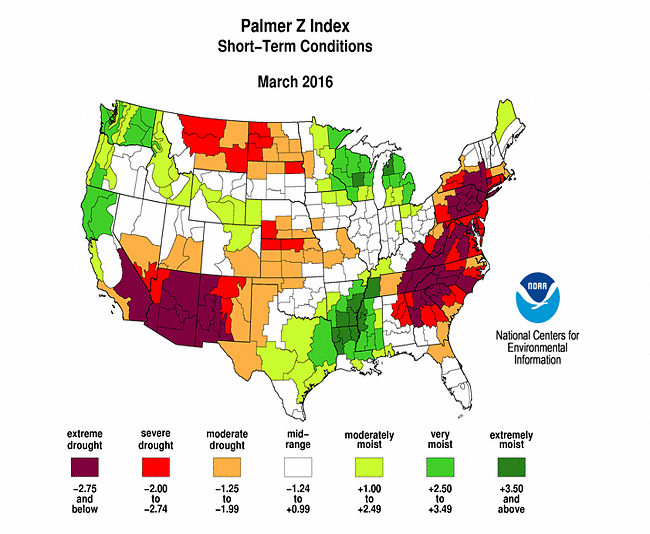
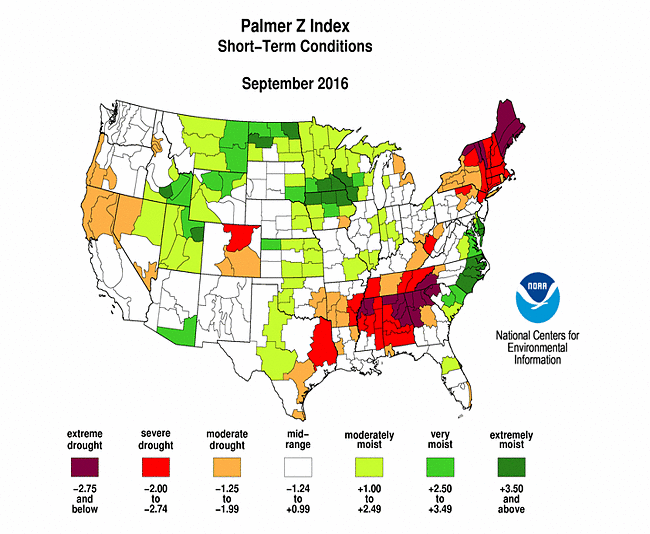
The atmospheric circulation patterns of 2016 varied considerably from month to month (upper-level 500-mb circulation anomaly maps over North America for January, February, March, April, May, June, July, August, September, October, November, December). But when integrated across seasons and over the year (upper-level 500-mb circulation anomaly maps over North America for January-March, April-June, July-September, October-December), one can see above-normal circulation anomalies dominating, first in the western U.S. and later in the central and eastern contiguous U.S. (CONUS). The above-normal circulation anomalies are associated with upper-level ridging, and ridges are usually associated with above-normal temperatures and below-normal precipitation. With above-normal circulation anomalies dominating much of the country for much of the year, warmer-than-normal temperatures tended to dominate in most months (standardized temperature anomaly maps for January, February, March, April, May, June, July, August, September, October, November, December). Above-normal temperatures enhance evapotranspiration which worsens drought conditions, especially in the summer months. Evapotranspiration was above-normal during 2016, especially in the northern Plains and Northeast to Southeast. Several regions of the country experienced very dry conditions beneath the transient ridges from month to month and, in many cases, the dryness was exacerbated by enhanced evapotranspiration (Palmer Z Index maps for January, February, March, April, May, June, July, August, September, October, November, December). Severe drought developed in those areas where dryness persisted for several months.
But the extreme circulation anomalies also resulted in very wet episodes during some months in some regions. These wet events mask some of the dry episodes on the statewide-scale and seasonal-scale analyses. They also resulted in a year that was characterized by both wet and dry extremes, sometimes in different parts of the country during the same month, and at other times in the same part of the country during different months.
On a national scale, 2016 began with 18.4 percent of the CONUS experiencing moderate to exceptional drought, according to the U.S. Drought Monitor (USDM), with drought centered mostly in the West and southern New England. A wet February in the Northeast shrank the national drought area to a minimum of 12.4 percent by March 15th. But as warm and dry weather developed and persisted as the year progressed, especially in the Southeast and Northeast, the national drought area expanded to reach a peak of 31.5 percent of the CONUS in moderate to exceptional drought by November 29th. A wet December brought the national percent area down to 22.5 percent by year's end (January 3rd, 2017). When averaged across all weeks of the year, the national percent area was 19.0 percent. An examination of this data (the average, peak, and low percent area each year) for each year since 2000, which is when the USDM began, reveals a decreasing trend since the major drought year of 2012, and a cycle of ups and downs since 2000.
Palmer Drought Index* monthly statistics, which go back to the beginning of the 20th century, indicate that 2.2 percent of the CONUS was in moderate to extreme drought by the end of January. The national drought area expanded during the spring and summer, peaking at 22.5 percent by the end of August. It dropped to about 15 percent by October, then rose to 20 percent in November, ending the year at 13.2 percent.

|

|
*This drought statistic is based on the Palmer Drought Index, a widely used measure of drought. The Palmer Drought Index uses numerical values derived from weather and climate data to classify moisture conditions throughout the contiguous United States and includes drought categories on a scale from mild to moderate, severe and extreme.
As noted above, the year was characterized by considerable variability in moisture conditions, both regionally and on a month-by-month basis. Ten to 20 percent of the CONUS experienced very dry precipitation anomalies (at the tenth percentile of the historical record or drier) during March, June, July, August, October, and November, while seven months (March, April, July, August, September, October, and December) had 10-20 percent of the country experiencing very wet anomalies (monthly precipitation totals at the 90th percentile of the historical record or wetter). When averaged together, the wet and dry anomalies resulted in the 16th wettest April, 20th driest June, and second wettest August in the 1895-2016 historical record.
Unusual warmth characterized most of 2016. All but four months (January, April, May, and December being the exceptions) had 30 percent or more of the country experiencing very warm temperature anomalies (at the 90th percentile of the historical record or warmer), with March and November having over 80 percent of the country very warm, while only one month (December) had a notable percentage (barely over ten percent) of the country experiencing very cold temperature anomalies (at the tenth percentile of the historical record or colder). When averaged across the country, the cold and warm temperature anomalies resulted in a top ten warmest month for February (eighth warmest), March (fourth warmest), June (warmest), September (ninth warmest), October (third warmest), and November (second warmest), as well as the second warmest year on record, overall.
Regionally, drought contracted across the West but persisted in California and Nevada, and pockets of drought developed across the Plains. But it was in the Southeast and Northeast where severe to extreme drought took hold and intensified throughout much of the year. The drought caused significant impacts in some areas, including low streamflow, groundwater, reservoir, pond and lake levels; parched soils; and desiccated vegetation and crops. Ranchers in the eastern drought areas were feeding winter feed supplies to their cattle by early fall. Wildfires burned across much of the Southeast, and many communities in the eastern U.S. implemented water restrictions. Drought expanded in Hawaii, then contracted starting in late spring. Puerto Rico began the year with drought but ended drought-free. Alaska experienced areas of abnormal dryness but no drought. The U.S.-Affiliated Pacific Islands experienced severe to exceptional drought during the first half of the year, but conditions rapidly improved when the El Niño ended.
 |
 |
 |
 |
 |
 |
 |
 |
 |
 |
 |
 |
[top]
Regional Drought Overview
West:
 |

Percent area of the West in moderate to extreme drought since 1996 (based on the Palmer Drought Index).
The 2016 calendar year began with 45.2 percent of the West in moderate to exceptional drought (according to weekly USDM statistics). The percent area steadily declined as the year went on, with occasional blips upward. By the end of the year, 21.5 percent of the West was in moderate to exceptional drought. The monthly statistics based on the Palmer Drought Index indicate that moderate to extreme drought expanded from 4.5 percent at the end of January to a peak of 43.3 percent in August, then declined to 7.8 percent by the end of December. The Palmer Drought Index responds to precipitation events faster than the USDM. Last year, the Palmer Index indicated as much as 33.5 percent of the West was in drought as of the end of November 2015, so the wet 2015-2016 winter caused a temporary dip in the Palmer percentages.
Based on Palmer Index data back to January 1900, the West has been in significant drought for most of 2000-2016. This 17-year drought episode is the largest and most persistent drought for the West in the historical record.
On a statewide basis, June-August 2016 was the seventh driest summer in the 1895-2016 record for Wyoming and ninth driest for Idaho. Colorado had the ninth driest September-November. But there were enough wet months scattered throughout the year to give most western states a near-average to wetter-than-average January-December 2016. Even though California and Nevada had the 29th wettest and 34th wettest year, respectively, on record in 2016, these states have experienced severe and persistent dryness for much of the previous five to six years. Based on the Standardized Precipitation Index (SPI), 2011-2016 was the fifth driest such 72-month period in the 1895-2016 record for California, 2013-2016 was the fifth driest 48-month period, and 2012-2016 tied as the eighth driest 60-month period. The unusual warmth of the last three decades in California (and much of the West) has exacerbated the drought conditions. In fact, the last three years were the three warmest years on record for California. When temperature is taken into account using the Standardized Precipitation-Evapotranspiration Index (SPEI), 2011-2016 ranked as the most severe 72-month drought on record for California, and 2012-2016 and 2013-2016 each ranked second most severe. The SPEI for Nevada indicated that 2011-2016 and 2012-2016 ranked as the second most severe 72-month and 60-month periods on record, respectively.

|

|
Great Plains:
 |
The 2016 calendar year began with 2.3 percent of the Central to Northern Plains (Kansas to North Dakota) in moderate to exceptional drought (according to weekly USDM statistics). The percent area increased as the year went on, with occasional blips downward. The peak area of 22.7 percent was reached on December 13-20 while the minimum of 1.0% occurred from May 17-31. By the end of the year, 21.5 percent of the Central to Northern Plains was in moderate to exceptional drought.
 |
For the Central to Southern Plains (Oklahoma to Texas), the 2016 calendar year began with no drought. February 16 was the first week this year that drought developed (according to weekly USDM statistics). Like the north, the percent area in the south increased as the year went on, with occasional blips downward. The peak area of 49.5 percent in moderate to exceptional drought was reached on November 29th. The percent area declined since then, reaching the current minimum value of 27.7 percent on January 3, 2017.
Based on the statewide precipitation ranks, Nebraska and South Dakota, as well as adjacent Montana and Wyoming, had a dry summer, and Kansas and Oklahoma, as well as adjacent Arkansas and Missouri, had a dry fall to early winter. At the sub-state level, two areas stand out as being dry on an annual basis — western South Dakota to adjacent northeast Wyoming, and northeast Oklahoma to adjacent parts of Arkansas and Missouri. The first area was the epicenter of drought on the January 3, 2017 USDM map in the Northern Plains, while the second area was the epicenter in the Southern Plains. On the USDM map, the Oklahoma epicenter extends westward across the state and into southwestern Kansas. Persistent dryness for the last three months of 2016 gave Missouri a rank of thirteenth driest October-December and Oklahoma 19th driest.
Northeast:
 |
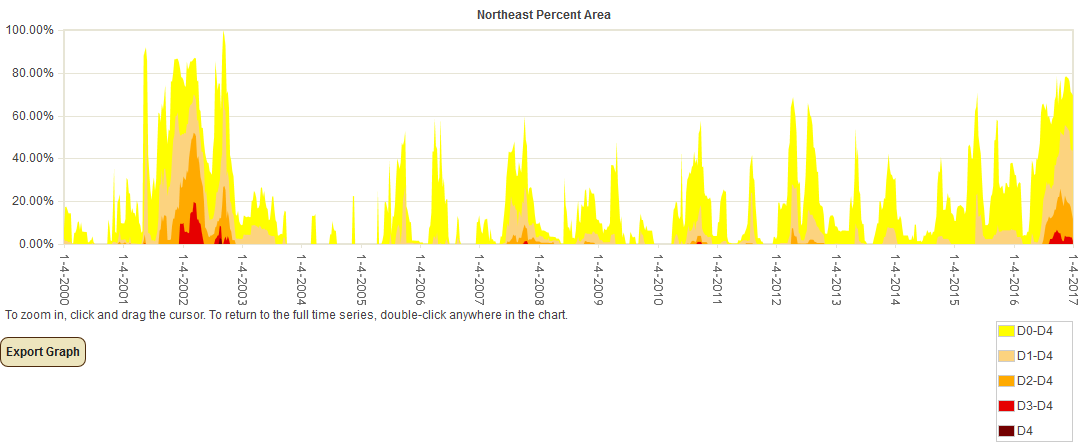
For the Northeast, the 2016 calendar year began with 6.6 percent of the region in moderate to exceptional drought (according to weekly USDM statistics). The percent area decreased to zero percent due to precipitation in February and stayed at zero from March 1-April 19. But dryness that began in March and persisted throughout much of the year resulted in a rapid increase in drought area to a peak of 55.6 percent on November 15th. December precipitation dropped the percent area to 43.7 percent by the end of the year.
March-April 2016 was especially dry, with parts of southeast Pennsylvania (climate divisions 3 and 4) and northern New Jersey experiencing the second to fourth driest March-April in the 1895-2016 record. But the nine months of March-November was an overall dry period with Connecticut experiencing the fourth driest and Massachusetts the seventh driest March-November on record.
 |
 |
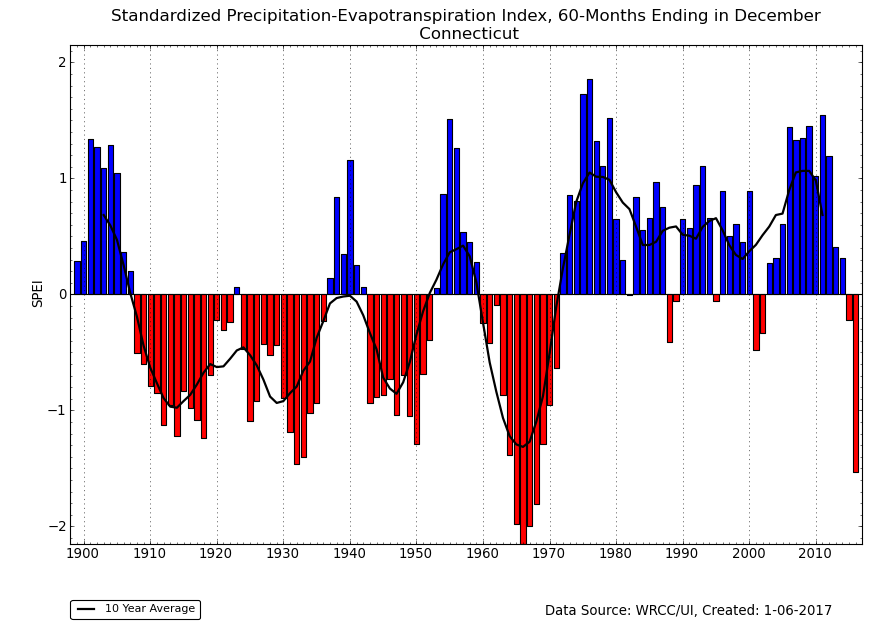
Southern New England has been the epicenter of dryness in the Northeast, with Connecticut having the fourth driest year and Massachusetts the tenth driest year in 2016. The last five years have each been drier than average for Connecticut. This persistent dryness rivals the drought of record of the 1960s. The 5-year period, 2013-2016, ranked as the fifth driest such 5-year period in the 1895-2016 record. The driest to fourth driest such periods all came from the 1960s. When temperature is factored in, the Connecticut SPEI for 2013-2016 also ranked as the fifth most severe 60-month SPEI on record.
Southeast to Lower Mississippi Valley:
 |
The 2016 calendar year began with no drought in the Southeast. Drought developed in April and rapidly expanded to about 21 percent of the region in moderate to exceptional drought by August (according to weekly USDM statistics). The percent area dipped slightly in September due to the coastal rains of Hurricane Matthew, then expanded again to peak at 54.9 percent on November 29th. December rains dropped the percent area to 38.5 percent by January 3, 2017.
 |
 |
Parts of the Southeast were dry during every month of the year except February. On a statewide basis, March-May was dry for Georgia and Tennessee. Georgia (ninth driest) and South Carolina (tenth driest) ranked in the tenth driest category of the historical record for June-August. Several states from Louisiana to Kentucky were in the top ten driest category for September-November, including Alabama (third driest), Kentucky (sixth driest), Tennessee (seventh driest), and Louisiana (ninth driest). Alabama was ninth driest for October-December. For the last half of the year (July-December), Alabama ranked sixth driest and Georgia eighth driest. These two states were the driest states in the Southeast for the year, with Georgia having the ninth driest and Alabama eleventh driest January-December.
During the fall, several locations had no precipitation for more than 50 consecutive days. The region from northeast Alabama to southwest North Carolina was the epicenter of drought in the Southeast for 2016. Several climate divisions in this area had the second driest year, with northeast Georgia (climate division 3) having the driest year on record. But March-November was the overall driest period of the year. Northeast Georgia (climate division 3) and western North Carolina (climate division 1) had the driest March-November in the 1895-2016 record, with several other climate divisions ranking in the top five driest category.
Puerto Rico and Hawaii:
 |
The 2016 calendar year began with 47.7 percent of Puerto Rico in moderate to exceptional drought (according to weekly USDM statistics). The percent area declined as the year went on, reaching zero percent by November 15th and remaining at zero through the end of the year.
 |
Hawaii started the year with 9.5 percent of the state in moderate to exceptional drought (according to weekly USDM statistics). The percent area rapidly increased to a peak of 78.8 percent on April 5th, then just as rapidly declined to a minimum of 1.1 percent on September 20-October 11. It slowly grew again, reaching a second peak of 8.3 percent on November 29-December 13, before ending the year at 2.5 percent.
U.S.-Affiliated Pacific Islands:
 |
 |
The El Niño which began in late 2014 and ended in mid-2016 created severe rainfall deficits across much of the western equatorial Pacific region where the U.S.-Affiliated Pacific Islands (USAPI) are located. The deficits began around September 2015 and lasted until about June 2016 when the monsoon rains began returning. Several stations in the Marshall Islands and Federated States of Micronesia observed the driest ten months (September-June) on record, including Ailinglapalap, Jaluit, Majuro, Pingelap, Woleai, and Yap.
[top]
Contacts & Questions


