

Sulfur hexafluoride (SF6) — Combined Data Set
Since 1995 two different sampling programs in The Halocarbons and other Atmospheric Trace Species (HATS) group have measured sulfur hexafluoride (SF6). The programs include a flask system and an in situ program. Flask measurements started in 1995 with eight stations and continue today sampling at 15 locations (13 background air). A four channel gas chromatograph was developed in 1998 (called CATS). The CATS gas chromatographs are currently deployed at six field sites and make hourly measurements.
A combined data set has been developed to incorporate all of the HATS monthly mean measurements made by each program. The combined data set is calculated by taking weighted averages of co-located measurements from background NOAA/ESRL GMD air measurement programs (listed below). All programs are on the same NOAA scale (NOAA 2006 scale for SF6) and every attempt is made to correct known biases between measurement programs; however, there maybe small differences that are not understood and characterized. When comparing measurements from station to station, be aware that not all locations are composed of the same measurement programs. The hemispheric and global means in the combined data set are our best measure of long-term trends and are used for international and national assessments for background air measurements. Displayed below are the data sets used to produce the combined data set as well as several figures.
| SF6 measurement programs | Start | Finish |
|---|---|---|
| HATS current flask instrument (OTTO) | 1995 | Current |
| HATS in situ (CATS program) | 1998 | Current |

Current HATS programs (green rectangles) are used in the combined data set. Click on a rectangle for a link to a specific program's data files.
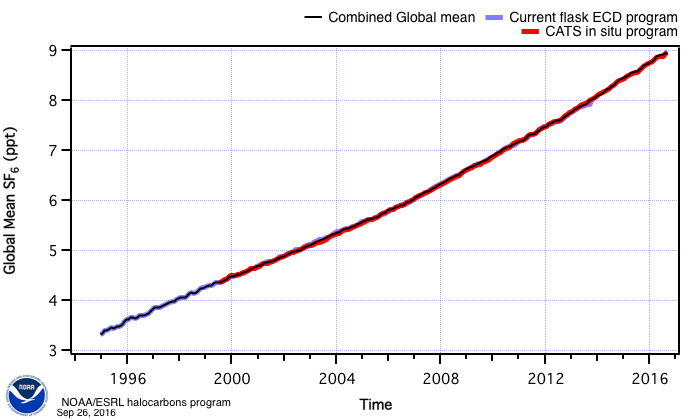
The figure above shows the different measurement programs' calculated global means and illustrates the overlap amongst programs. Measured monthly means from the different programs are statistically combined to create a long-term NOAA/ESRL HATS data set (black line). The combined data is calculated by first interpolating missing data at sampling location for each measurement program. A weighted average is subsequently calculated where there are co-located measurements from two or more programs. The gap filled station measurement is then smoothed with the Savitzky-Golay algorithm.

Zonal means are calculated for four northern (solid lines) and three southern (dashed lines) bins.
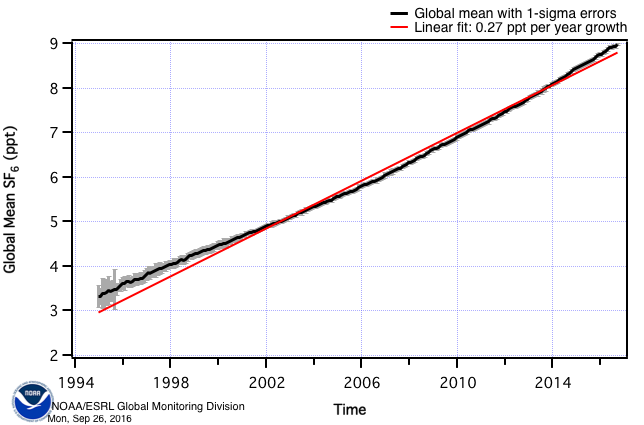
The global SF6 mean is plotted with 1-σ error bars (gray error bars). Improvements in measurement techniques and technology, as well as more sampling locations have reduced the global mean uncertainty since the mid 1990s. The red line is a linear fit to the global mean data demonstrating a fairly constant annual growth rate of 0.24 ppt per year. More recently the SF6 growth rate has been increasing.
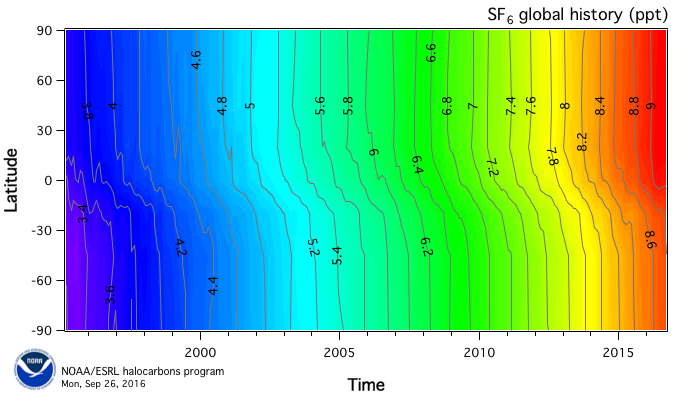
Global history of sulfur hexafluoride as a function of latitude (y-axis) and time (x-axis).
The Combined HATS SF6 Data File uses monthly data from the following programs:
Publications:
- Elkins, J.W, and G.S. Dutton (2009), Nitrous oxide and sulfur hexafluoride [in 'State of the Climate in 2008']. Bull. Amer. Meteor. Soc, 90 S38-S39.
- Hall, B.D., G.S. Dutton, D.J. Mondeel, J.D. Nance, M. Rigby, J.H. Butler, F.L. Moore, D.F. Hurst and J.W. Elkins (2011), Improving measurements of SF6 for the study of atmospheric transport and emissions. Atmos. Meas. Tech., 4 (11) 2441-2451, issn: 1867-1381, ids: 863AS, doi: 10.5194/amt-4-2441-2011.
- Rigby, M., et al., History of atmospheric SF6 from 1973 to 2008, Atmos. Chem. Phys., 10, 10305-10320, 462 doi:10.5194/acp-10-10305-2010, 2010.