|
Download Data (XLS File) |
|
||||||||
|
||||||||
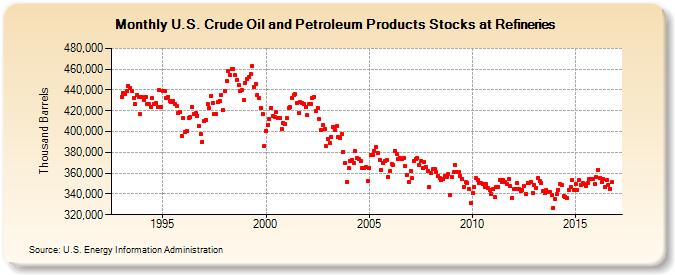
| U.S. Crude Oil and Petroleum Products Stocks at Refineries (Thousand Barrels) | ||||||||
| Year | Jan | Feb | Mar | Apr | May | Jun | Jul | Aug | Sep | Oct | Nov | Dec |
|---|---|---|---|---|---|---|---|---|---|---|---|---|
| 1993 | 433,522 | 437,444 | 436,490 | 438,698 | 444,095 | 442,086 | 439,349 | 432,073 | 426,467 | 435,578 | 433,051 | 416,883 |
| 1994 | 433,243 | 430,244 | 433,518 | 426,059 | 426,427 | 423,806 | 432,045 | 426,667 | 427,110 | 424,002 | 439,890 | 424,060 |
| 1995 | 439,318 | 438,998 | 432,628 | 433,655 | 429,302 | 428,041 | 429,696 | 426,612 | 424,361 | 418,144 | 419,124 | 395,267 |
| 1996 | 413,075 | 399,095 | 400,705 | 413,364 | 413,540 | 423,816 | 417,324 | 417,392 | 415,392 | 405,670 | 397,753 | 390,028 |
| 1997 | 409,757 | 411,387 | 426,982 | 422,588 | 434,359 | 427,827 | 416,587 | 417,036 | 428,161 | 429,525 | 435,020 | 420,894 |
| 1998 | 438,806 | 448,645 | 457,830 | 454,422 | 460,215 | 460,135 | 454,451 | 450,032 | 444,747 | 438,940 | 439,995 | 430,578 |
| 1999 | 446,978 | 450,831 | 452,013 | 455,264 | 462,775 | 442,834 | 446,106 | 435,379 | 431,935 | 422,805 | 417,358 | 386,225 |
| 2000 | 400,990 | 406,519 | 411,749 | 422,505 | 414,777 | 414,380 | 418,529 | 412,909 | 412,773 | 402,518 | 408,278 | 407,543 |
| 2001 | 412,667 | 422,761 | 424,088 | 432,336 | 434,852 | 435,958 | 427,726 | 417,810 | 428,099 | 427,389 | 426,888 | 423,194 |
| 2002 | 415,771 | 426,145 | 426,637 | 432,463 | 433,625 | 419,337 | 422,864 | 412,172 | 401,528 | 405,953 | 402,323 | 385,775 |
| 2003 | 392,669 | 388,957 | 395,186 | 404,672 | 401,295 | 404,876 | 394,986 | 393,623 | 397,464 | 380,678 | 369,536 | 351,409 |
| 2004 | 364,912 | 371,969 | 372,890 | 370,103 | 380,963 | 374,430 | 373,196 | 371,222 | 365,291 | 364,884 | 365,997 | 352,178 |
| 2005 | 365,078 | 377,859 | 377,767 | 381,749 | 385,025 | 379,400 | 372,888 | 362,751 | 370,149 | 371,403 | 372,901 | 356,569 |
| 2006 | 362,047 | 368,992 | 367,586 | 381,231 | 378,017 | 373,927 | 374,443 | 373,580 | 374,462 | 366,462 | 357,957 | 351,127 |
| 2007 | 362,508 | 354,938 | 371,577 | 373,170 | 374,894 | 367,744 | 371,218 | 365,295 | 370,944 | 365,944 | 362,316 | 346,915 |
| 2008 | 359,827 | 363,832 | 363,962 | 361,282 | 357,204 | 355,469 | 353,724 | 353,890 | 357,323 | 355,887 | 359,219 | 338,782 |
| 2009 | 356,330 | 360,758 | 367,876 | 360,927 | 361,258 | 356,865 | 354,076 | 346,739 | 351,094 | 350,290 | 344,969 | 331,615 |
| 2010 | 340,726 | 346,522 | 355,125 | 353,000 | 350,195 | 350,281 | 349,536 | 346,812 | 349,070 | 345,649 | 343,888 | 339,907 |
| 2011 | 344,308 | 337,020 | 346,924 | 346,881 | 353,770 | 351,298 | 353,152 | 351,348 | 349,460 | 354,195 | 347,418 | 336,327 |
| 2012 | 344,765 | 344,265 | 350,536 | 345,026 | 343,047 | 343,874 | 347,800 | 339,965 | 350,467 | 350,428 | 351,391 | 341,211 |
| 2013 | 348,523 | 345,250 | 355,258 | 352,092 | 350,910 | 342,404 | 340,713 | 343,906 | 341,645 | 341,646 | 339,176 | 326,400 |
| 2014 | 335,260 | 339,729 | 344,113 | 349,339 | 348,908 | 337,899 | 337,055 | 336,550 | 344,208 | 346,891 | 353,628 | 343,792 |
| 2015 | 349,530 | 344,189 | 353,259 | 348,820 | 350,187 | 349,138 | 347,670 | 350,788 | 353,949 | 354,805 | 353,933 | 349,271 |
| 2016 | 356,014 | 363,339 | 355,355 | 351,005 | 354,056 | 346,663 | 353,451 | 348,971 | 345,074 | 351,100 | ||
| - = No Data Reported; -- = Not Applicable; NA = Not Available; W = Withheld to avoid disclosure of individual company data. |
| Release Date: 12/30/2016 |
| Next Release Date: 1/31/2017 |