
Real-time: GLAPS Total Precipitable Water (cm)
Description

The Global Analysis and Prediction System, GLAPS, produces maps for several weather parameters over a large global domain. There are seven GLAPS products available for Science On a Sphere®. It is important for meteorologists to know the current conditions, not only in their local area, but also globally. A computer model is used to create a first guess as to what the map should look like, and then observations are added to enhance the map. The observations come from Doppler radars, satellites, wind and temperature profilers, radiometric profilers, as well as aircraft. GLAPS is such a powerful tool because of its ability to consolidate observations from so many different sources. The GLAPS datasets are available in real-time, updating hourly, and include the data for the past week.
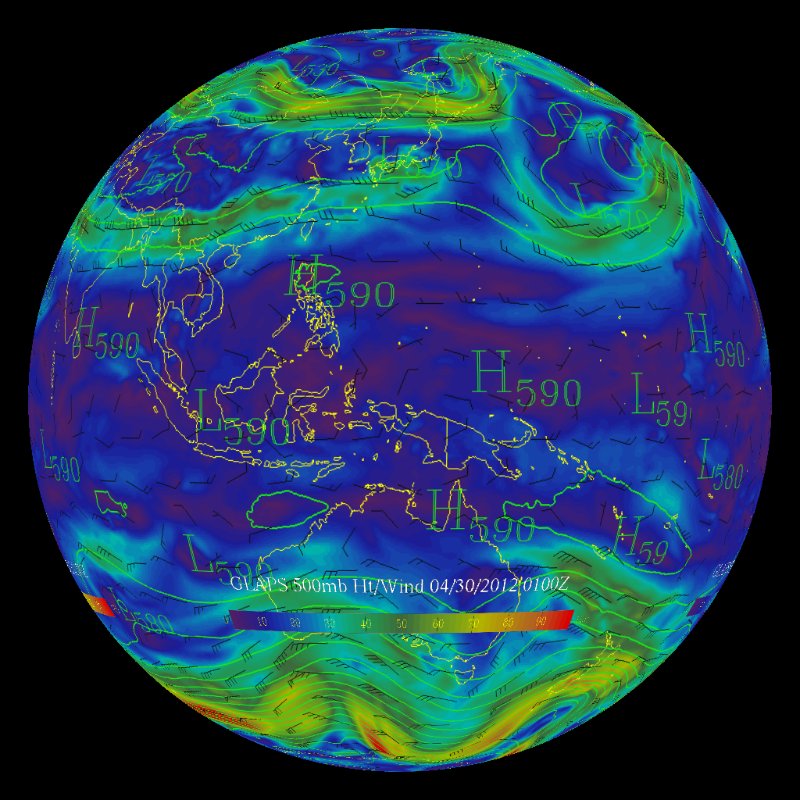
Every real-time GLAPS dataset all updates hourly. GLAPS Total Precipitable Water map is an image of integrated water vapor (IWV) in centimeters. Notice the prevalence of humid air near the tropics no matter what season it is. The colorbar for precipitable water in cm is below.
|
|
| GLAPS Total Precipitable Water in cm |
Notable Features
- Tropics generally have high total precipitable water
- Areas of high total precipitable water typically indicated clouds and precipitation
Related Datasets


Details
Media PreviewDirectory Category
- Atmosphere
- No
- NOAA GLAPS
- Steve Albers NOAA/GSD
- Steve Albers NOAA/GSD
- Steve Albers
- Real-time, GLAPS, weather model, precipitable water, temperature, wind, pressure