      |
|
 |
 |
Timothy J. Smith, WSU Cooperative Extension, 400 Washington Street, Wenatchee,
WA 98801
e-mail smithtj@wsu.edu Further information on model
use: ![]()
Fire blight danger varies from orchard to another, and over time within each orchard. To assess the risk of fire blight blossom infection, the model user must consider the factors below throughout the Spring and early Summer: |
|
|
 |
combinations, and on many pear varieties. Start counting degree hours as the first blossoms open, and continue until few remain. Younger trees, those growing rapidly, and certain highly susceptible cultivars or rootstocks are at higher risk, as infection may cause extensive tree damage or death. |
|
The model user is asked to take in to account the recent history of blight in the area around the orchard, observe the stage and number of bloom, and set appropriate situation-specific degree hour thresholds. Severe blight outbreaks may occur without apparent prior-season infection in the region when risk of infection is "Extreme." Never assume that E. amylovora is not present. |
|
Temperatures: The relationship between the development stage of each individual flower and the growth rate of the blight bacteria is complex. During the cooler weather common during primary bloom, an indivudual flower might last 6 - 8 days from first opening to petal fall. At the temperatures under which blight bacteria colony growth rate is dangerous, the flower in the orchard stays in condition to support that colony growth for about four days. The bacteria must develop to dangerous numbers during the immediate three or four days leading up to blossom wetting. Warmer temperatures |
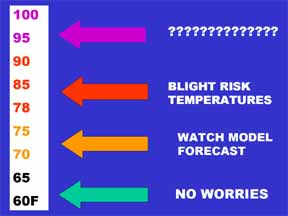 |
induce rapid bacterial growth in flowers. If bacteria numbers exceed a certain minimum while the flower is in good condition, then the flower is lightly wetted, infection is possible. The sort of daily high temperatures we must be wary of in most orchards start in the mid to high 70's F (24 C), and are especially dangerous in the 80 - 88F range (27 - 31 C). These sorts of warm days can occur during primary bloom, and should alert you to the possibility of blight infection when they occur, especially when it is warm for two or more days in a row. Both flower condition and bacterial growth rate degrade as the daily temperatures rise to 95F and over (35 C), especially if these temperatures continue for three or more days. Infection can occur on a "cool" day if temperatures during the three days leading up to the cool, wet day were warm. Blight bacterial colonies that developed to dangerous size on the warm days do not suddenly go away on the first cool day after the warm period. Watch temperatures over time. |
|
A blight bacteria colony may grow to the numbers that could lead to infection, but the infection process is no complete without water. The gentle washing of the bacterial colony into the flower nectary is a critical step. Under dry conditions, this factor may be lacking, and infection is avoided. Rain is the most common wetting event, but there are other equally dangerous ways to wet flowers. While it does not seem that sprayer wetting triggers blight under normal drying conditions, it is possible that it would if high volumes of water were applied (to drip) and the trees were sprayed under very slow drying conditions. Mist from sprinkler irrigation or dew are the most common, and difficult to identify wetting events. When flowers are present, and the temperatures have been warm, you are often left trying to deteermine if wetting has happened or will occur. This is a difficult factor to determine, as environmental conditions are quite variable, and remote weather monitoring stations are not always set up to accurately identify wetting in low areas of the orchard, nor do they know when irrigation may have been applied. Wetting may be obvious, but you can never safely assume that no blossom wetting occurred. There is an automated version of the Cougarblight fire blight infection risk model on the WSU Decision Aid System. This version of this model is automated, and totals the hourly fire blight degree hour value each hour of the three days leading up to "today's morning," and adds to that measured number of degree hours the estimated degree hours for the current day, based on the predicted high temperature and the look-up chard described below. (See the link to this free-access system on the "Current Models" page on this web site. Click here. This model uses the WSU AgWeatherNet data to run a fire blight model for all monitored sites, and is updated hourly. Set the situation relative to blight around your orchard last year, watch the degree hour totals and forecasts, and watch the rain, wetness, and dew point monitors on the upper left part of the page. When the degree hour total is near or over the threshold, flowers are present and wetness is indicated, blight is possible. Look-up Chart Version of the Cougarblight model: The look-up chart method described below has served the users well, despite the fact that the values are estimates, and can vary by 10 percent, but usually track the actual hourly values relatively well. If you use the look-up table, take this 10 percent uncertainty into account when deciding risk threshold levels. There is not likely to be much difference between 480 and 520 when 500 degree hours is considered a "threshold" in a biological system such as this. Use the degree hour look-up chart or this Excel spreadsheet to assign a degree hour value to each day. The total of the degree hours for the four full days prior to blossom wetting helps you assess risk of blossom infection. If blossoms are wetted during the day or evening, total the number of degree days that have accumulated over the past three days, plus the number predicted for the current days high temperature to equal the "four-day degree hour total." If blossoms are wetted in the early morning hours, use the degree hour total from the past four days. |
|
Example:
. |
. | |||
3 DAYS AGO |
. | |||
2 DAYS AGO |
. | |||
YESTERDAY |
. | |||
TODAY (PREDICTED) |
. | |||
. |
. |
EXAMPLE: Three
days ago, 76/45 = 130 degree hours. ( See table below for DHr. values) Two
days ago,
80/51 = 230 degree hours. Yesterday, 80/45 = 195 degree hours.
Today's predicted temperature,
70/42 = 52 degree hours. The sum of these
four days degree hours equals 607. If contaminated blossoms
are wetted,
fire blight infection risk is "High."
You should also use temperature forecasts to
watch for future risk levels. This is the most useful way to
use this model,
as you may need to make control decisions two or three days in advance of
potential
infections.
To accurately evaluate potential infection periods,
you must have a way to monitor blossom wetting. A
leaf wetness sensor is
probably the best method. If blossoms are wetted, usually by rain, but sometimes
by heavy dew (3+ hours) or by light irrigation wetting, the following table
may help you evaluate
infection risk.
TABLE FOR INFECTION RISK RELATIVE TO 4-DAY DEGREE HOUR TOTAL:
| Potential Pathogen Presence (Fire Blight History) |
RISK |
RISK |
RISK | |
| No fire blight in the area during the past two seasons. | ||||
| Blight present in the region, but not near your orchard, last year. | ||||
| Blight in your or neighboring orchard last year. | ||||
| Active Blight strikes or cankers are presently in your or neighboring orchard. |
Note: "Marginal" infection conditions do not often lead
to fire blight outbreaks- this is a precautionary
level, nearing conditions
that may more likely lead to blight. Watch forecasts carefully if risk is
"Marginal".
The threshold numbers on
the table above are not Absolute. If your
Degree hour total is near a threshold, use
your judgment, taking into account
the total tree and orchard risk factors discussed above.
DAILY DEGREE HOUR ESTIMATION CHART:
| Daytime High Temperature | |||||
60 |
0 |
0 |
83 |
243 |
280 |
62 |
2 |
5 |
84 |
257 |
292 |
63 |
5 |
12 |
85 |
266 |
302 |
64 |
10 |
22 |
86 |
274 |
310 |
65 |
14 |
29 |
87 |
280 |
315 |
66 |
20 |
35 |
88 |
285 |
320 |
67 |
26 |
42 |
89 |
288 |
325 |
68 |
33 |
50 |
90 |
290 |
330 |
69 |
42 |
60 |
92 |
287 |
335 |
70 |
52 |
70 |
93 |
284 |
333 |
71 |
62 |
80 |
94 |
280 |
330 |
72 |
74 |
92 |
95 |
274 |
325 |
73 |
87 |
105 |
96 |
267 |
317 |
74 |
100 |
120 |
97 |
260 |
309 |
75 |
115 |
134 |
98 |
254 |
302 |
76 |
130 |
151 |
99 |
246 |
293 |
77 |
146 |
169 |
100 |
238 |
285 |
78 |
162 |
189 |
101 |
230 |
275 |
79 |
178 |
209 |
102 |
222 |
268 |
80 |
195 |
230 |
103 |
216 |
259 |
81 |
212 |
250 |
104 |
208 |
250 |
82 |
228 |
265 |
105 |
200 |
240 |