

You are here
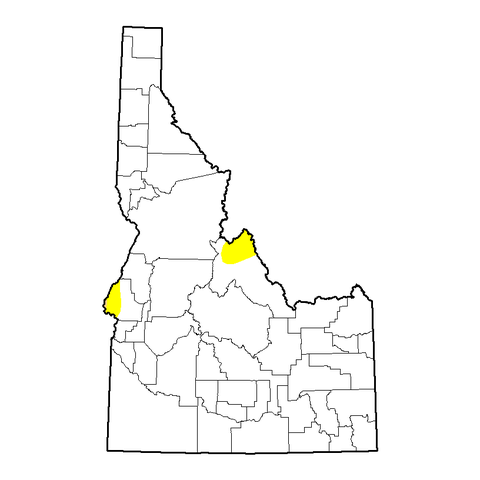
U.S. Drought Monitor - Idaho
As of January 10, 2017
Author: David Miskus,NOAA/NWS/NCEP/CPC
| Week | None | D0-D4 | D1-D4 | D2-D4 | D3-D4 | D4 |
|---|---|---|---|---|---|---|
| Current 1/10/2017 | 98.13% | 1.87% | 0.04% | 0.00% | 0.00% | 0.00% |
| Last Week 1/03/2017 | 89.98% | 10.02% | 0.04% | 0.00% | 0.00% | 0.00% |
| Three Months Ago 10/11/2016 | 50.36% | 49.64% | 2.03% | 0.00% | 0.00% | 0.00% |
| Start of Calendar Year 1/03/2017 | 89.98% | 10.02% | 0.04% | 0.00% | 0.00% | 0.00% |
| One Year Ago 1/12/2016 | 10.95% | 89.05% | 63.25% | 3.66% | 0.00% | 0.00% |
Drought Intensities
- None: No Drought
- D0: Abnormally Dry
- D1: Moderate Drought
- D2: Severe Drought
- D3: Extreme Drought
- D4: Exceptional Drought

Download the following time series chart as an Image,
Download the following time series data as JSON,
Download the following time series data as XML

Showing Data will replace the time series below with a data table.
Download the following pie chart as an Image

Showing Data will replace the pie chart below with a data table.