

You are here
Current Conditions
Weekly Drought Update - 1/03/2017

| Week | None | D0-D4 | D1-D4 | D2-D4 | D3-D4 | D4 |
|---|---|---|---|---|---|---|
| This Week 1/03/2017 | 53.89% | 46.11% | 22.53% | 8.63% | 3.15% | 0.96% |
| Last Week 12/27/2016 | 49.19% | 50.81% | 24.04% | 10.09% | 4.53% | 1.81% |

| Last Saturday 1/14/2017 | 9.5% |
|---|---|
| Previous Saturday 1/07/2017 | 7.95% |
| New data is posted on Tuesdays. | |
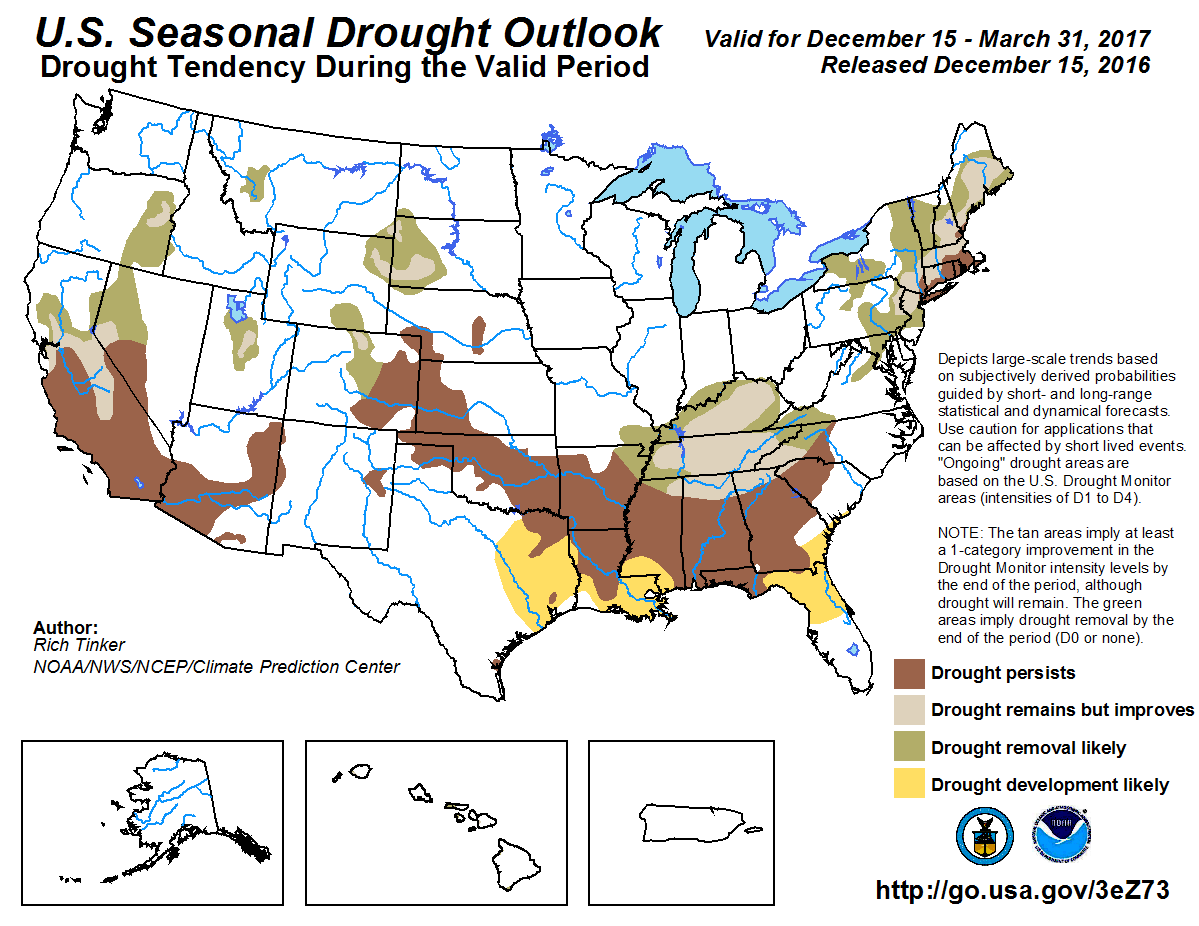
Forecast
Impacts

See USDA maps and charts showing agricultural areas in the continental U.S.
impacted by drought, including those producing corn, soybeans, hay, cattle,
and wheat. Information includes state-by-state percentages of each crop
impacted by drought, and tracks the national percentage of each crop in
drought for the previous 12 months.