


Graph detailed information pertaining to the US Drought Monitor through this interactive interface.

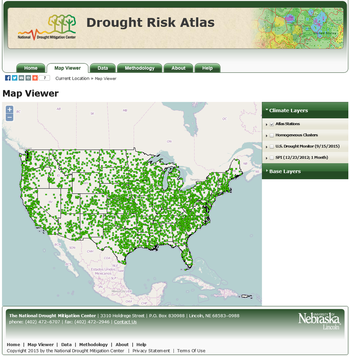
Visualize drought and climate information through interactive mapping of information from NIDIS and its partners.

Explore data related to drought from the Regional Climate Centers. Look at length or periods without rain, temperature data, and more.
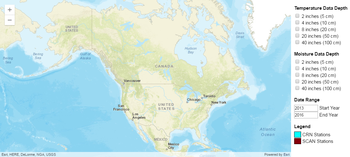
Interact with soil moisture and soil temperature data from the Climate Reference Network stations, in the U.S.
Compare drought histories for a specific location. Users can see how often drought has affected an area, how bad it has been and how long it lasted.

Access the National Drought Mitigation Center's Drought Management Database to see drought preparation, mitigation, and response strategies in the U.S.