

A selection of tools to monitor soil, crops, weather and other conditions.

The USDA produces monthly maps and charts showing locations and percentages of drought-affected areas which produce corn, soybeans, hay, cattle, and winter wheat.
![Sample of [paragraphs_item:field-grid-block-link:title]](https://webarchive.library.unt.edu/web/20170119005725im_/https://www.drought.gov/drought/sites/drought.gov.drought/files/styles/grid_thumbail/public/externals/3065b1defb5144418a3cd16fc49b7987.gif?itok=92h8EnIC)

Collection of maps shows current percentiles for soil moisture, snow-water equivalent (SWE), total moisture storage and cumulative runoff at different timescales compared to the historic record.
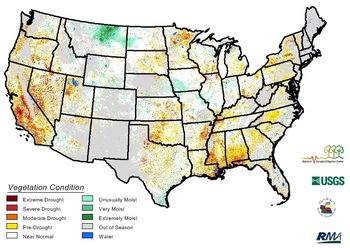
VegDRI maps are produced every two weeks and provide regional to sub-county scale information about drought's effects on vegetation. Click on “Change Maps” tab for comparisons to the previous map, a month previous and a year ago. Clicking on the “Time Series” tab brings up an animation of changes to the map in a given year.
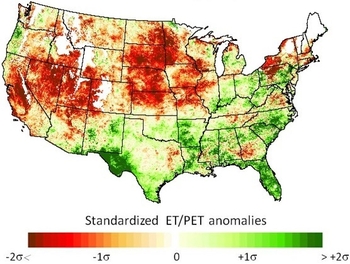
The Evaporative Stress Index (ESI) describes temporal anomalies in evapotranspiration (ET), highlighting areas with anomalously high or low rates of water use across the land surface. The ESI also demonstrates capability for capturing early signals of “flash drought”, brought on by extended periods of hot, dry and windy conditions leading to rapid soil moisture depletion.

Modeled soil moisture from the NOAA Climate Prediction Center.
![Sample of [paragraphs_item:field-grid-block-link:title]](https://webarchive.library.unt.edu/web/20170119005725im_/https://www.drought.gov/drought/sites/drought.gov.drought/files/styles/grid_thumbail/public/externals/902ac4134de51b1cd0e204d29ec21d81.jpg?itok=0hdZmnaB)
Select for "agriculture" and a preferred timescale and location through this interactive database to view impact reports from media and other sources.

Select a region to find databases and reports of various crops, as well as headlines in agricultural news.
![Sample of [paragraphs_item:field-grid-block-link:title]](https://webarchive.library.unt.edu/web/20170119005725im_/https://www.drought.gov/drought/sites/drought.gov.drought/files/styles/grid_thumbail/public/externals/4ca2f6cfd4e6a166d29bbe55a2a9c55d.gif?itok=Gt8GCNyi)
A full menu of forecast maps and data for weather, temperature, precipitation, wind speed, sky cover and more.
Scroll to “drought” on the list of FAQs for information on drought and crop insurance.
Interactive map lets users select individual stations nationwide to access soil temperature and moisture data a varying depths.