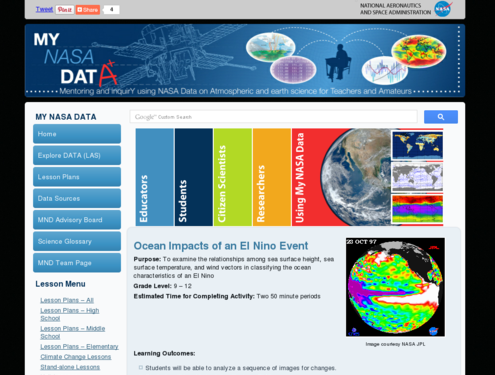
Ocean Impacts on an El NiÃo Event
This lesson explores El NiÃo by looking at sea surface temperature, sea surface height, and wind vectors in order to seek out any correlations there may be among these three variables using the My NASA Data Live Access Server. The lesson guides the students through data representing the strong El NiÃo from 1997 to 1998. In this way, students will model the methods of researchers who bring their expertise to study integrated science questions.
Go To:
Missy Holzer
My NASA Data
Notes From Our Reviewers
The CLEAN collection is hand-picked and rigorously reviewed for scientific accuracy and classroom effectiveness. Read what our review team had to say about this resource below or learn more about how CLEAN reviews teaching materials
Teaching Tips
Literacy and Resources
Relation Link:
Grade Level:
![]()