

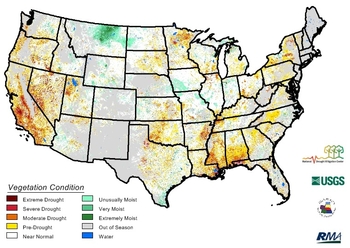
VegDRI maps are produced every two weeks and provide regional to sub-county scale information about drought's effects on vegetation. (Click for actual conditions)
![Sample of [paragraphs_item:field-grid-block-link:title]](https://webarchive.library.unt.edu/web/20170119004423im_/https://www.drought.gov/drought/sites/drought.gov.drought/files/styles/grid_thumbail/public/externals/b4dca730cde1a3d0bd27ebc90a4c38c0.png?itok=SHvlIXi3)
The Evaporative Stress Index (ESI) uses remotely sensed land-surface temperature time-change signals to describe anomalies in evapotranspiration.(Click for actual conditions)

Vegetation Health Indices help estimate vegetation health, moisture condition, thermal condition and more. (Click for actual conditions)
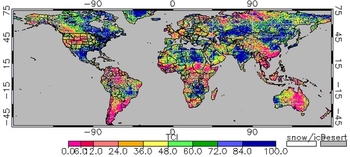
A selection of worldwide maps monitoring different aspects vegetation health. (Click for actual conditions)
![Sample of [paragraphs_item:field-grid-block-link:title]](https://webarchive.library.unt.edu/web/20170119004423im_/https://www.drought.gov/drought/sites/drought.gov.drought/files/styles/grid_thumbail/public/externals/0ed044b3a9806fabc7be7fdd7a13c7df.png?itok=mJGv0Ba8)
Interactive web application for single and comparative views of Wildland Fire Assessment data. (Click to use the tool)

Maps show how much water is stored now as a probability of occurrence in the record from 1948 to present. (Click for actual conditions)