Melt extent in Greenland was above average in 2016, ranking tenth highest (tied with 2004) in the 38-year satellite record. Melt area in 2016 was slightly greater than in 2015, which ranked twelfth. However, near-average to below-average coastal snowfall levels that exposed bare ice earlier in the melting season, combined with warm and sunny conditions at lower elevations, led to high overall ice loss from runoff.
Overview of conditions
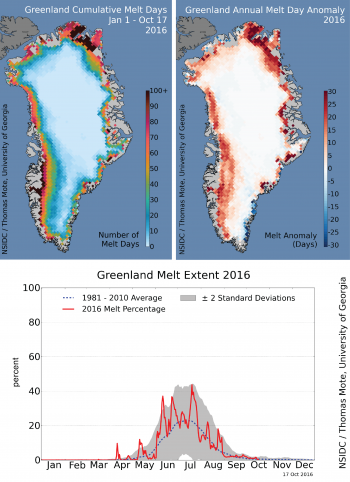
Figure 1. The map on the top left shows the cumulative melt days for the 2016 Greenland melt season (through 17 October). The map on the top right shows the melt day anomaly for 2016 relative to average number of melt days for the 1981 to 2010 average. The bottom graph shows the summer melt extent on the Greenland Ice Sheet for 2016. The indicated high melt frequency in far northeastern Greenland is an artifact of unmasked bare ground in that region.
Data are from the MEaSUREs Greenland Surface Melt Daily 25km EASE-Grid 2.0 data set. About the data
Credit: National Snow and Ice Data Center/Thomas Mote, University of Georgia
High-resolution image
Seasonal surface melt began early in 2016, with extensive melt events in southwest Greenland in the second and fourth week of April. Greater than average melt was observed in western and northeastern Greenland, as was also seen in 2015. A few areas along the eastern and southeastern coast near Helheim and Kangerdlugssuaq glaciers, saw frequent melting in 2016, resulting in increased ice exposure. Dark ice, typical along the central western Greenland coast, also appeared near Helheim and Kangerdlugssuaq glaciers. Common during any melt season, a series of warm events caused brief spikes of high melt area during the summer. Summer daily melt extent rarely fell below the 1981 to 2010 average. Peak melt extent occurred on July 19, when our passive microwave analysis method mapped surface melting on 43 percent of the ice sheet.
Conditions in context

Figure 2. The left plot shows air pressure anomaly (height anomaly of the 500 mbar pressure level, in meters) and the right plot shows air temperature anomaly (in degrees Celsius) for June, July, and August 2016 combined, relative to the 1981 to 2010 average.
Credit: NSIDC courtesy, NOAA ESRL Physical Sciences Division
High-resolution image

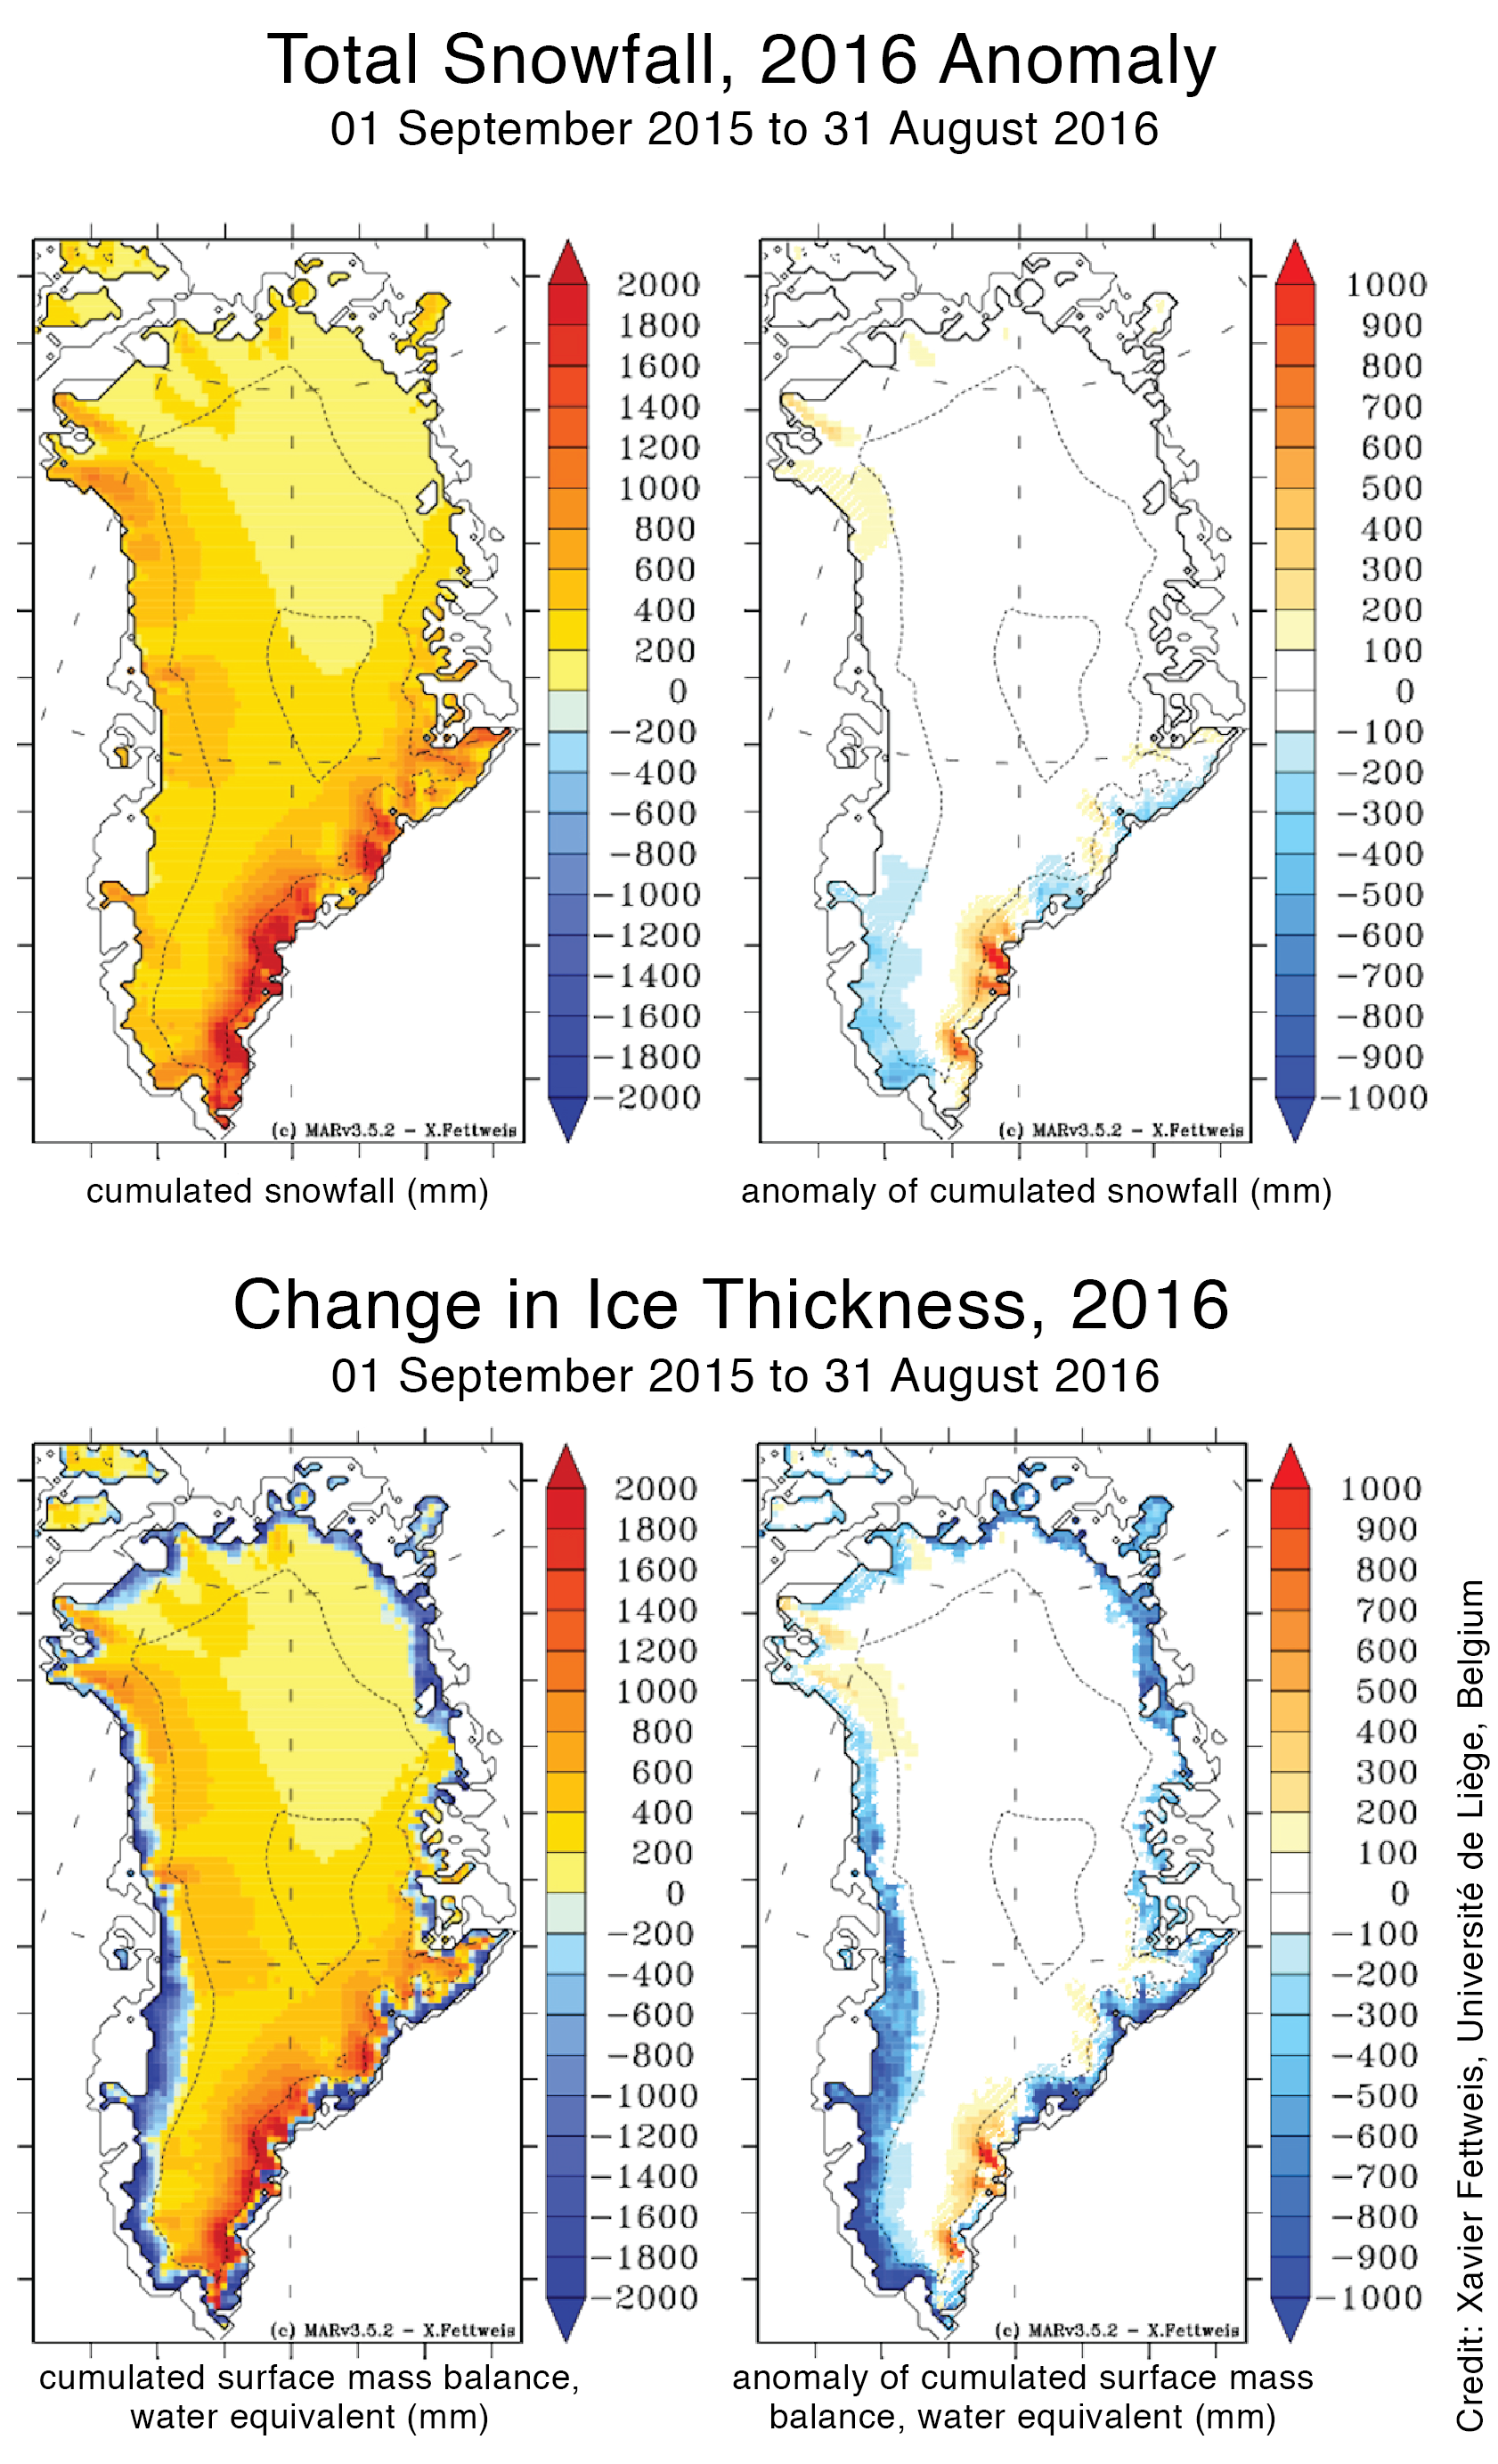
Figure 3. The top left map shows cumulated snowfall (water equivalent) in millimeters, while the right shows anomaly of snowfall for Greenland from 2015 to 2016. The bottom maps show the net change in water equivalent thickness in millimeters (negative values, in blue, mean mass loss) for Greenland from 2015 to 2016.
Credit: Xavier Fettweis, Université of Liège, Belgium/MAR regional climate model
High-resolution image
Warm weather conditions and higher-than-average air pressure prevailed for June, July, and August in 2016 (compared to the three month average for 1981 to 2010). The tendency for higher-than-average pressure over the island continues a trend seen for several recent summers. This year, the pressure pattern center hovered above Baffin Island, inducing drier and sunnier conditions along the western coast, raising its temperatures up to 2 degrees Celsius (4 degrees Fahrenheit) higher than average for the summer. This caused frequent surface melting along the western flank of the ice sheet where dark, older, interior ice became exposed. Cooler and cloudier conditions prevailed in northeastern Greenland (less than 1 degree Celsius or 2 degrees Fahrenheit above average). However, on both the eastern and western coastal areas of the ice sheet, the exposure of dark ice combined with more sunshine led to intense melting during the observed melt days. High levels of run-off on the western coast, and eastern coast ‘hot spots’ of frequent and intense melting led to a high estimated mass loss. One model (MAR 3.5.2 from Xavier Fettweis, Université de Liège, forced by NCEP reanalysis data) estimates a net extra surface mass loss of water with respect to the 1981 to 2010 average at 144 gigatons. This is the third highest surface mass loss since observations began in 1979, trailing the warm summers of 2010 and 2012.
Greenland in 2016 compared to other years
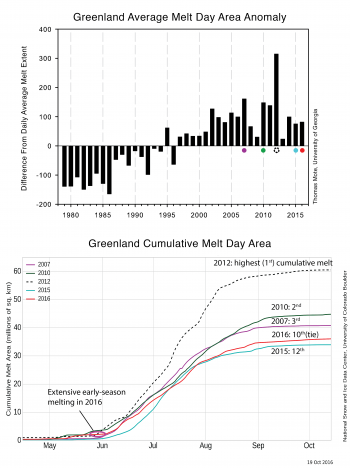
Figure 4. The top graph shows the average daily melt area anomaly for Greenland, 1979 to 2016. The graph compares melt area in thousands of square kilometers for June to August each year, to the average for 1981 to 2010 for these same months. The bottom graph shows the cumulative melt day area for 2016, 2015, 2012, 2010, and 2007.
Credit: National Snow and Ice Data Center, University of Colorado Boulder
High-resolution image
The 2016 total summer melt extent area (the sum of surface melt area for each day for June, July, and August) was 36 million square kilometers (13.9 million square miles), tenth largest in the 1978 to 2015 period (tied with 2004). While significantly higher than the 1981 to 2010 average, the 2016 melt season was typical for Greenland summers in the past decade. Comparing the progression of melt area for 2016 with the three highest melt extent years (2012, 2010, and 2007) shows that while 2016 had a high early-season melt area, the pace slowed in mid-July relative to the warmest years. Greenland’s 2016 daily melt extent area anomaly (difference from the daily extent average extent for the 1981 to 2010 average) was approximately 90,000 square kilometers (34,800 square miles) per day.
Dark ice, high melt, warm air

Figure 5. The top map shows the summer albedo (reflectivity) anomaly for Greenland in 2016. The inset map is a closer look at a region of unusually low albedo (e.g., dark ice). A nearby Greenlandic town, Tasiilaq, had record warm air temperatures in the summer of 2016 with records stretching 121 years from 1895 (bottom graph).
Credit: Jason Box, Geological Survey of Denmark
High-resolution image
Greenland’s warm summer, with significant coastal melting, led to darker-than-average areas with more bare ice as opposed to snow on ice. Albedo refers to the reflectivity of Earth surfaces; it is also a measure of the amount of light scattered and reflected in all directions from a surface. Areas of dark ice, or low albedo, are common along the western coast, but albedo values during the past summer were exceptionally low. This summer also experienced new areas of dark ice in isolated patches along the southeastern coast. Near the village of Tasiilaq, a strong positive melt-day anomaly exposed a large area of darker deep ice, and a weather station reported the warmest summer on record there (records since 1895). Narsarsuaq, near the southern tip of the island, also had the warmest summer on record (records since 1961), and the capital city of Nuuk along the southwestern coast recorded the second-warmest summer (records since 1873). The area near Kangerlussuaq (‘Kanger’ on the map) did not set a record, but recorded a much warmer-than-average summer, with some areas setting daily records in April (records since 1958).
Melting, melting

Figure 6. This graph shows a comparison of measured and modeled elevation loss due to surface melt for several Danish-operated weather stations (solid lines) and the MAR model at those sites (dashed lines). The locations of the stations are shown in Figure 5.
Credit: Dr. X. Fettweis, University of Liege, Belgium
High-resolution image
Melting leads to a lowering of the ice sheet surface, and the scale can be significant. Moreover, the climate community relies on climate models to conduct forecasts and estimates, since data from the ice sheet or from satellites can be sparse. By comparing the results of the MAR 3.5.2 model of the Greenland Ice Sheet with weather and surface measurement data from the network of automated weather stations operated by the Geological Survey of Denmark (GEUS), called Programme for the Monitoring of the Greenland Ice Sheet (PROMICE), we can evaluate the accuracy of the model. The data and model both show that several meters of ice melted during the summer of 2016 around the perimeter of Greenland and that, except for two low sites (not well resolved at the 20-kilometer MAR resolution), the MAR model compares well with observations.
Thanks to X. Fettweis, J. Box, T. Mote, D. van As, and C. Shuman for contributions to this post.
Further reading
MAR climate model of Greenland
Geological Survey of Denmark (GEUS) Greenland weather network
Dr. Jason Box’s site discussing reflectivity and albedo on Greenland
 Scientists
 Research Grants
 Scientific Publications
 Informatics Research
 NSIDC Scientific Expeditions
 Scientists blog from Antarctica and provide a glimpse of what it's like to do research in the field.