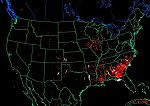
| Automated Biomass Burning Algorithm (ABBA) | Product developed by the biomass burning monitoring team at CIMSS using the GOES Imager to detect and monitor fires (wildfires, prescribed burns and agricultural burns) throughout the Western Hemisphere. Automated Biomass Burning Algorithm (ABBA) - from CIMSS More Information |
|
|
||
| GOES | Resolution: 4 Km | Frequency: 30 Minutes |
| Biomass Burning Emissions Product (BBEP) |
The Blended-BBEP and GBBEPx are continuous products of biomass burning emissions, which are used to replace previous operational product. Previously, the Geostationary Operational Environmental Satellite Biomass Burning Emission Products (GBBEP) are produced from GOES-E and GOES-W fire products separately. Current Blended-BBEP and GBBEPx are produced by blending fires detected from GOES-E, GOES-W, MODIS, and AVHRR. The outputs are written in both ASCII and netCDF files which include burned area and all emission species (PM2.5, CO, CH4, CO2, TNMHC, NH3, N2O, NOX, and SO2). Product Links: Blended BBEP and GBBEPx |
|
|
|
||
| GOES and POES | Resolution: 4km | Frequency: 6 hours and daily |
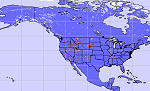
| Fire Id, Mapping and Monitoring Algorithm (FIMMA) | The FIMMA is an automated algorithm to detect fires from Advanced Very High Resolution Radiometer (AVHRR) data from NOAA polar-orbiting satellites. The FIMMA product was developed by CIRA by modifying an algorithm developed at the University of Maryland. The current version uses geo-corrected High Resolution Picture Transmission (HRPT) AVHRR data over the US (including Alaska and Hawaii). Product Link |
|
|
||
| POES | Resolution: 1 Km | Frequency: Orbital |
| Fire Product Archive | Archive of Fire Products for up to 90 days. Availbility is divided into "Current Day", "Last 2 Days", "Last 7 Days" and "Longer Term Archive" time periods. Products include ABBA-GOES, FIMMA-AVHRR and MODIS in both graphic and text format, plus HMS data in graphic, text, GIS and KML formats. | |
|
|
||
| GOES and POES | Resolution: Varies | Frequency: Archive |
| GOES Aerosol Smoke Products (GASP) | Product provides aerosol optical depth (AOD) using GOES visible channel imagery and utilizes a cloud screening algorithm. A look-up table is used to estimate the AOD using the difference in reflectance between current cloud free pixels and those of a 28 day clear sky composite image. Over the GASP-East domain, the automated smoke detection and tracking algorithm (ASDTA) uses a source apportionment technique to derive AOD associated with fires. Product Links: GASP-East AOD and ASDTA Smoke-East AOD GASP-West AOD and ASDTA Smoke-West AOD |
|
|
||
| GOES | Resolution: 4 Km | Frequency: 30 Minutes |
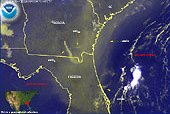
| Hazard Mapping System (HMS) Fire and Smoke Analysis | Product shows the detected hot spots and smoke plumes indicating possible fire locations. This is a blended product using algorithms for the GOES Imager, the POES AVHRR and MODIS. A quality control procedure is performed by an analyst on the automated fire detections. Significant smoke plumes that are detected by the satellites are outlined by the analyst as well with an estimate of the smoke concentration provided. This product is created and updated as needed between 1 PM and 11 PM Eastern time. After 11 PM the analysis is fine-tuned as time permits. The graphical HMS product is finalized once daily. Product Link |
|
|
||
| GOES and POES | Resolution: 4 Km | Frequency: Daily |
| Fire Risk | Product shows the area, intensity, and duration of vegetation stress using AVHRR data. Fire potential and danger can be estimated from color coded maps. Fire potential is based on intensity and duration of moisture and thermal stress. If severe stress (index less than 15) continues for one week fire potential is minimal, while it reaches maximum if this condition continues for five weeks and longer. Fire potential is higher for severe and longer stress. A high level of fire potential (red) due to both moisture and temperature conditions can be used as a fire danger warning. Product Link |
|
|
||
| POES | Resolution: 4 Km | Frequency: Weekly |
| Smoke Text Product | This text product is an analysis of the visible smoke plumes over North America and primarily covers those affecting the U.S. If a source of the plume is known, that information may also be included. Product Link |
|
|
||
| GOES and POES | Resolution: N/A | Frequency: Twice Daily |
| Web Based GIS Fire Analysis | This product shows the detected hot spots and smoke plumes indicating possible fire locations and allows users to zoom into areas of interest using GIS technology. Product Link |
|
|
||
| GOES and POES | Resolution: 4 Km | Frequency: Daily |
| Fire/Smoke/Hot Spot Imagery | Satellite Imagery showing Hot Spots indicating the presence of fire, and visible imagery depicting smoke. Various enhancements are used on both GOES and POES Satellite Imagery to increase visibility. Extreme historical cases (after August 1, 2010) may be showcased by the NOAA Environmental Visualization Laboratory (EVL). Three GOES sectors have been established to provide real time imagery and a page of up to eight floaters has recently been added (Four GOES-East and Four Goes-West). Fire/Hot Spot: Floaters Fire/Hot Spot Sectors: Florida | Northern California | Southern California GOES-East Sectors: Regional | WFO Sectors GOES-West Sectors: Regional | WFO Sectors |
|
|
||
| GOES and POES | Resolution: Varies | Frequency: Varies |