NSIDC Data on Google
Earth
The National Snow and Ice Data Center offers some of our
data in the form of images. From these, we have created Google Earth™ files
that enable you to view them on a virtual
globe. Our goal is to help people better understand the cryosphere—where
the world is frozen—by making our data more visible and interactive. Featured Data highlights some of our
most requested data, as well as our newest Google Earth files.
Featured Data
 |
September
Sea Ice Extent, 1979-2016
Compare over 30 years of September
sea ice minimum extent images from satellites for both the Arctic and the Antarctic.
Download: September
Sea Ice Extent, 1979-2016 (KMZ,
392 KB, Updated 2016)
Data Source: Sea Ice Index
|
 |
Sea Ice Minimum and Maximum Extents, 1979 to Present
View Arctic and Antarctic sea
ice extents from 1979 through present for the months March (maximum sea ice extents) and September (minimum sea ice extents).
Download: Sea Ice: Minimum and Maximum Extents (KMZ, 845 KB, Updated 2016).
Data Source: Sea Ice Index
Note: September is the default month when the file is opened. To see March, click on the March layer in the Google Earth side panel.
|
 |
A Climate Change Tour of Cold Places
A narrated tour of the snowy and icy regions of the world covering sea ice, glaciers, ice shelves, and permafrost.
Download: Climate Change Tour of Cold Places (KML, 32 KB)
Data Source: A Climate Change Tour for a K-12 Audience
Note: This was a collaborative project between NSIDC and the University of Colorado at Boulder School of Education.
Also see: Scientists Answer Student's Questions about the Cryosphere
|
 |
Wilkins
Ice Bridge Collapse, February-April 2009
View a time series of satellite
images showing the break up of an ice bridge that was shoring up
the Wilkins ice shelf.
Download: Wilkins
ice bridge collapse file for Google Earth (KMZ, 547 KB)
Data Source: Moderate Resolution Imaging
Spectroradiometer (MODIS)
|
View More Snow, Ice, Glaciers, Permafrost,
and Sea Ice on the Globe
 |
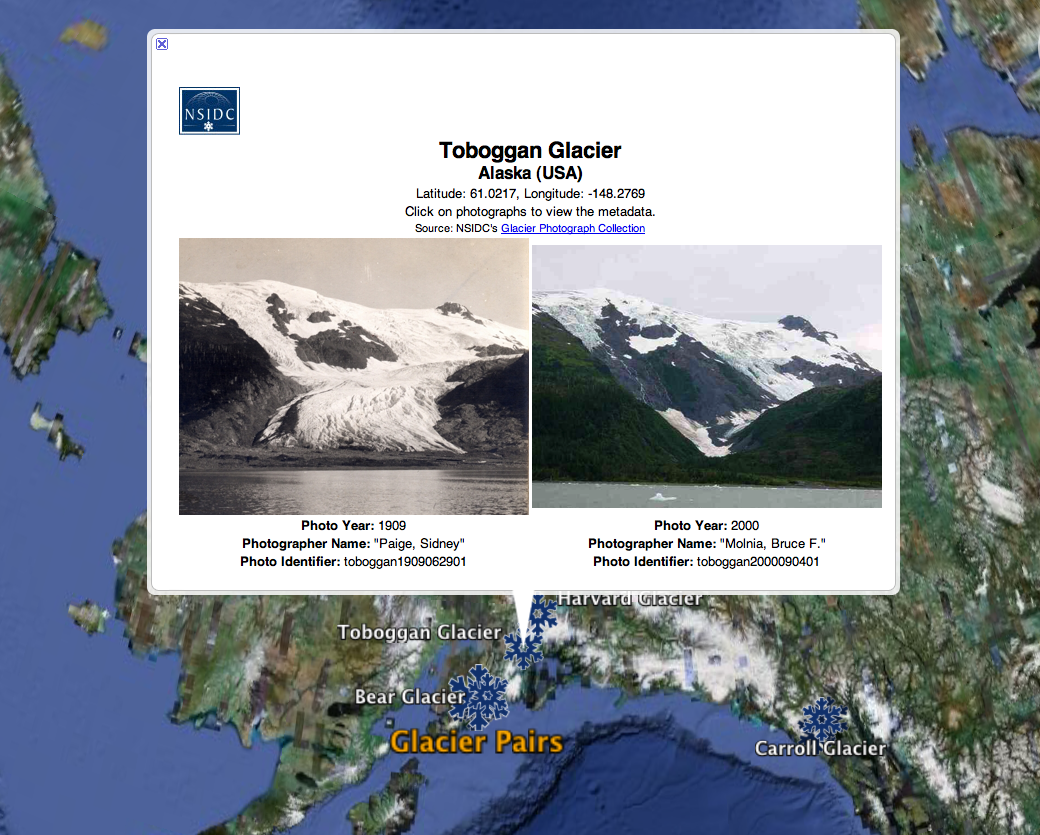
Glaciers and
Climate Change
View glacier photograph pairs
showing how some glaciers have changed over time.
Download: Glaciers
and climate change file
for Google Earth (KML,
48 KB)
Data Source: Glacier Photograph Collection
|
 |
Changes
in Glaciers, the Larsen B Ice Shelf, and Arctic Sea Ice Extent
View photographs showing long-term
changes in glaciers; watch the disintegration of the Larsen B ice
shelf; and view Arctic and Antarctic sea ice extents from 1979
through present.
Download: Glaciers,
ice shelves, and sea ice file for Google Earth (KML,
8 KB)
Data Sources: Glacier Photograph
Collection, Sea Ice Index, and Animation
of Larsen B breakup |
 |
Glaciers, Permafrost, and Ground Ice
View photographs of more than
10,000 glaciers, 1880s to present, and permafrost and ground ice types
and extents in the Northern Hemisphere.
Download: Glaciers and permafrost file for Google Earth (KML,
6 KB)
Data Source: Glacier Photograph Collection and Circum-Arctic
Map of Permafrost and Ground-Ice Conditions |
 |
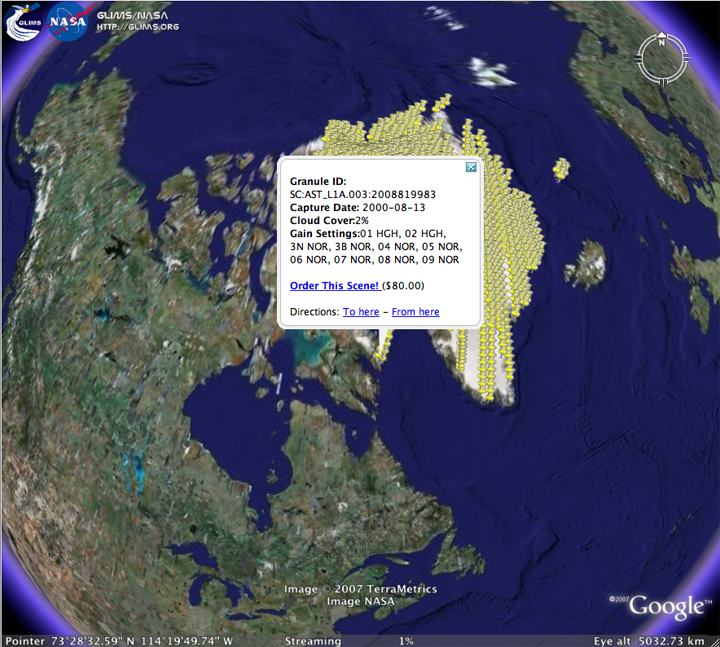
Glaciers:
GLIMS ASTER Glacier Footprints
View approximately 150,000
ASTER browse images over regions of the world where glaciers exist, from 2000-present.
Download: GLIMS
ASTER glacier footprints file (KMZ, 4 KB)
Data Sources: GLIMS Glacier Database and Terra
ASTER Metadata Inventory, EROS |
 |
Greenland
Annual Surface Melt, 1979 - 2007
View the extent and frequency
of surface melt for the Greenland ice sheet.
Download: Greenland
melt file for Google Earth (KMZ,
404 KB)
Data Source: Greenland Ice Sheet
Melt Characteristics Derived from Passive Microwave Data |
 |
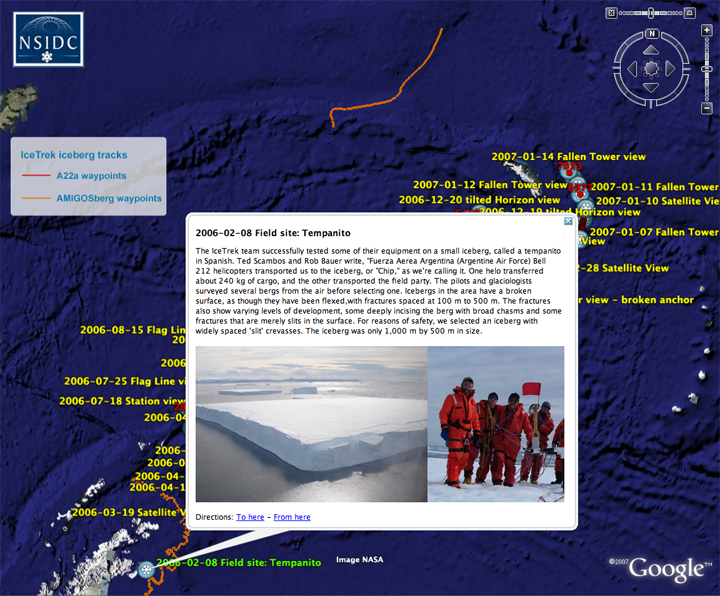
Icebergs:
IceTrek Iceberg Tracks
Explore the life cycle of drifting
Antarctic icebergs, and view photos from instruments riding on
the bergs.
Download: IceTrek
iceberg tracks file (KMZ, 6.7 MB)
Data Source: IceTrek Web site |
 |
Ice
Shelves: Breakup of the Larsen B Ice Shelf
Watch the disintegration of
the Larsen B ice shelf in 2002, as captured in MODIS satellite
images.
Download: Larsen
B ice shelf file for Google Earth (KMZ, 3 MB)
Data Source: Animation
of Larsen B breakup |
 |
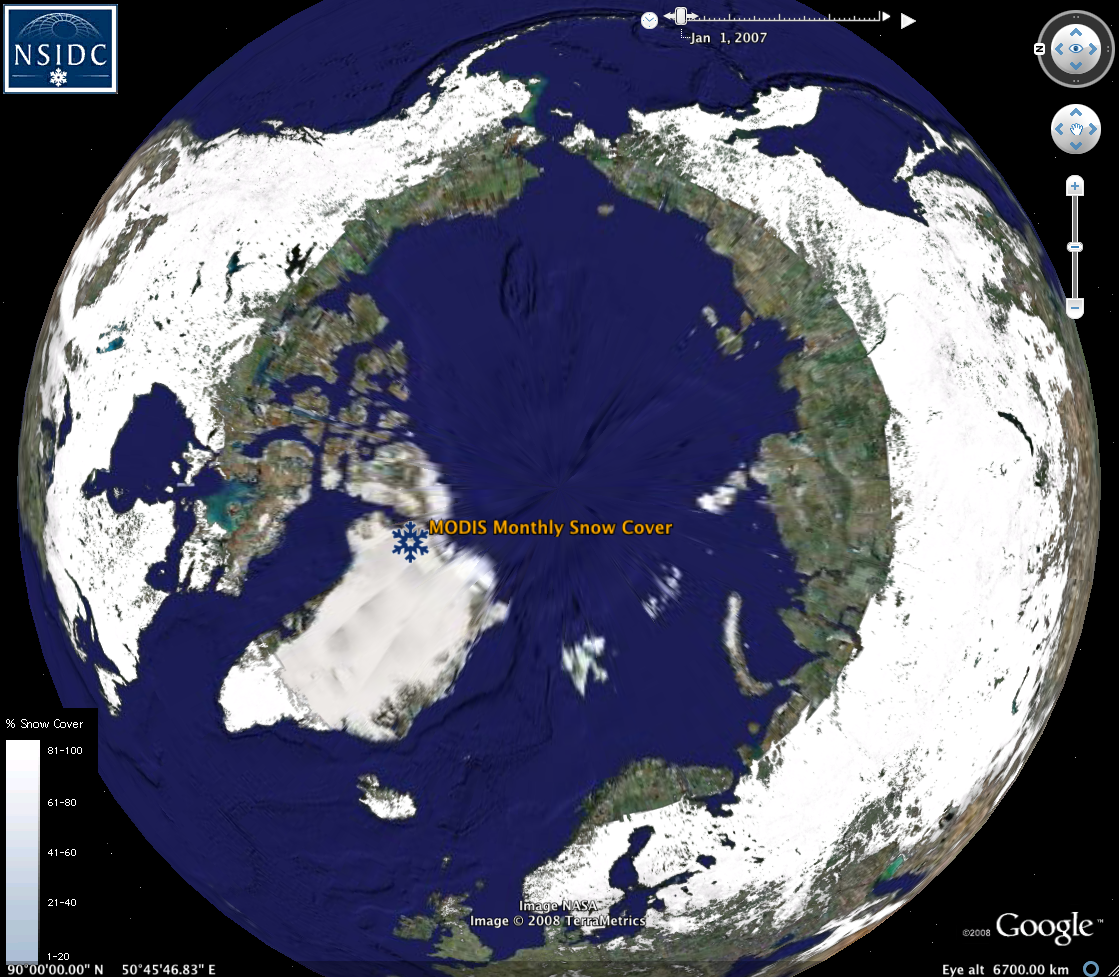
Global Snow Cover from MODIS
View global, monthly average
snow cover by month for 10 years: 2000-2009.
Download:
Data Source: MODIS/Terra Snow Cover Monthly L3 Global 0.05Deg CMG, Version 5
Note: This time series runs from October 2000 to May 2009. The following months are missing: March 2002 and December 2003 |
 |
Sea
Ice: Nordic Seas Ice Edge
View changes in the sea ice
edge in the Nordic Seas, from 1967 to 2002, for the months March
through August.
Download: Nordic
Seas ice edge (KML, 892 KB)
Data Source: March through August
Ice Edge Positions in the Nordic Seas, 1750-2002 |
Locate Cryospheric Field Data
Sets on the Globe
|
|
 Scientists
 Research Grants
 Scientific Publications
 Informatics Research
 NSIDC Scientific Expeditions
 Scientists blog from Antarctica and provide a glimpse of what it's like to do research in the field. Read their blog ...
 What's hot in the news around climate and sea ice and what are scientists talking about now? Read more...