By now, you probably know the drill: a little bit of discussion about a particular subject, throw in a few pop culture references, maybe a video or two, then get to the good stuff – high quality VIIRS imagery. Then, maybe add some follow-up discussion to emphasize how VIIRS can be used to detect, monitor, or improve our understanding of the subject in question. Not today.
You see, VIIRS is constantly taking high quality images of the Earth (except during orbital maneuvers or rare glitches). There isn’t enough time in a day to show them all, or go into a detailed discussion as to their relevance. And, nobody likes to read that much anyway. So, as we busily prepare for the upcoming holidays, we’re going to skip the in-depth discussion and get right to the good stuff.
Here then is a sample of interesting images taken by VIIRS over the years that weren’t featured on their own dedicated blog posts. Keep in mind that they represent the variety of topics that VIIRS can shed some light on. Many of these images represent topics that have already been discussed in great detail in previous posts on this blog. Others haven’t. It is important to keep in mind… See, I’m starting to write too much, which I said I wasn’t going to do. I’ll shut up now.
Without further ado, here’s a VIIRS Natural Color image showing a lake-effect snow event that produced a significant amount of the fluffy, white stuff back in November 2014:

VIIRS Natural Color RGB composite of channels M-5, M-7 and M-10 (18:20 UTC 18 November 2014)
As always, click on the image to bring up the full resolution version. Did you notice all the cloud streets? How about the fact that the most vigorous cloud streets have a cyan color, indicating that they are topped with ice crystals? The whitish clouds are topped with liquid water and… Oops. I’m starting to discuss things in too much detail, which I wasn’t going to do today. Let’s move on.
Here’s another Natural Color RGB image using the high-resolution imagery bands showing a variety of cloud streets and wave clouds over the North Island of New Zealand:

VIIRS Natural Color RGB composite of channels I-1, I-2 and I-3 (02:55 UTC 3 September 2016)
Here’s a Natural Color RGB image showing a total solar eclipse over Scandinavia in 2015:
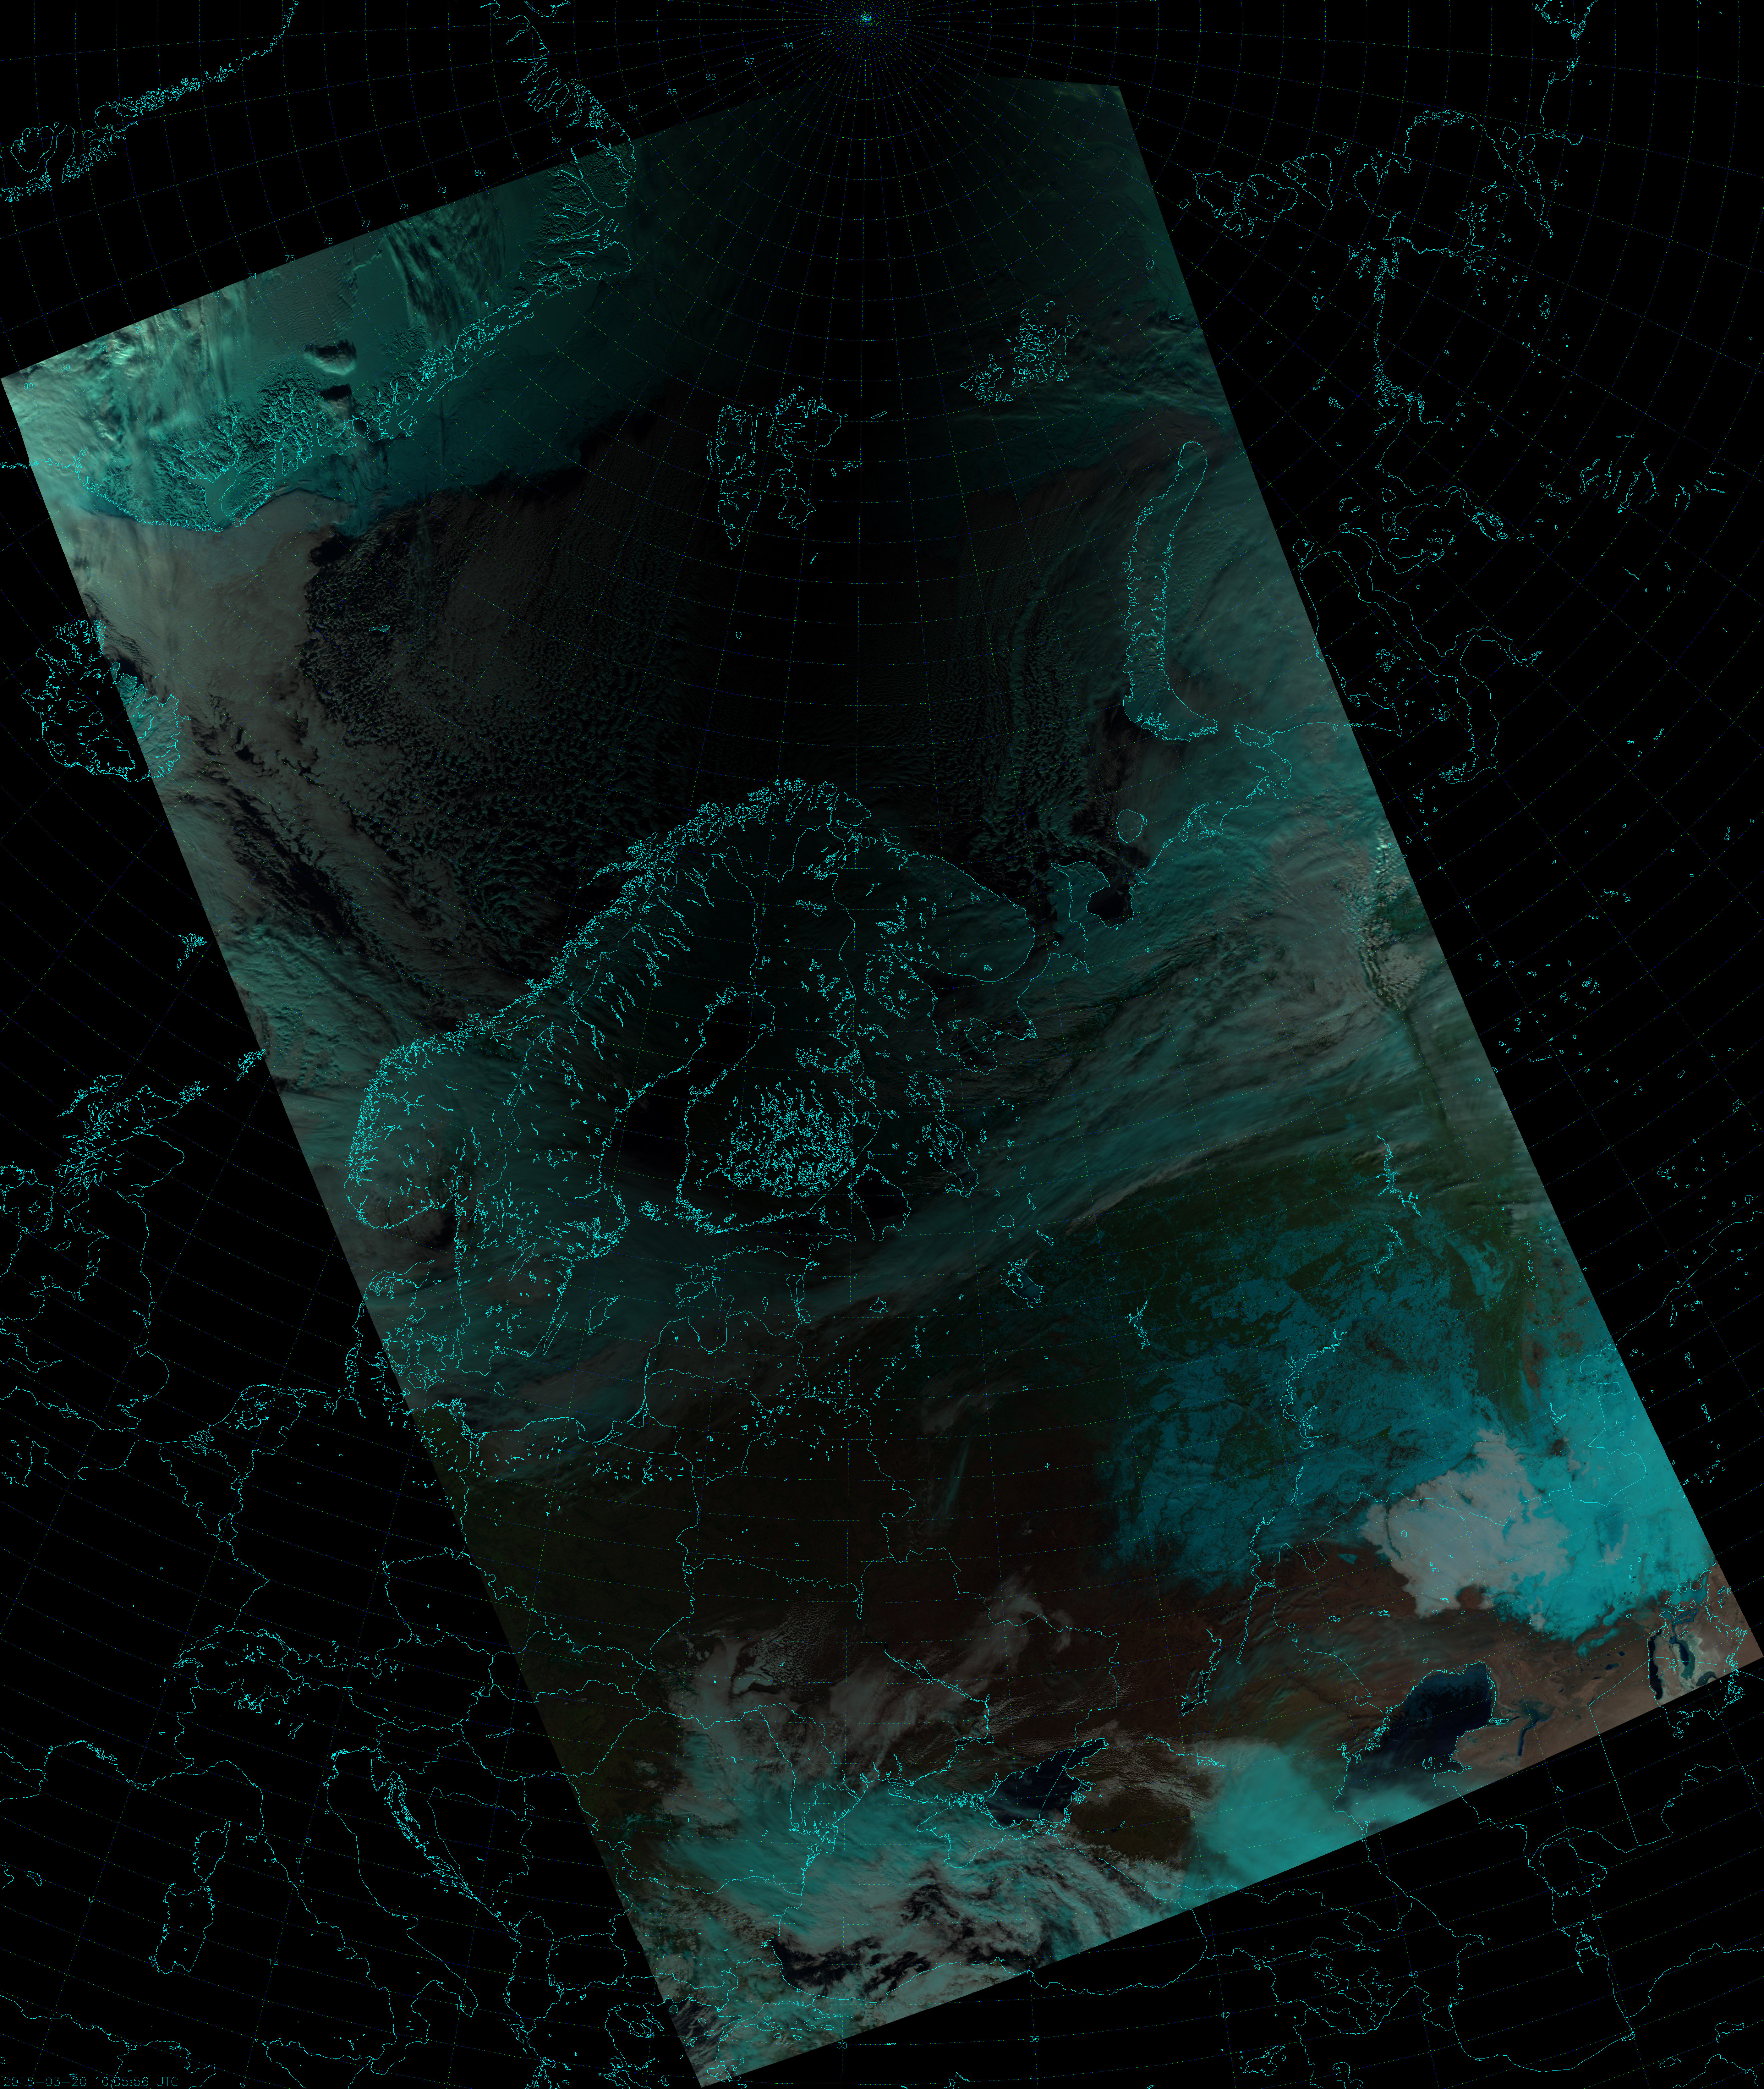
VIIRS Natural Color RGB composite of channels M-5, M-7 and M-10 (10:06 UTC 20 March 2015)
Here’s a VIIRS True Color image and split-window difference (M-15 – M-16) image showing volcanic ash from the eruption of the volcano Sangeang Api in Indonesia in May 2014:

VIIRS True Color RGB composite of channels M-3, M-4 and M-5 (06:20 UTC 31 May 2014)

VIIRS split-window difference (M-15 – M-16) image (06:20 UTC 31 May 2014)
Here’s a VIIRS True Color image showing algae and blowing dust over the northern end of the Caspian Sea (plus an almost-bone-dry Aral Sea):

VIIRS True Color RGB composite of channels M-3, M-4 and M-5 (09:00 UTC 18 May 2014)
Here is a high-resolution infrared (I-5) image showing a very strong temperature gradient in the Pacific Ocean, off the coast of Hokkaido (Japan):

VIIRS I-5 (11.45 um) image (03:45 UTC 12 December 2016)
The green-to-red transition just southeast of Hokkaido represents a sea surface temperature change of about 10 K (18 °F) over a distance of 3-5 pixels (1-2 km). This is in a location that the high-resolution Natural Color RGB shows to be ice- and cloud-free:

VIIRS Natural Color RGB composite of channels I-1, I-2 and I-3 (03:45 UTC 12 December 2016)
Here’s a high-resolution infrared (I-5) image showing hurricanes Madeline and Lester headed toward Hawaii from earlier this year:

VIIRS I-5 (11.45 um) image (22:55 UTC 30 August 2016)
Here are the Fire Temperature RGB (daytime) and Day/Night Band (nighttime) images of a massive collection of wildfires over central Siberia in September 2016:

VIIRS Fire Temperature RGB composite of channels M-10, M-11 and M-12 (05:20 UTC 18 September 2016)

VIIRS Day/Night Band image (19:11 UTC 18 September 2016)
Here is a 5-orbit composite of VIIRS Day/Night Band images showing the aurora borealis over Canada (August 2016):

Day/Night Band image composite of 5 consecutive VIIRS orbits (30 August 2016)
Here is a view of central Europe at night from the Day/Night Band:

VIIRS Day/Night Band image (01:20 UTC 21 September 2016)
And, finally, for no reason at all, here’s is a picture of Spain wearing a Santa hat (or sleeping cap) made out of clouds:

VIIRS Natural Color RGB composite of channels M-5, M-7 and M-10 (13:05 UTC 18 March 2014)
There you have it. A baker’s ten examples showing a small sample of what VIIRS can do. No doubt it will be taking more interesting images over the next two weeks, since it doesn’t stop working over the holidays – even if you and I do.