Economic Indicators


|
Manufacturing and Trade Inventories and SalesU.S. total business end-of-month inventories for November 2016 were $1,827.5 billion, up 0.7 percent (+/- 0.1 percent) from last month. U.S. total business sales were $1,326.7 billion, up 0.1 percent (+/-0.2 percent)* from last month.
Current Press Release -
|
Archived Releases -
Historic Time Series - |
Released:
Next Release:
|
November 2016
+0.7 |
|
|
|
Advance Monthly Sales for Retail and Food ServicesU.S. retail and food services sales for December were $469.1 billion, an increase of 0.6 percent (+/-0.5%) from the previous month.
Current Press Release -
|
Archived Releases -
Historic Time Series - |
Released:
Next Release:
|
December 2016
+0.6 |
|
|
|
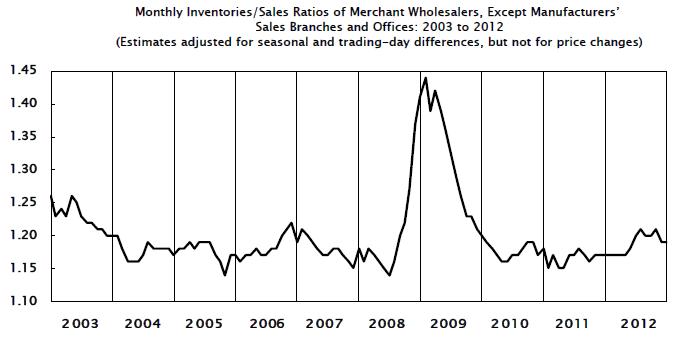
Monthly Wholesale TradeNovember 2016 sales of merchant wholesalers were $452.6 billion, up 0.4 percent (+/- 0.5 percent)* from last month. End-of-month inventories were $595.3 billion, up 1.0 percent (+/- 0.2 percent) from last month.
Current Press Release -
|
Archived Releases -
Historic Time Series - |
Released:
Next Release:
|
November 2016
+1.0 |
|
|
|
Manufacturers' Shipments, Inventories, and OrdersNew orders for manufactured goods in November decreased $11.3 billion or 2.4 percent to $458.3 billion.
Current Press Release -
|
Archived Releases -
Historic Time Series - |
Released:
Next Release:
|
November 2016
-2.4° |
|
|
|
U.S. International Trade in Goods and Services DeficitThe Nation's international trade deficit in goods and services increased to $45.2 billion in November from $42.4 billion in October (revised), as exports decreased and imports increased.
Current Press Release -
|
Archived Releases -
Historic Time Series - |
Released:
Next Release:
|
November 2016
45.2° |
|
|
|
Construction SpendingTotal construction activity for November 2016 ($1,182.1 billion) was 0.9 percent (+/-1.5%)* above the revised October 2016 ($1,171.4 billion).
Current Press Release -
|
Archived Releases -
Historic Time Series - |
Released:
Next Release:
|
November 2016
+0.9* |
|
|
|
Advance Monthly Retail InventoriesNovember 2016 end-of-month inventories were $609.6 billion, an increase of 1.0 percent (+/- 0.2%) from last month.
Current Press Release -
|
Archived Releases -
Historic Time Series - |
Released:
Next Release:
|
November 2016
+1.0 |
October 2016 (r) -0.4 |
|
|
Advance U.S. International Trade in GoodsThe advance international trade deficit in goods increased to $65.3 billion in November from $61.9 billion in October as exports decreased and imports increased.
Current Press Release -
|
Archived Releases -
Historic Time Series - |
Released:
Next Release:
|
November 2016
65.3° |
October 2016 61.9° |
|
|
Advance Monthly Wholesale InventoriesNovember end-of-month inventories were $594.5 billion, up 0.9 percent (+/- 0.2 percent) from last month.
Current Press Release -
|
Archived Releases -
Historic Time Series - |
Released:
Next Release:
|
November 2016
+0.9 |
|
|
|
New Residential SalesSales of new single-family houses in November 2016 were at a seasonally adjusted annual rate of 592,000. This is 5.2 percent (+/- 14.1%)* above the revised October 2016 estimate of 563,000.
Current Press Release -
|
Archived Releases -
Historic Time Series - |
Released:
Next Release:
|
November 2016
+5.2* |
|
|
|
Advance Report on Durable Goods Manufacturers' Shipments, Inventories, and OrdersNew orders for manufactured durable goods in November decreased $11.0 billion or 4.6 percent to $228.2 billion.
Current Press Release -
|
Archived Releases -
Historic Time Series - |
Released:
Next Release:
|
November 2016
-4.6° |
|
|
|
New Residential ConstructionPrivately-owned housing starts in November 2016 were at a seasonally adjusted annual rate of 1,090,000. This is 18.7 percent (+/- 6.7%) below the revised October 2016 estimate of 1,340,000.
Current Press Release -
|
Archived Releases -
Historic Time Series - |
Released:
Next Release:
|
November 2016
-18.7 |
October 2016 (r) +27.4 |
|
|
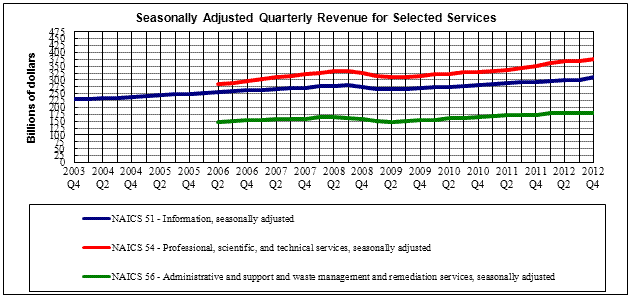
Quarterly Services SurveyThe estimate of U.S. selected services total revenue for the third calendar quarter of 2016, not adjusted for seasonal variation or for price changes, was $3,512.5 billion, an increase of 1.6 percent (+/- 0.2%) from the second quarter of 2016 and up 5.3 percent (+/- 0.6%) from the third quarter of 2015. The first quarter of 2016 to second quarter of 2016 percentage change was not revised from 3.4 percent (+/- 0.4%).
Current Press Release -
|
Archived Releases -
Historic Time Series - |
Released:
Next Release:
|
3rd Qtr 2016
+1.6 |
2nd Qtr 2016 +3.4 |
|
|
Quarterly Financial Report - Retail TradeSeasonally adjusted after-tax profits for retail corporations with assets of $50 million and over were $23.9 billion for the third quarter 2016 (the 3 months ending October 31, 2016), up $0.6 (+/- 0.1) billion from second quarter 2016 (the 3 months ending July 31, 2016).
Current Press Release -
|
Archived Releases -
Historic Time Series - |
Released:
Next Release:
|
3rd Qtr 2016
+0.6 |
2nd Qtr 2016 (r) +3.1 |
|
|
Quarterly Financial Report - Manufacturing, Mining, Wholesale Trade, and Selected Service IndustriesManufacturing corporations' seasonally adjusted after-tax profits were $138.3 billion for the third quarter of 2016, up $8.3 (+/- 0.3) billion from second quarter of 2016.
Current Press Release -
|
Archived Releases -
Historic Time Series - |
Released:
Next Release:
|
3rd Qtr 2016
+8.3 |
2nd Qtr 2016 (r) +7.4 |
|
|
Homeownership RateThe homeownership rate in the third quarter 2016, 63.5 percent, was not statistically different from the third quarter 2015 rate of 63.7 percent. The homeownership rates in the Northeast, Midwest, South and West were not statistically different from the rates in the third quarter 2015.
Current Press Release -
|
Archived Releases -
Historic Time Series - |
Released:
Next Release:
|
3rd Qtr 2016
+63.5* |
3rd Qtr 2015 +63.7 |
|
|
Rental Vacancy RateThe rental vacancy rate in the third quarter 2016 was 6.8 percent, down 0.5 (+/- 0.4) percentage points from the third quarter 2015 rate of 7.3 percent. The rental vacancy rate in the West was lower than the rate in the third quarter 2015, while the rates in the Northeast, Midwest and South were not statistically different from the rates in the third quarter 2015.
Current Press Release -
|
Archived Releases -
Historic Time Series - |
Released:
Next Release:
|
3rd Qtr 2016
+6.8 |
3rd Qtr 2015 +7.3 |


(*) The 90% confidence interval includes zero. The Census Bureau does not have sufficient statistical evidence to conclude that the actual change is different from zero.
(°) Statistical significance is not applicable or not measurable for these surveys. The Manufacturers’ Shipments, Inventories and Orders estimates are not based on a probability sample, so we can neither measure the sampling error of these estimates nor compute confidence intervals.
(r) Revised.
All estimates are seasonally adjusted except for the Rental Vacancy Rate, Home Ownership Rate, Quarterly Financial Report for Retail Trade, and Quarterly Services Survey. None of the estimates are adjusted for price changes.
[PDF] or denotes a file in Adobe's
Portable Document Format. To view the file, you will need the
Adobe® Reader®
![]() available
free from Adobe. [Excel] or indicate a document is in
the Microsoft® Excel® Spreadsheet Format (XLS). To view the file, you will need the
Microsoft® Excel® Viewer
available
free from Adobe. [Excel] or indicate a document is in
the Microsoft® Excel® Spreadsheet Format (XLS). To view the file, you will need the
Microsoft® Excel® Viewer
![]() available for free
from Microsoft®. This symbol
available for free
from Microsoft®. This symbol ![]() indicates
a link to a non-government web site. Our linking to these sites does not constitute an endorsement of any products,
services or the information found on them. Once you link to another site you are subject to the policies of the new site.
indicates
a link to a non-government web site. Our linking to these sites does not constitute an endorsement of any products,
services or the information found on them. Once you link to another site you are subject to the policies of the new site.


