Data Products Gallery

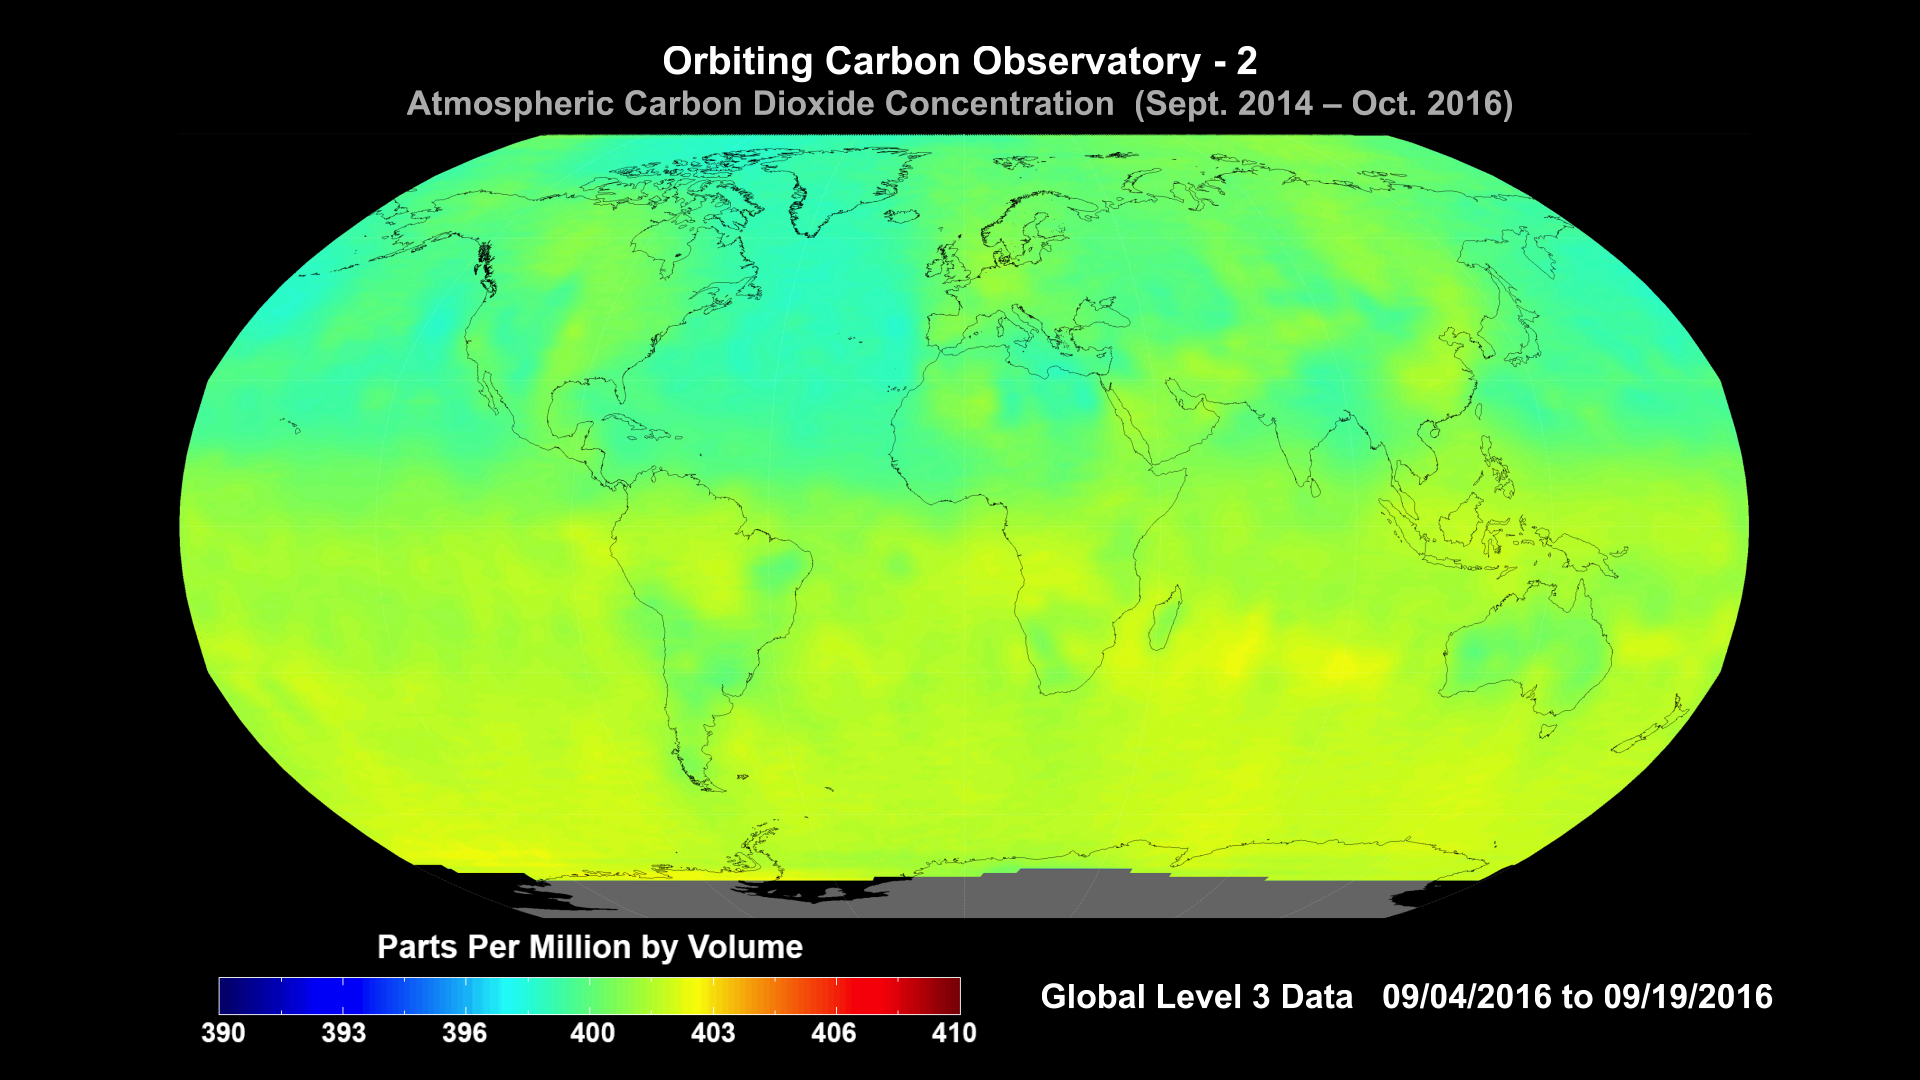
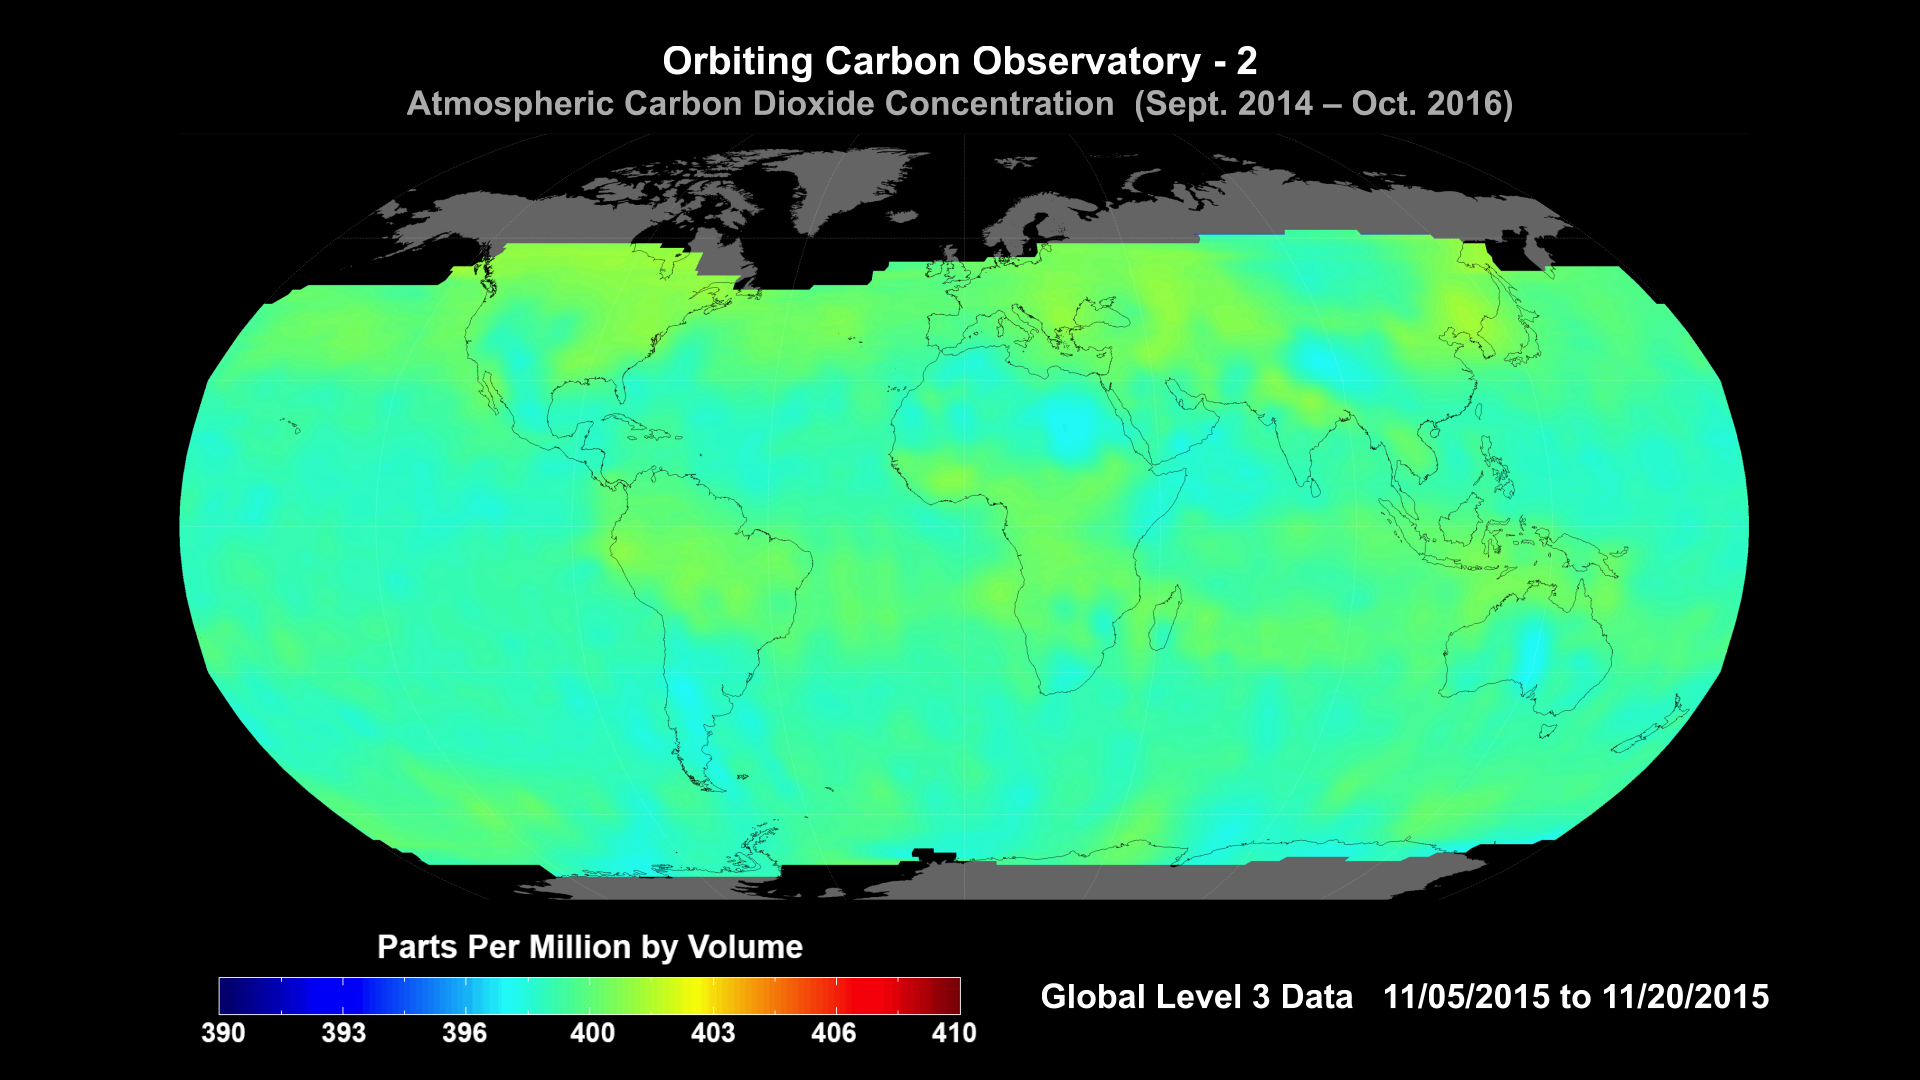
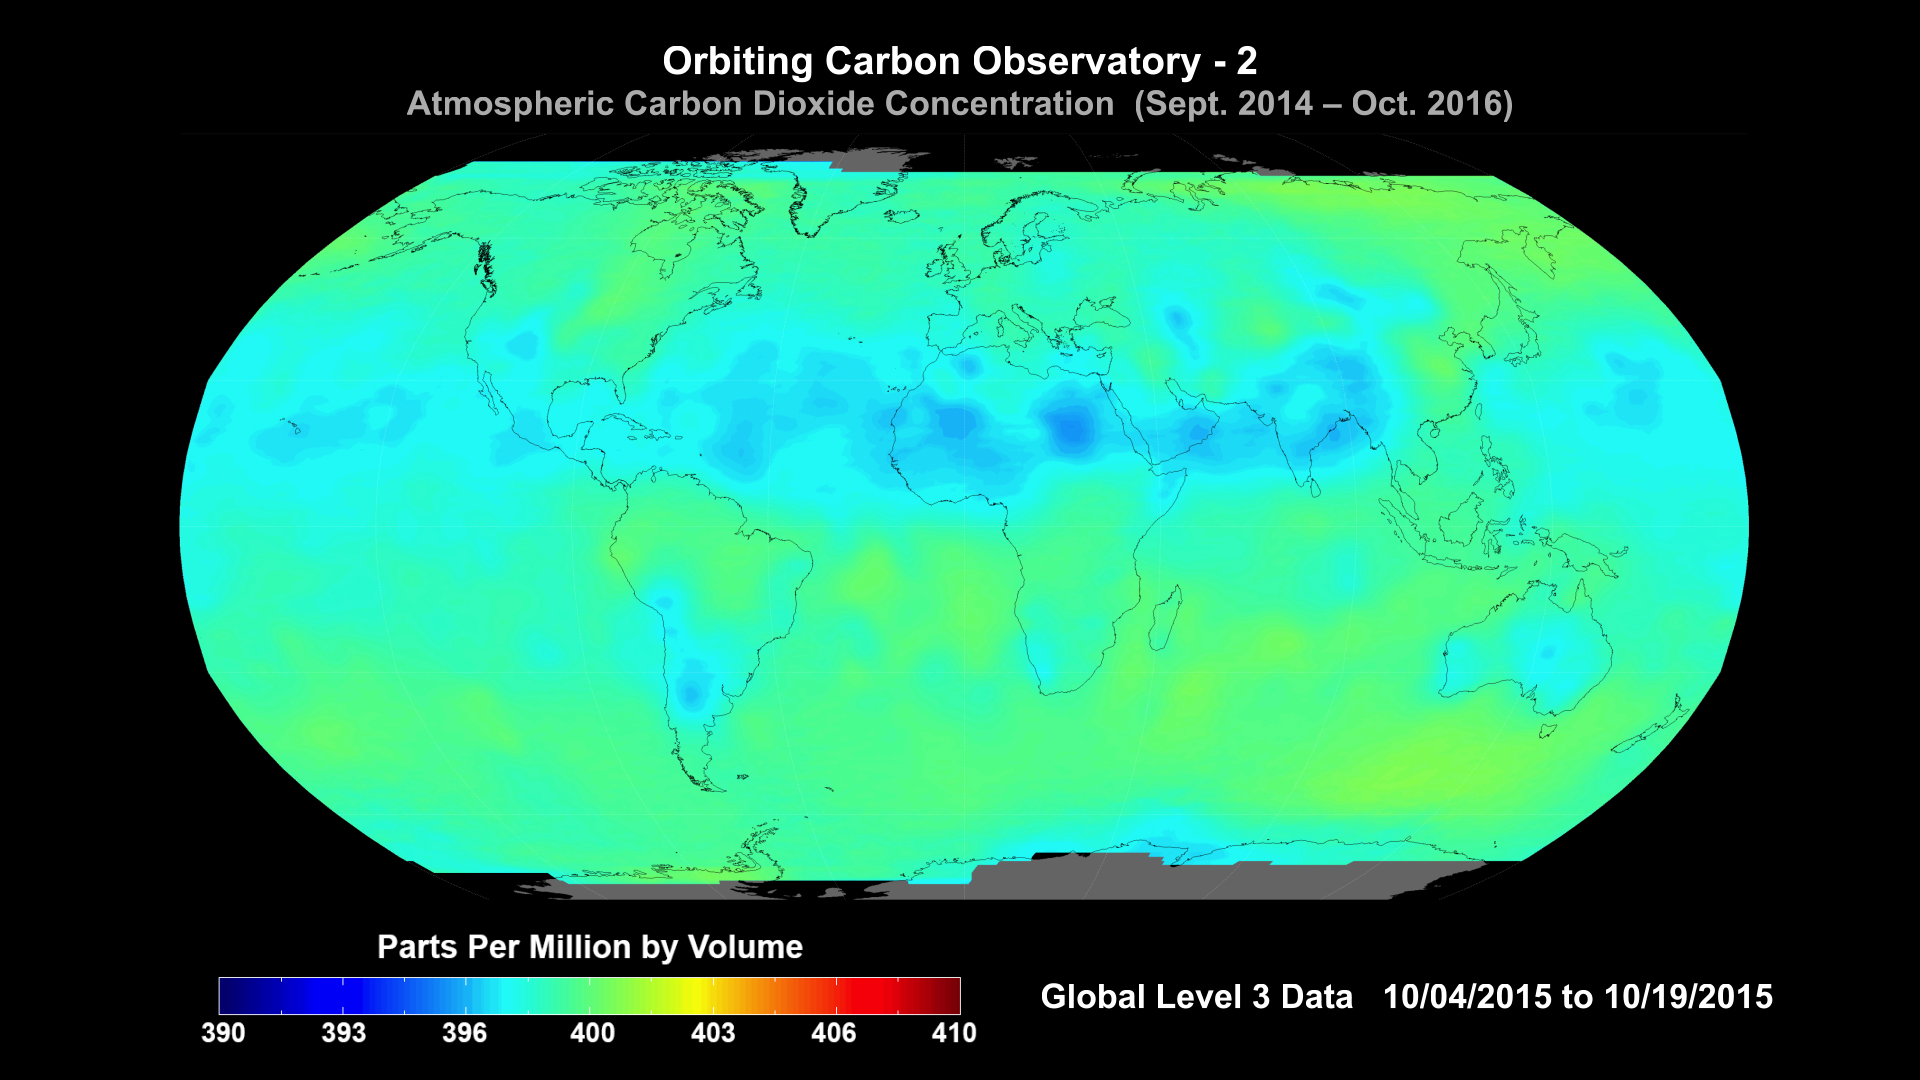
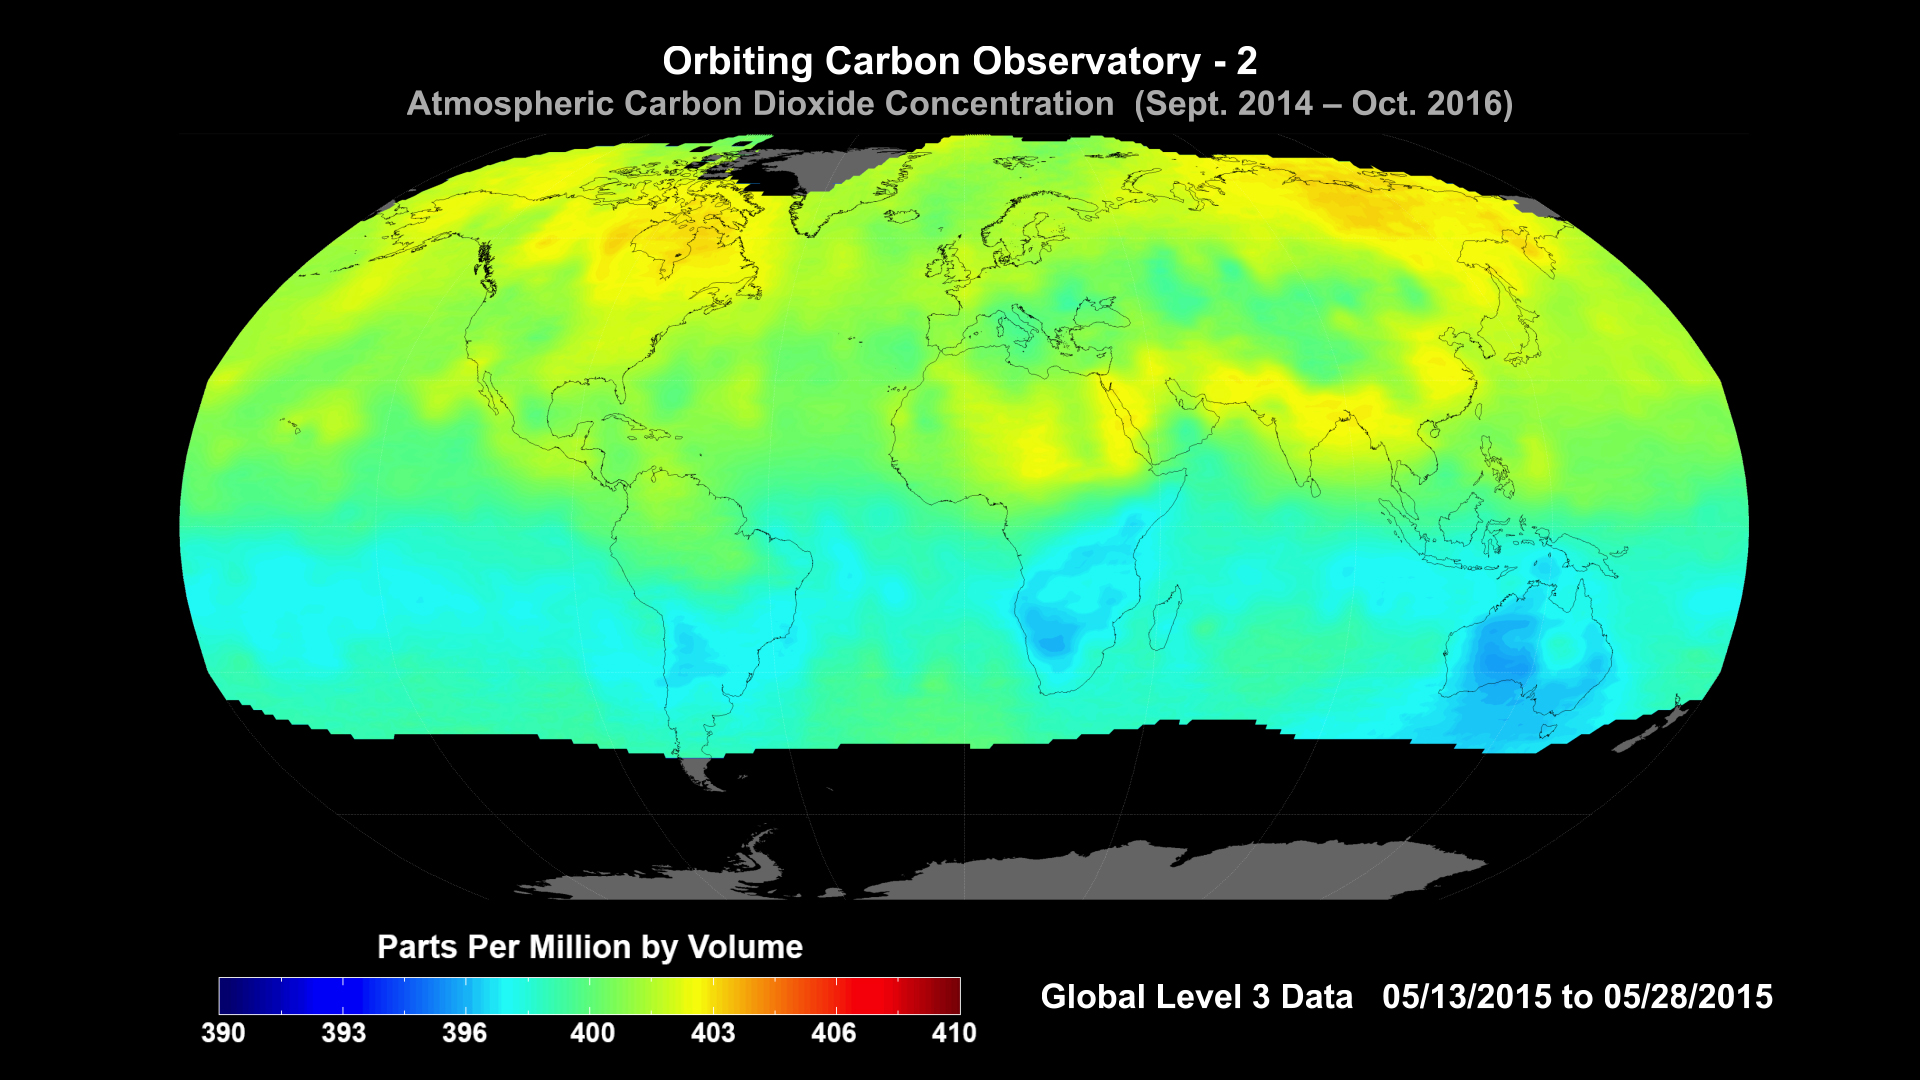
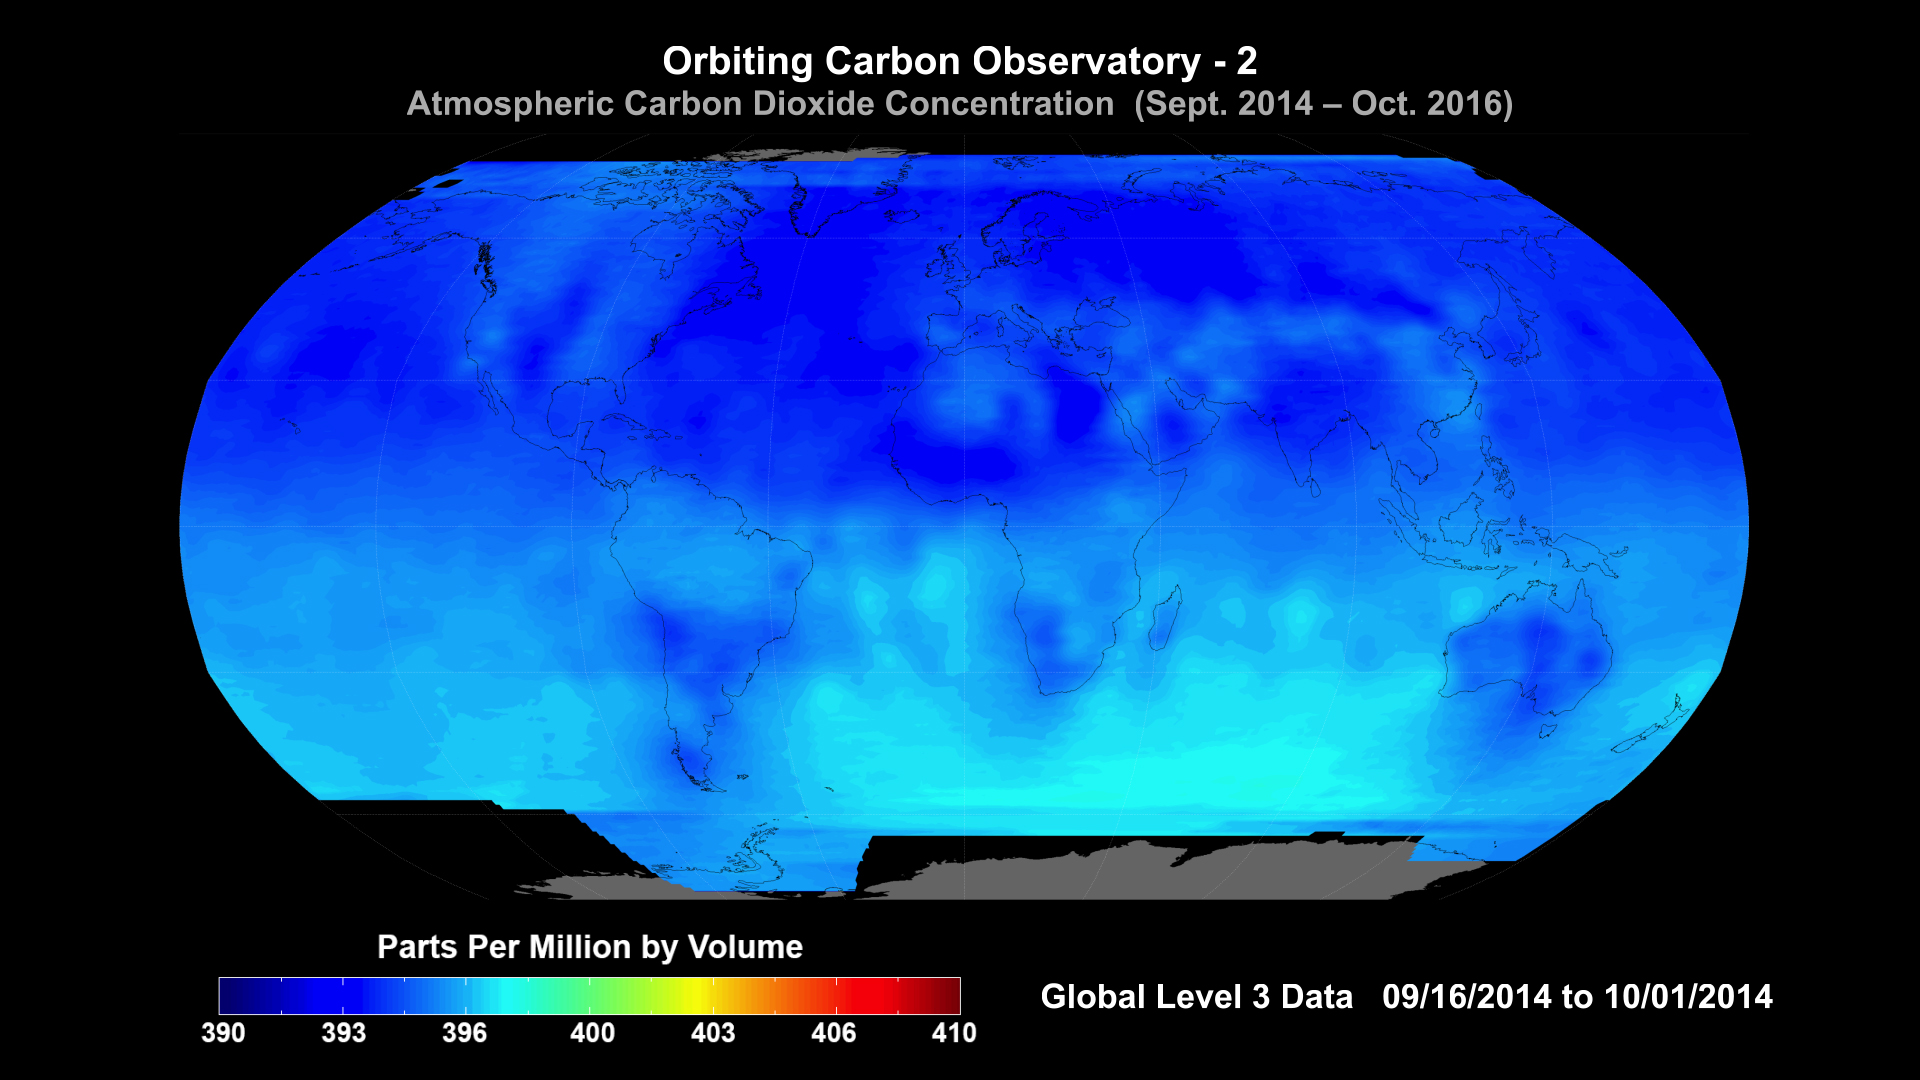
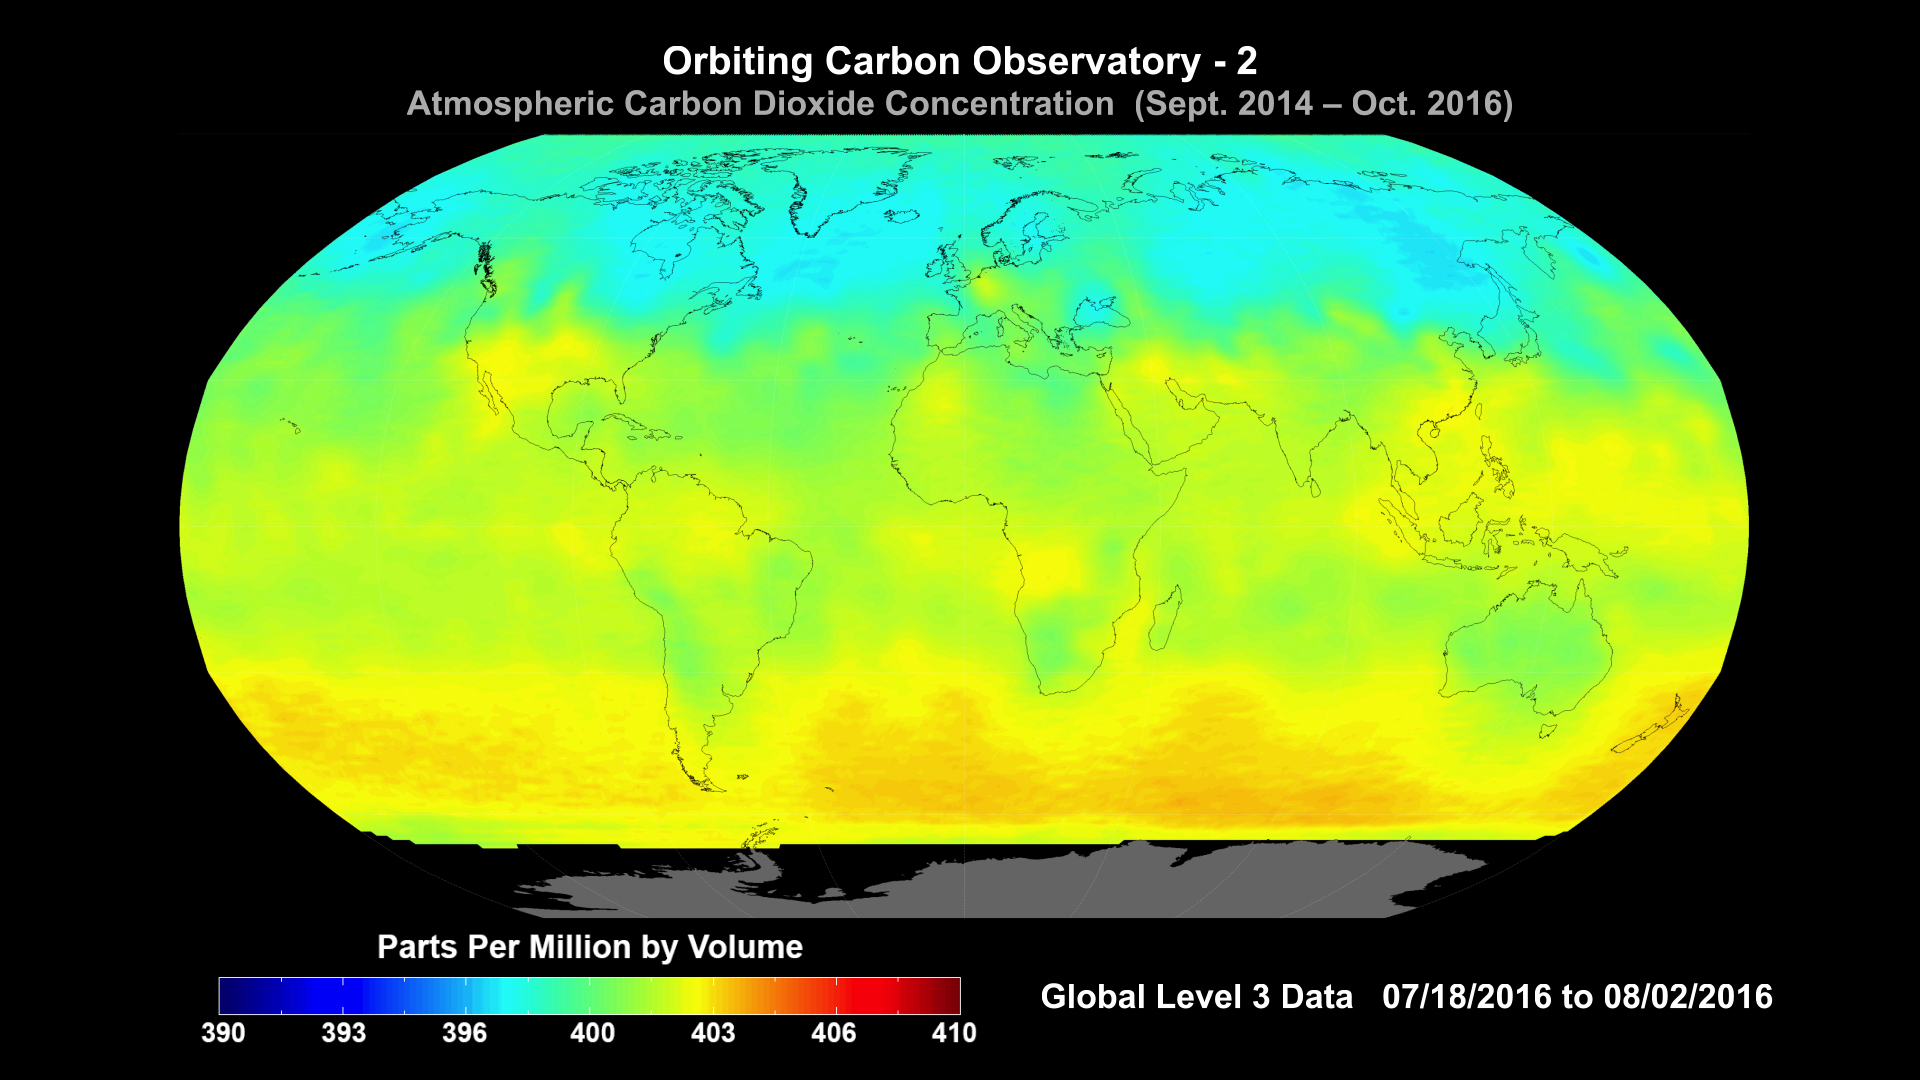
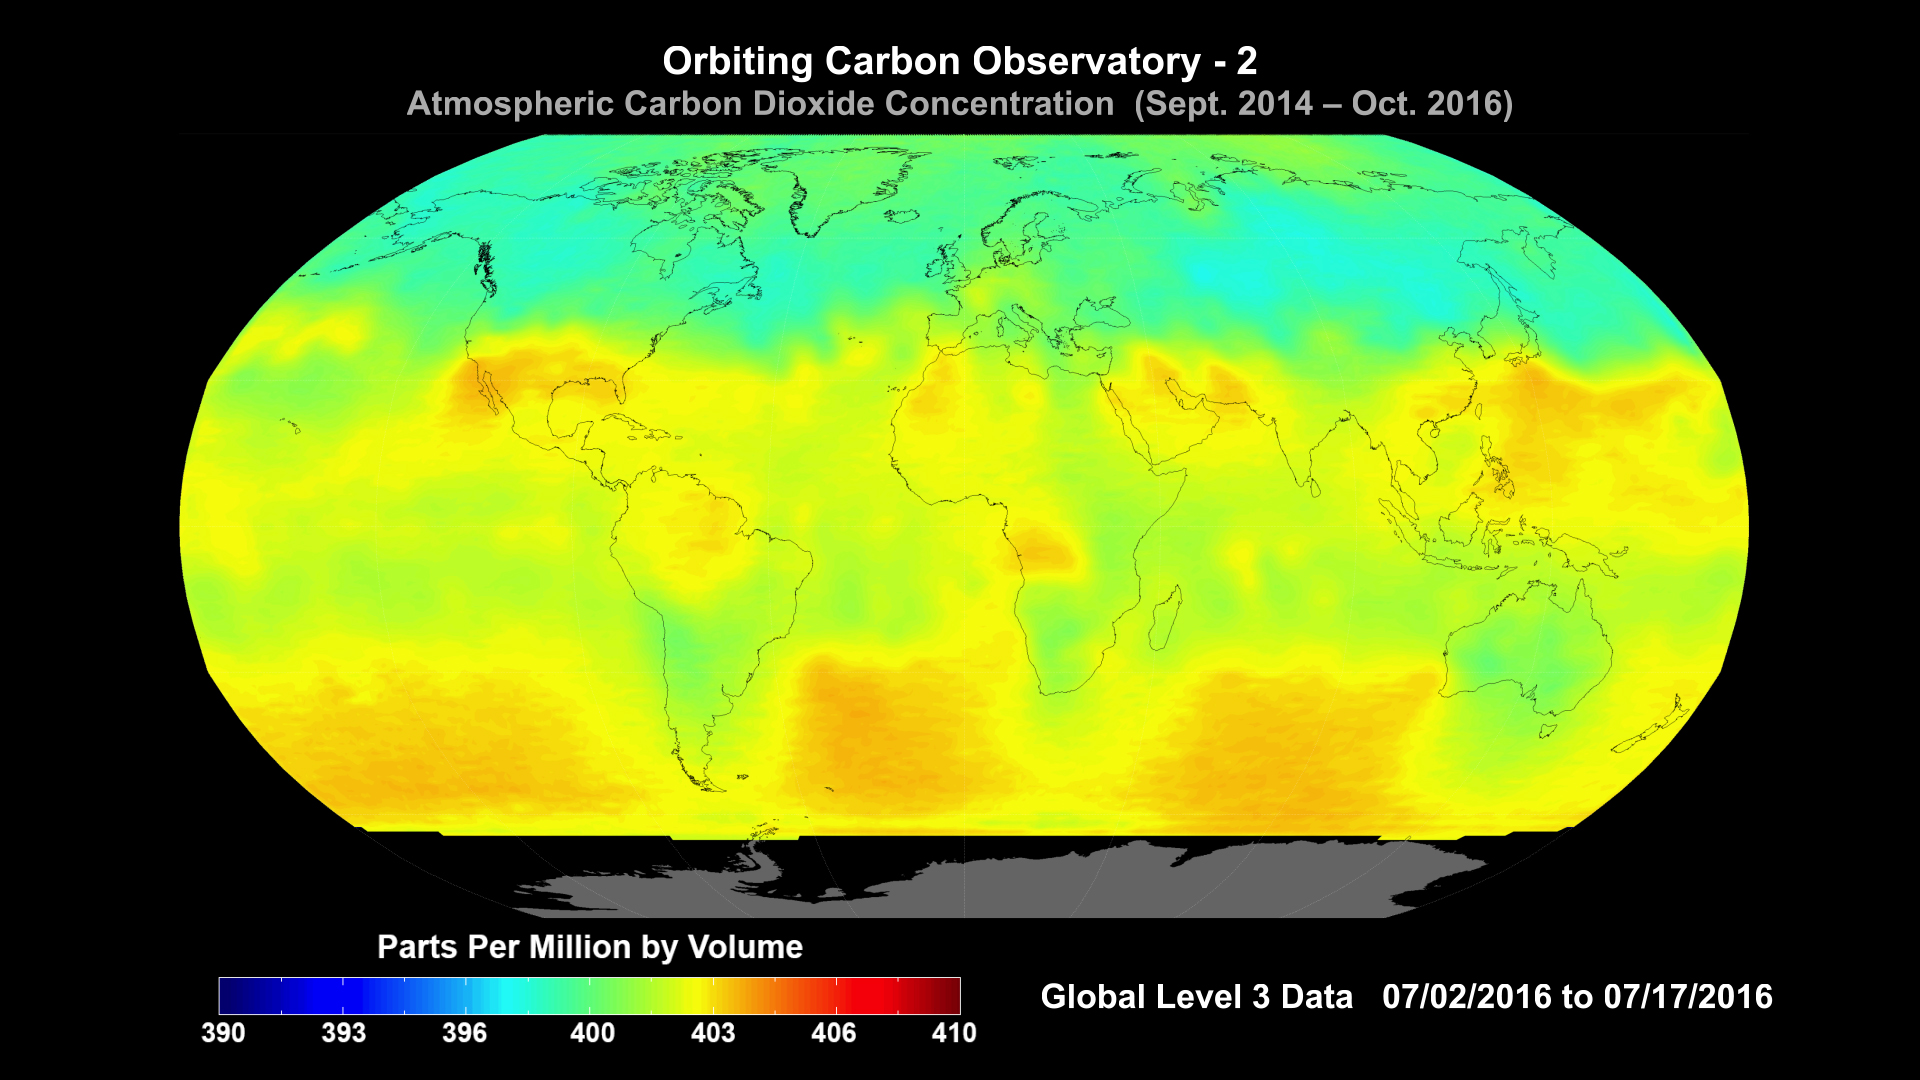
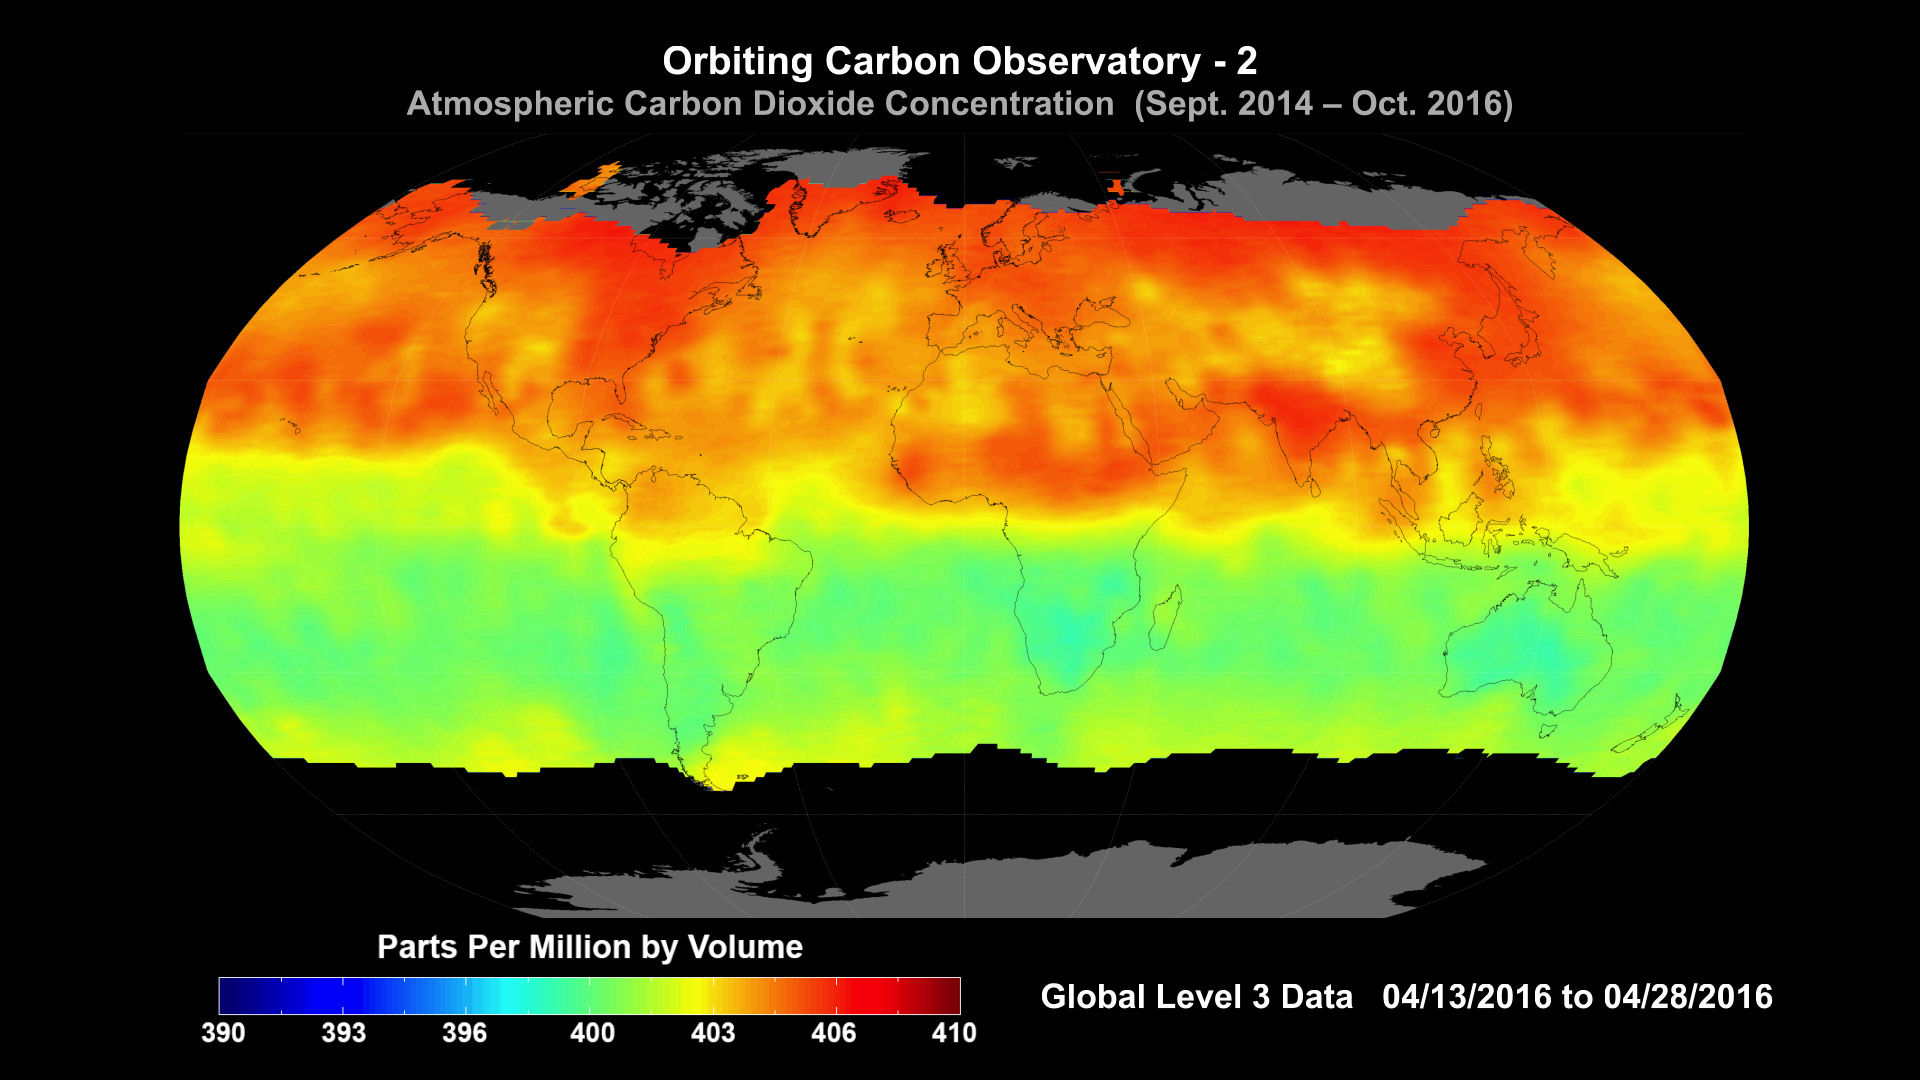
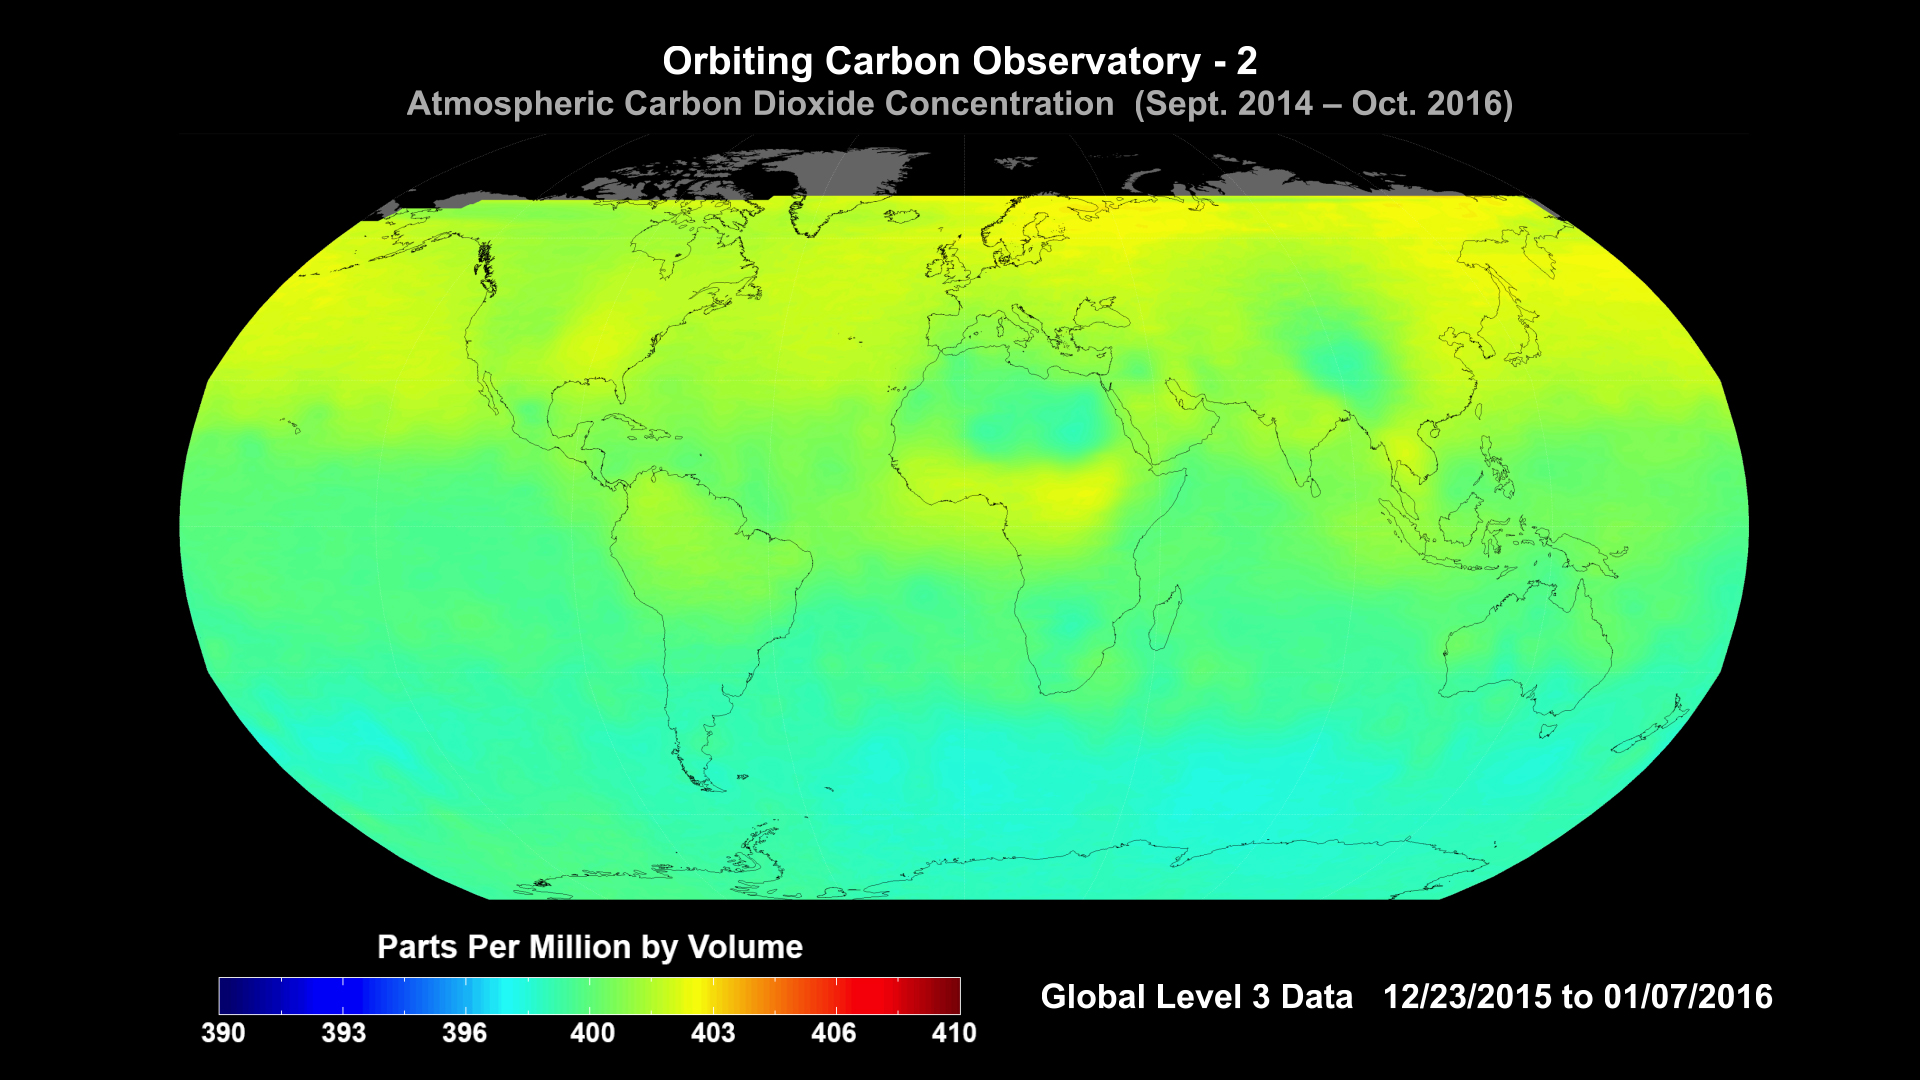
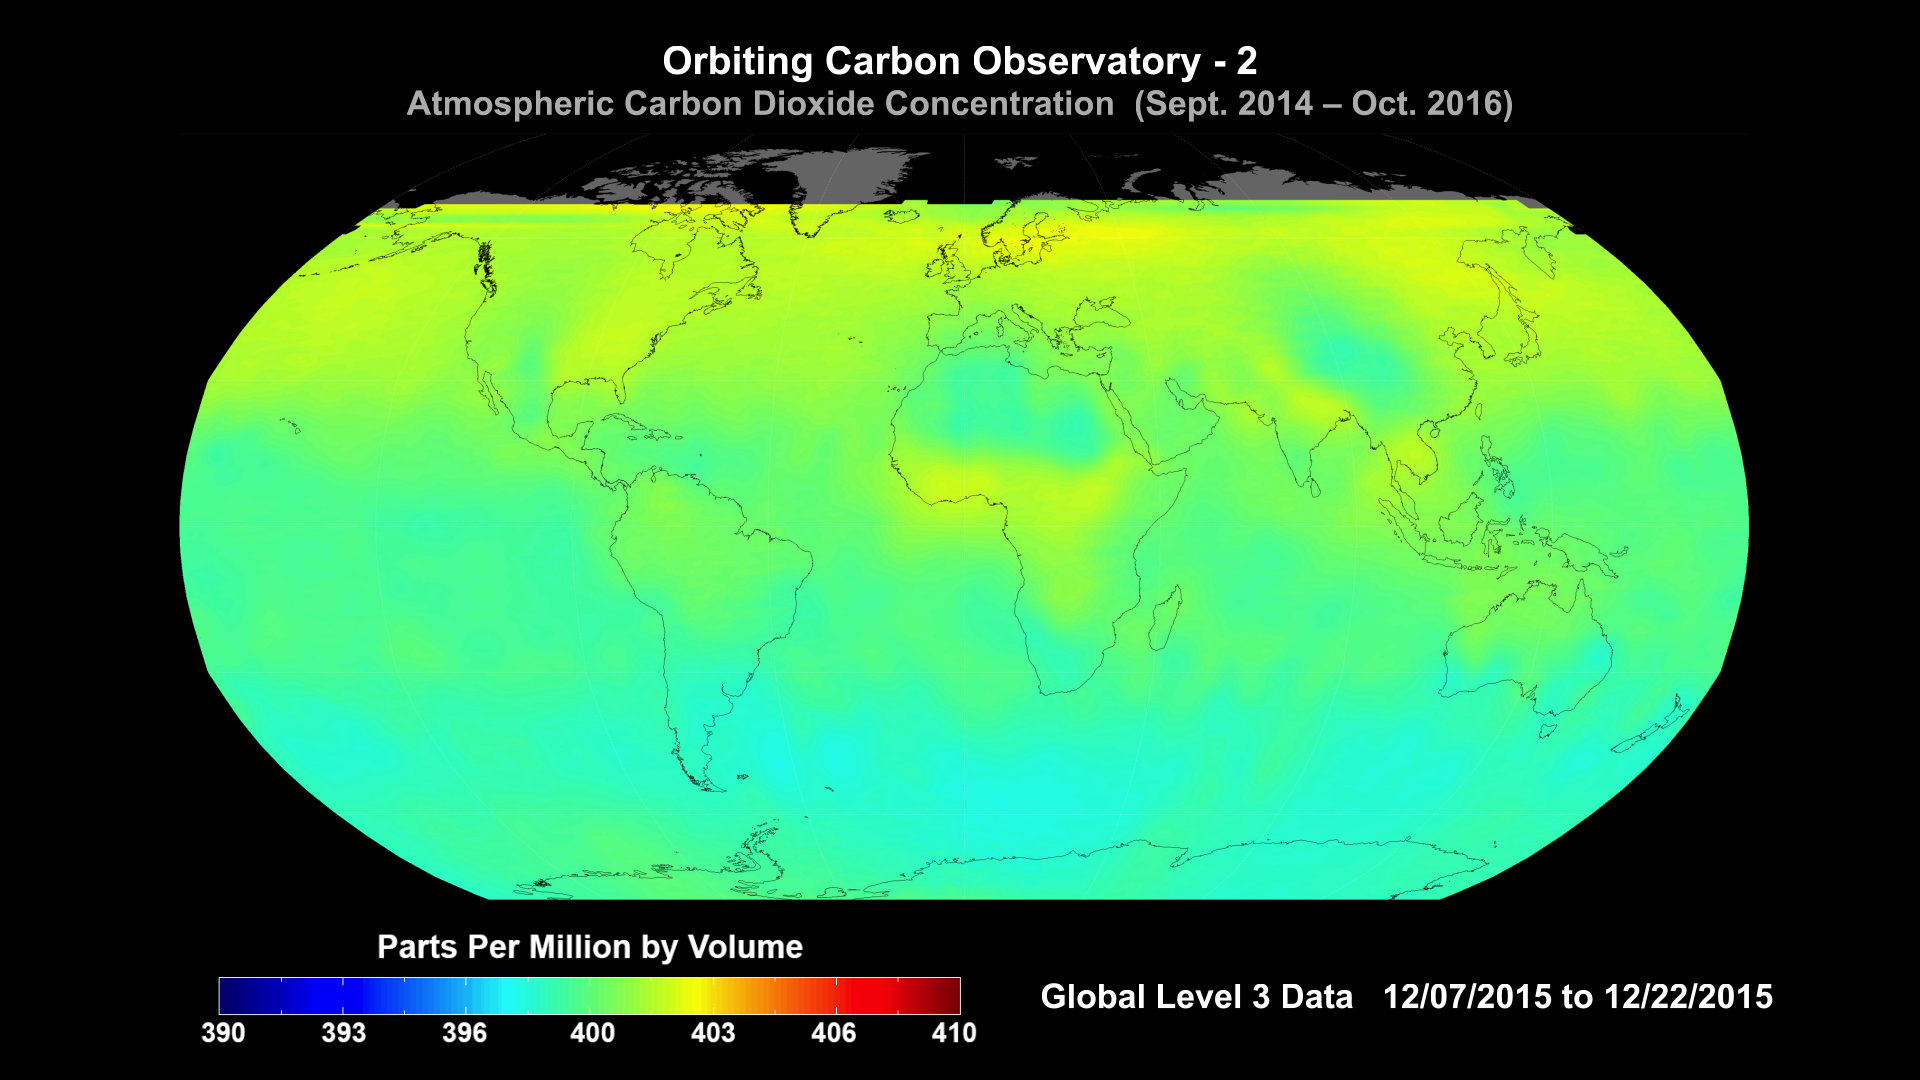
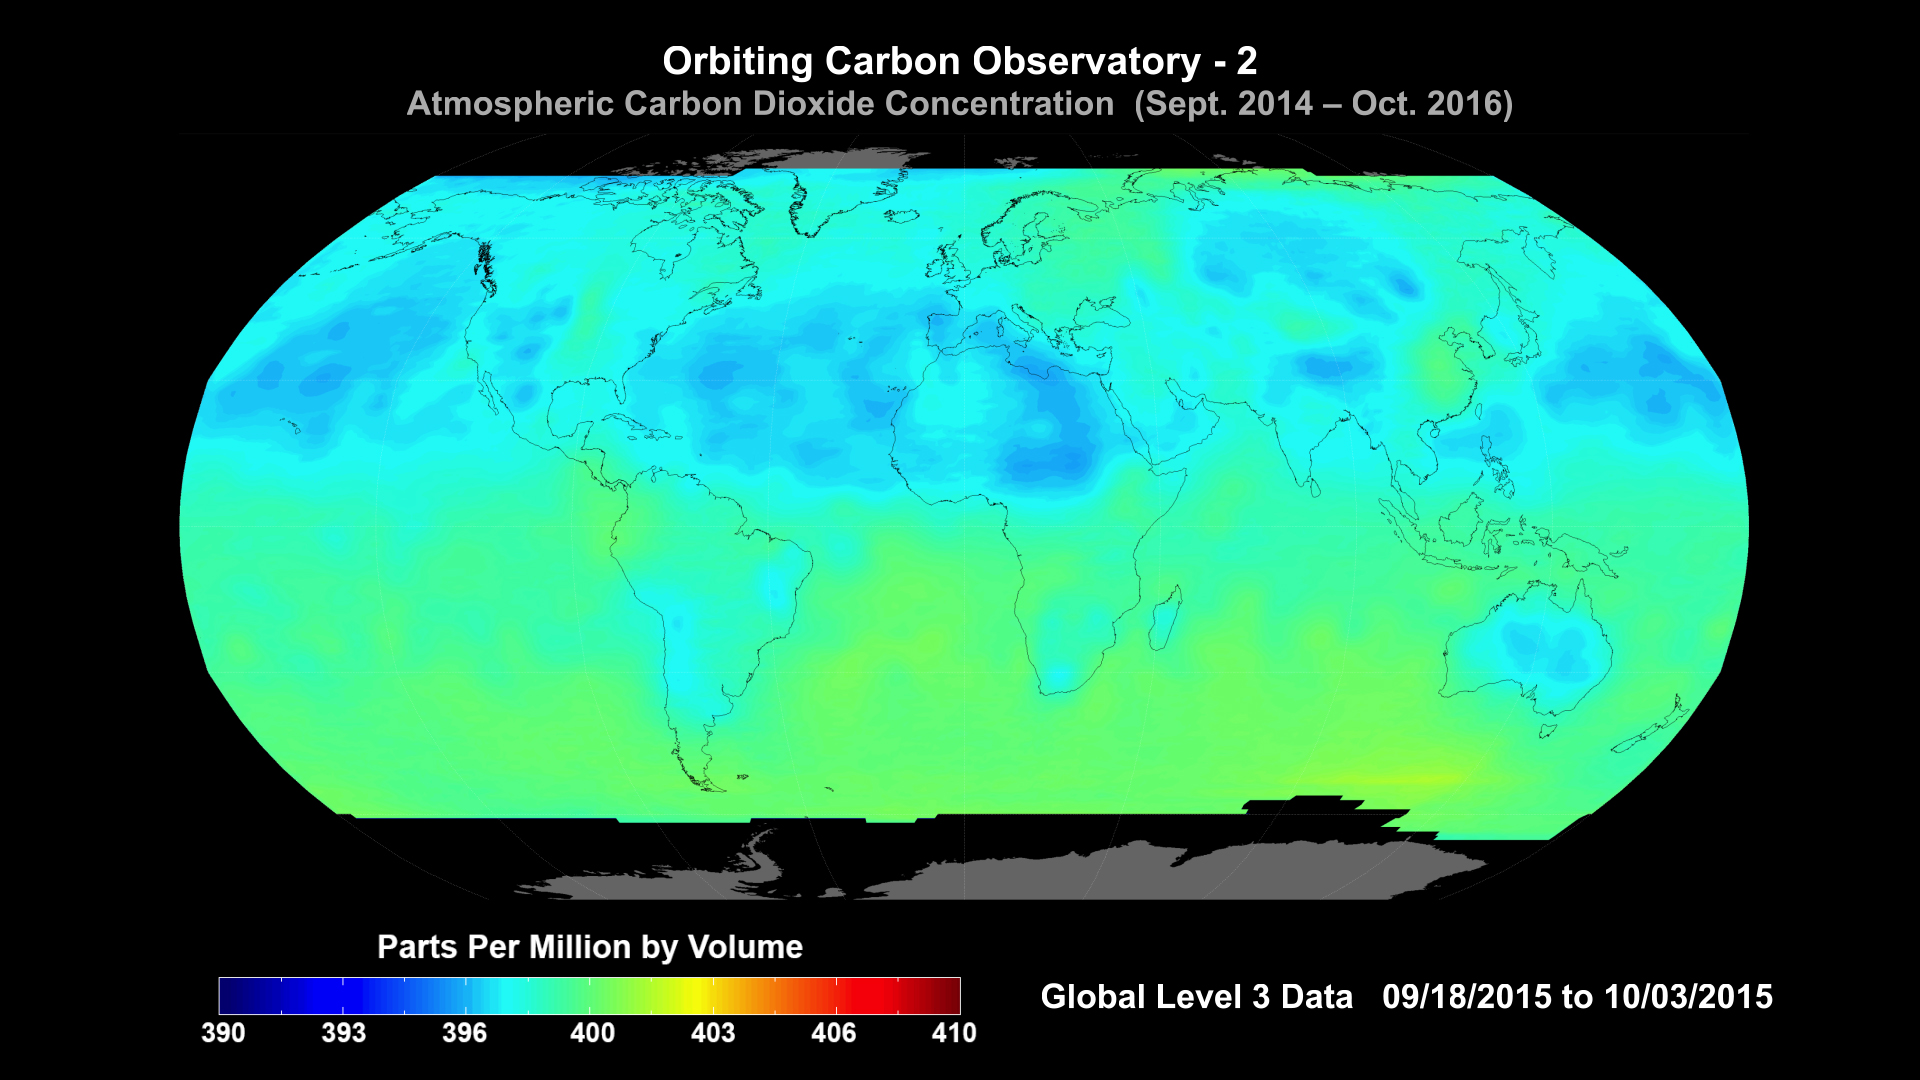
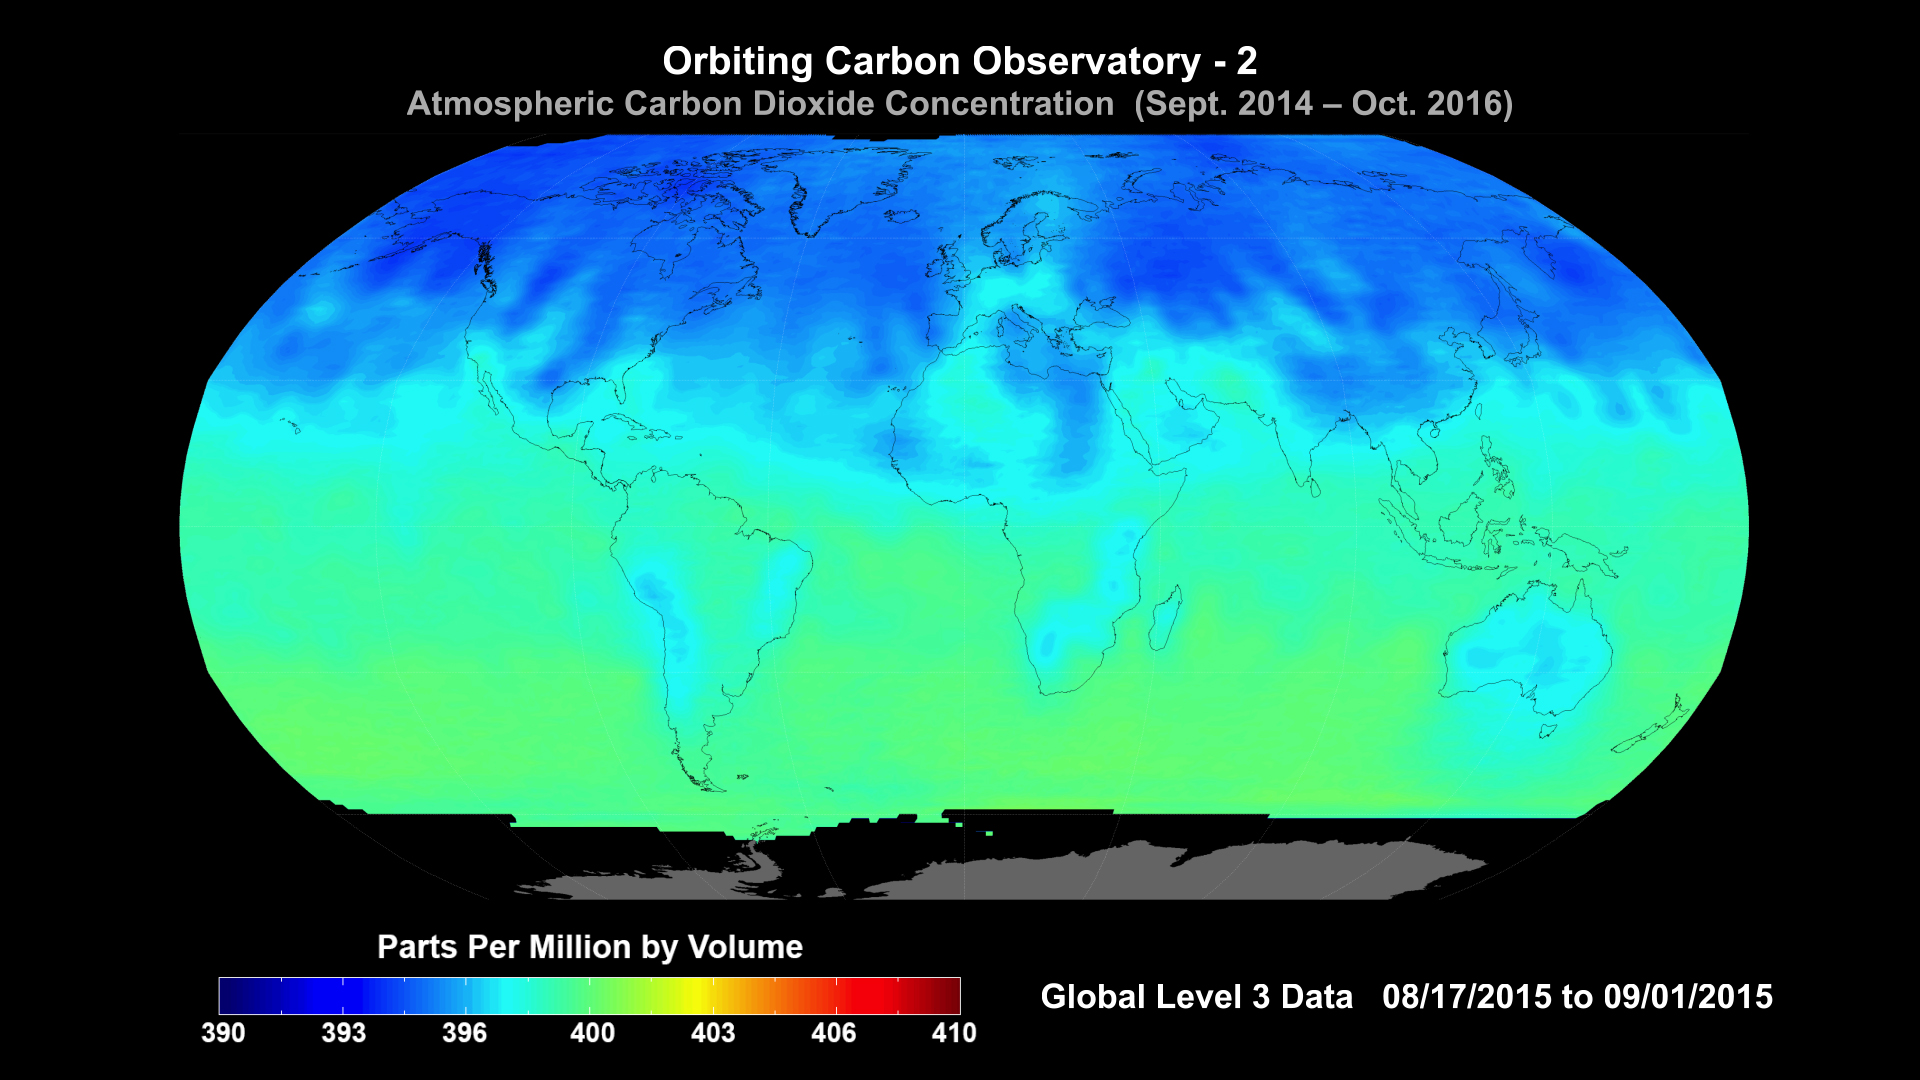
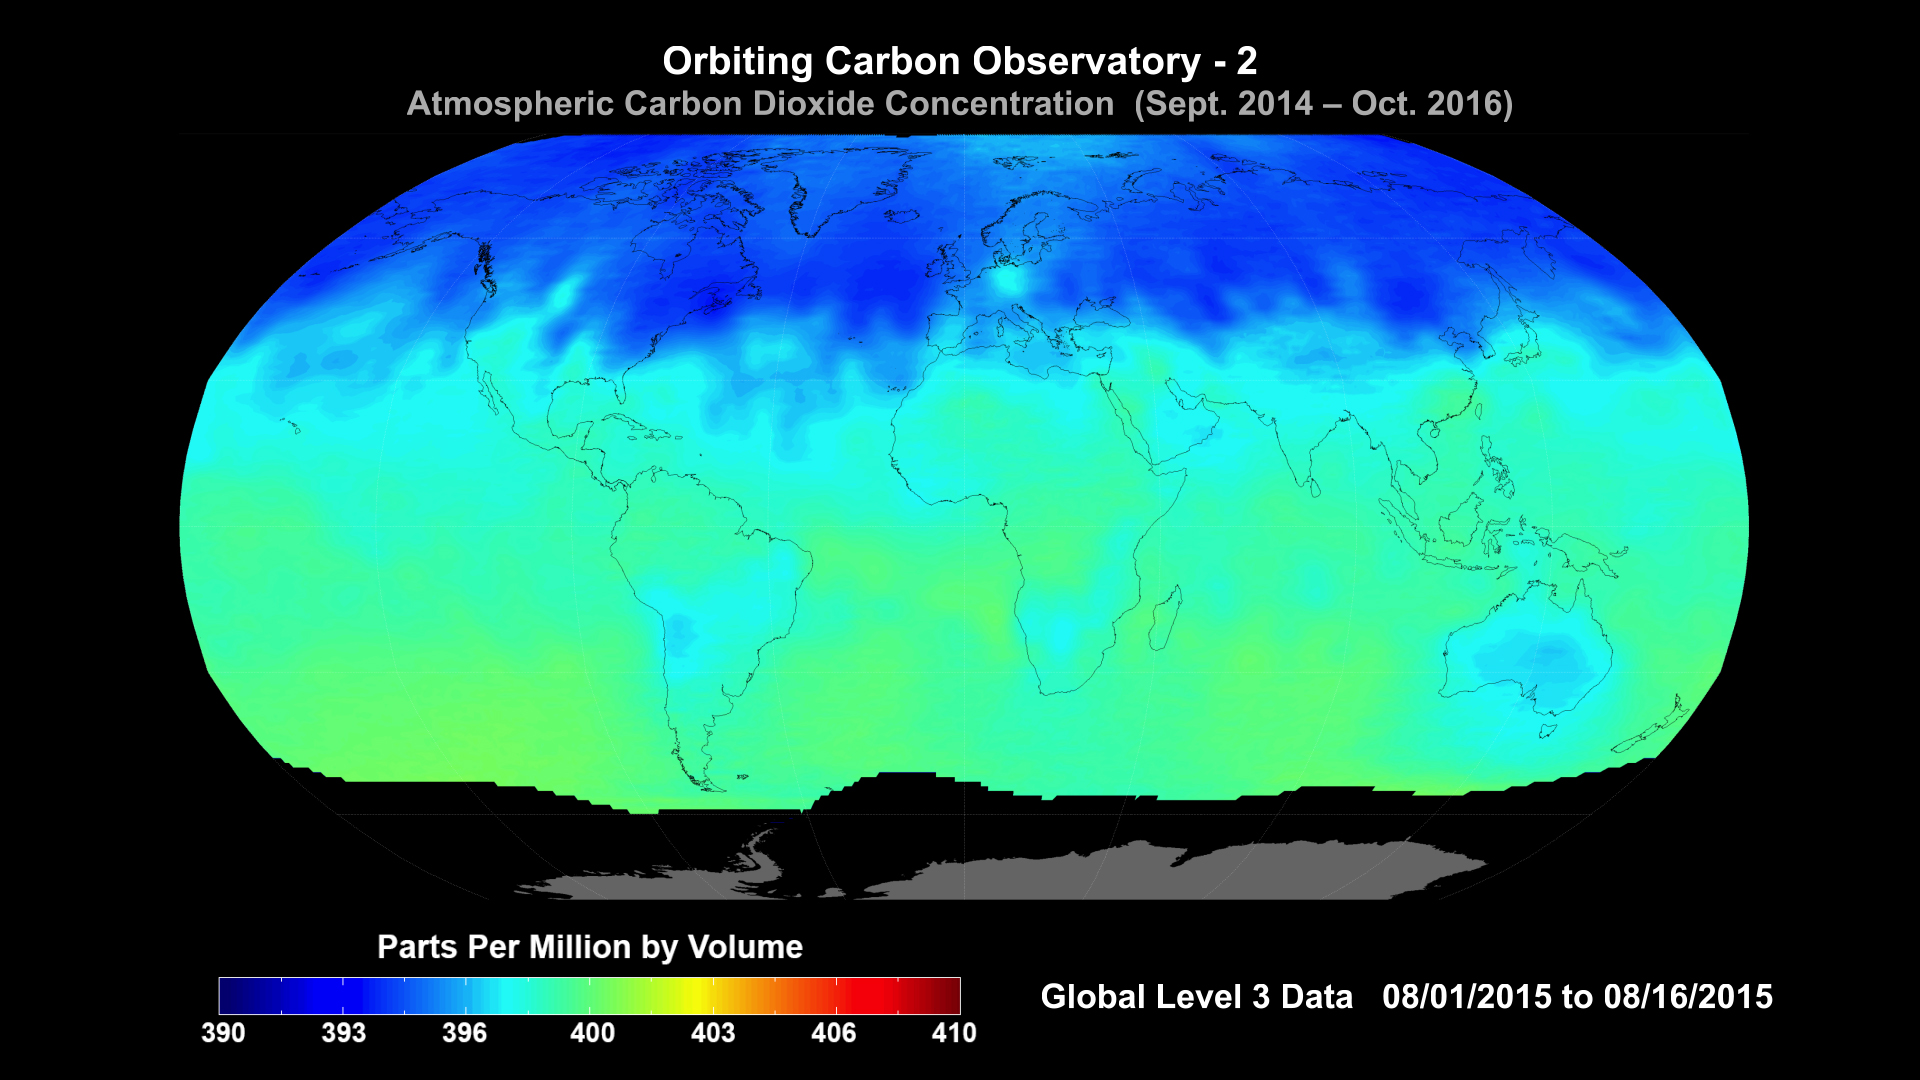
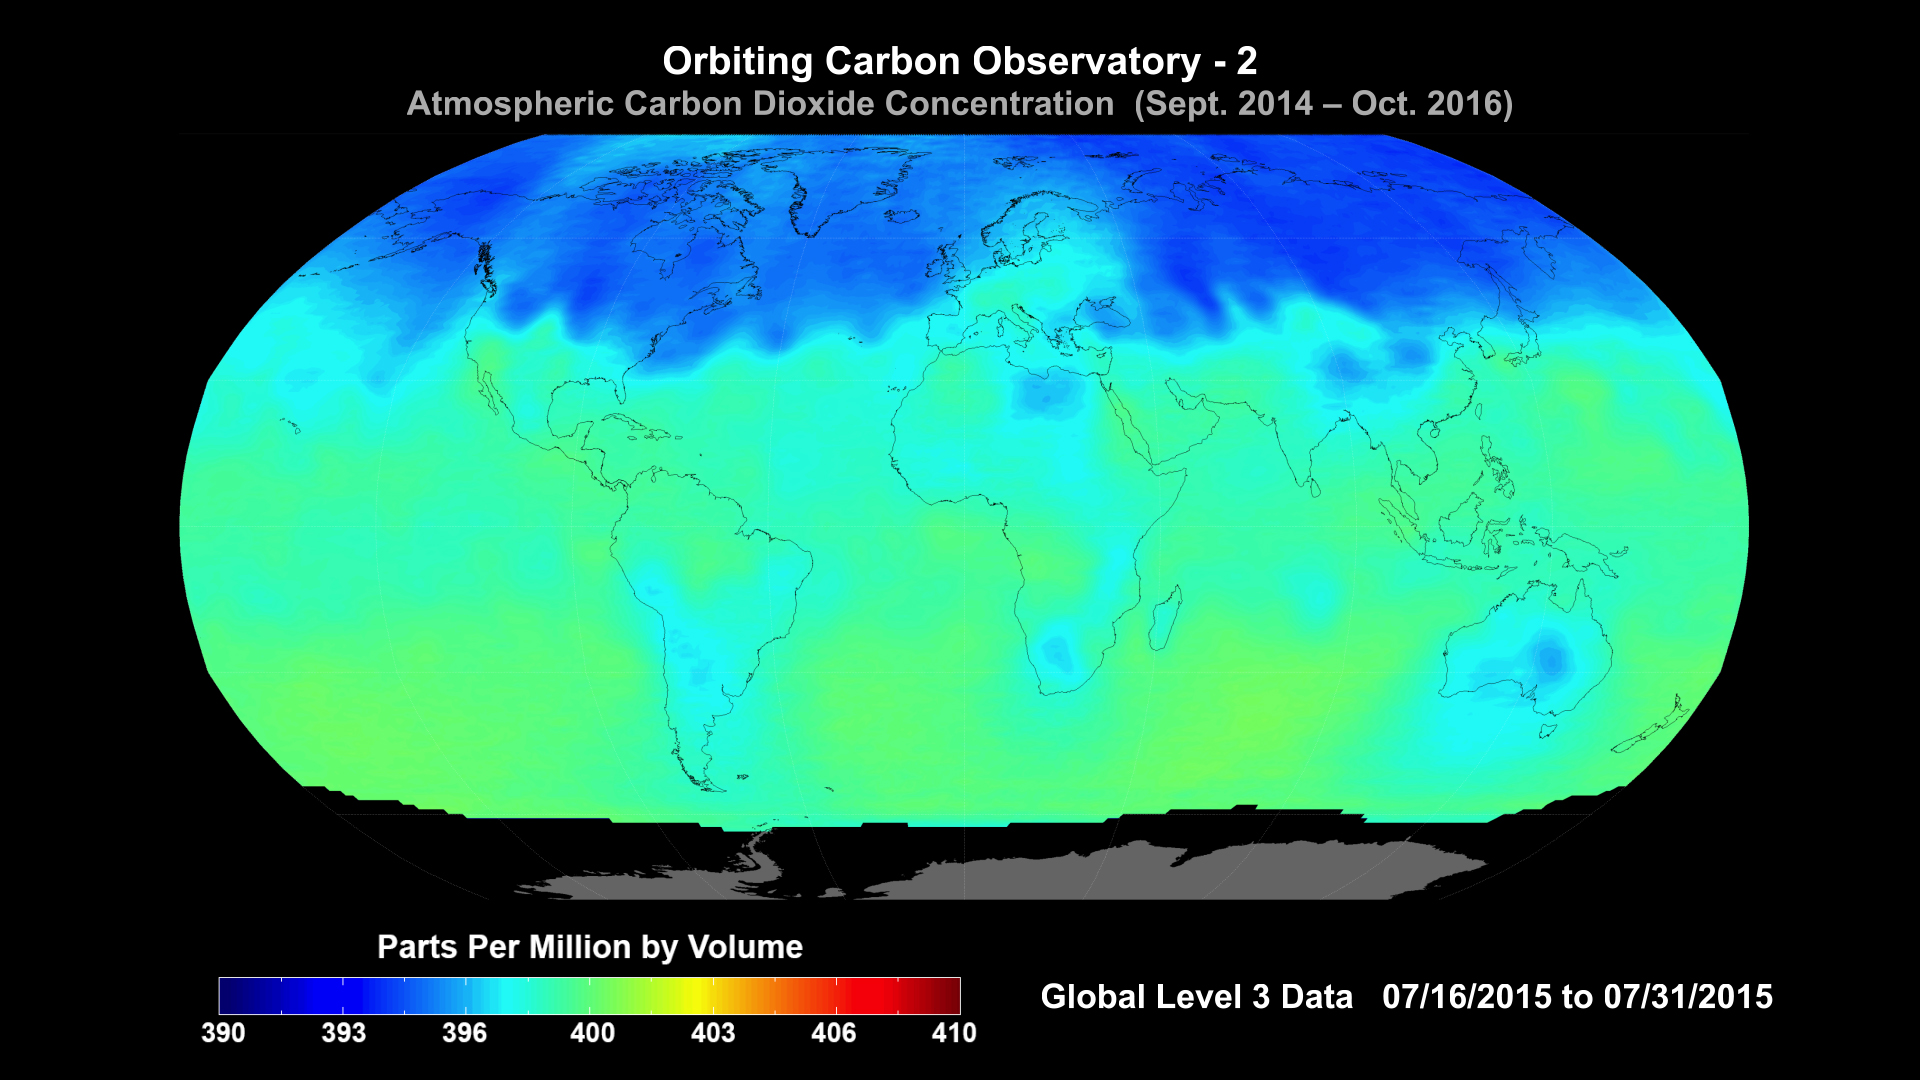
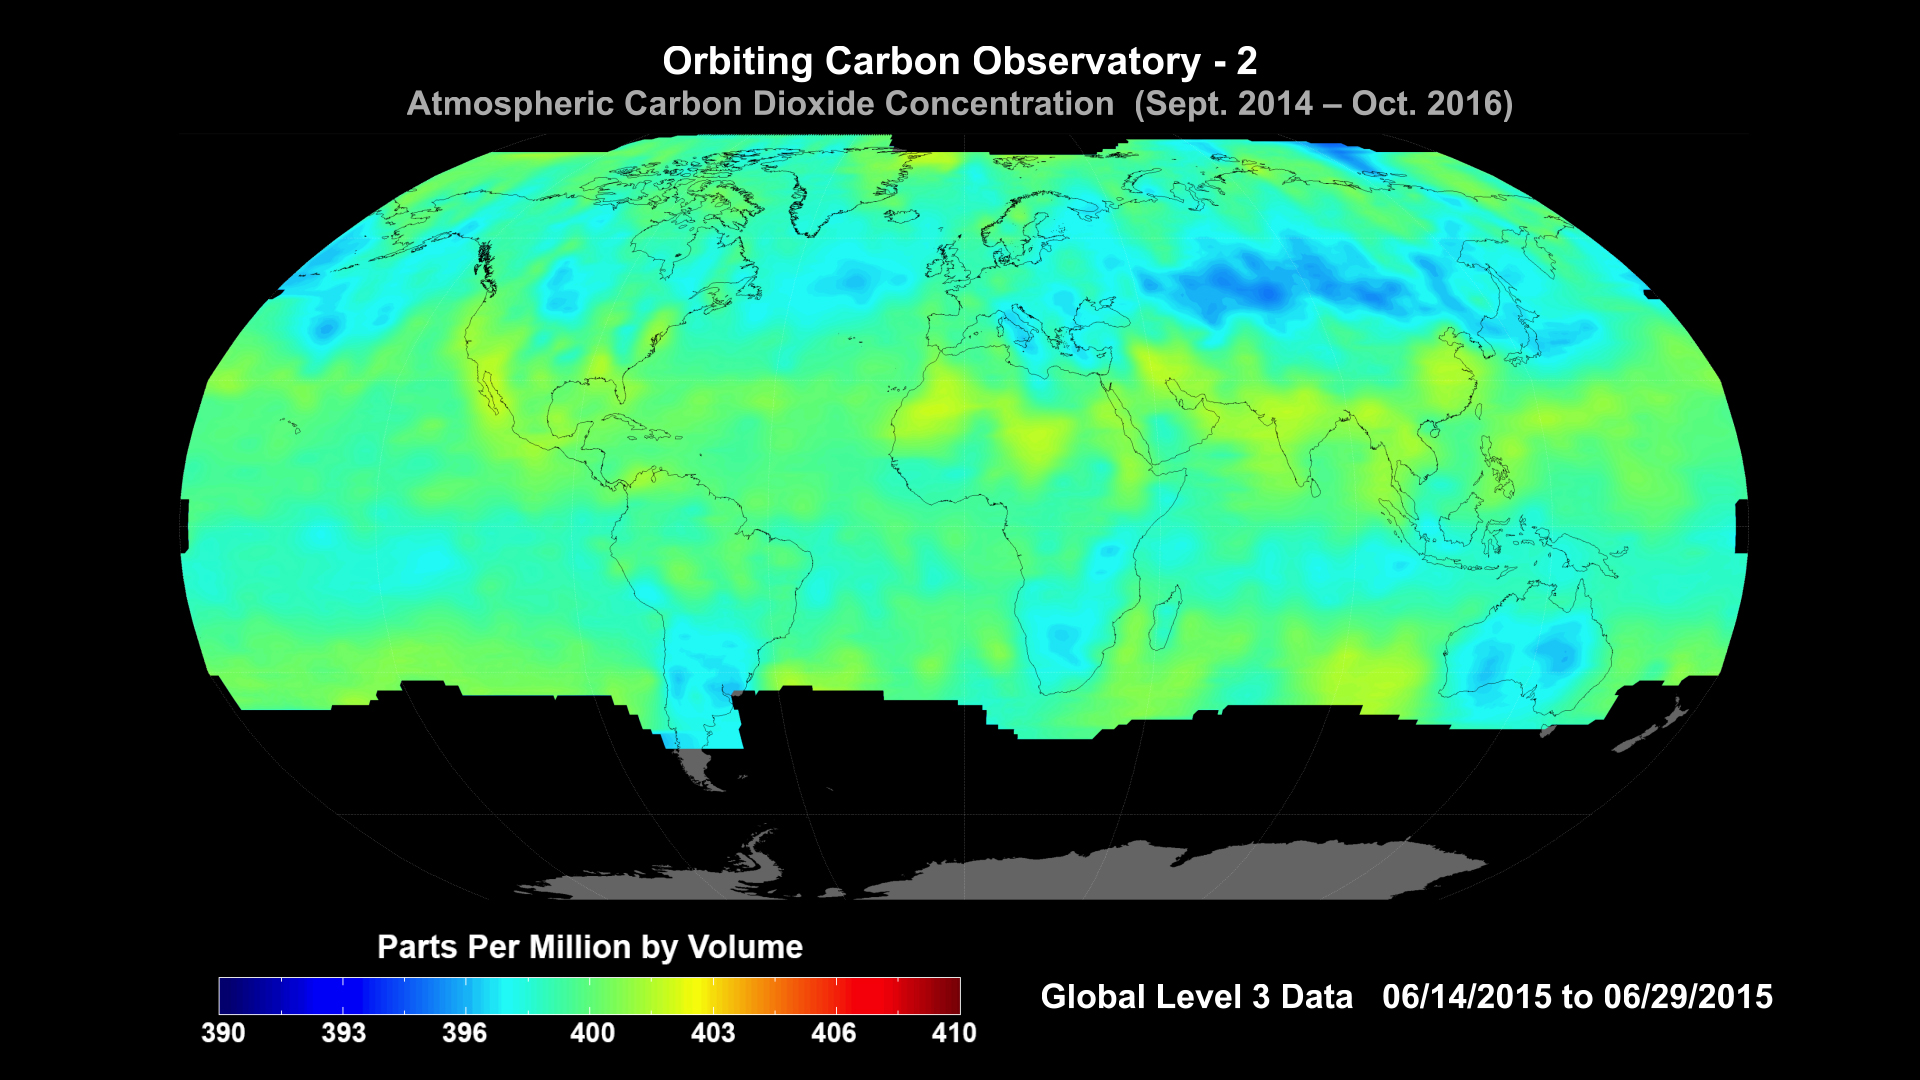
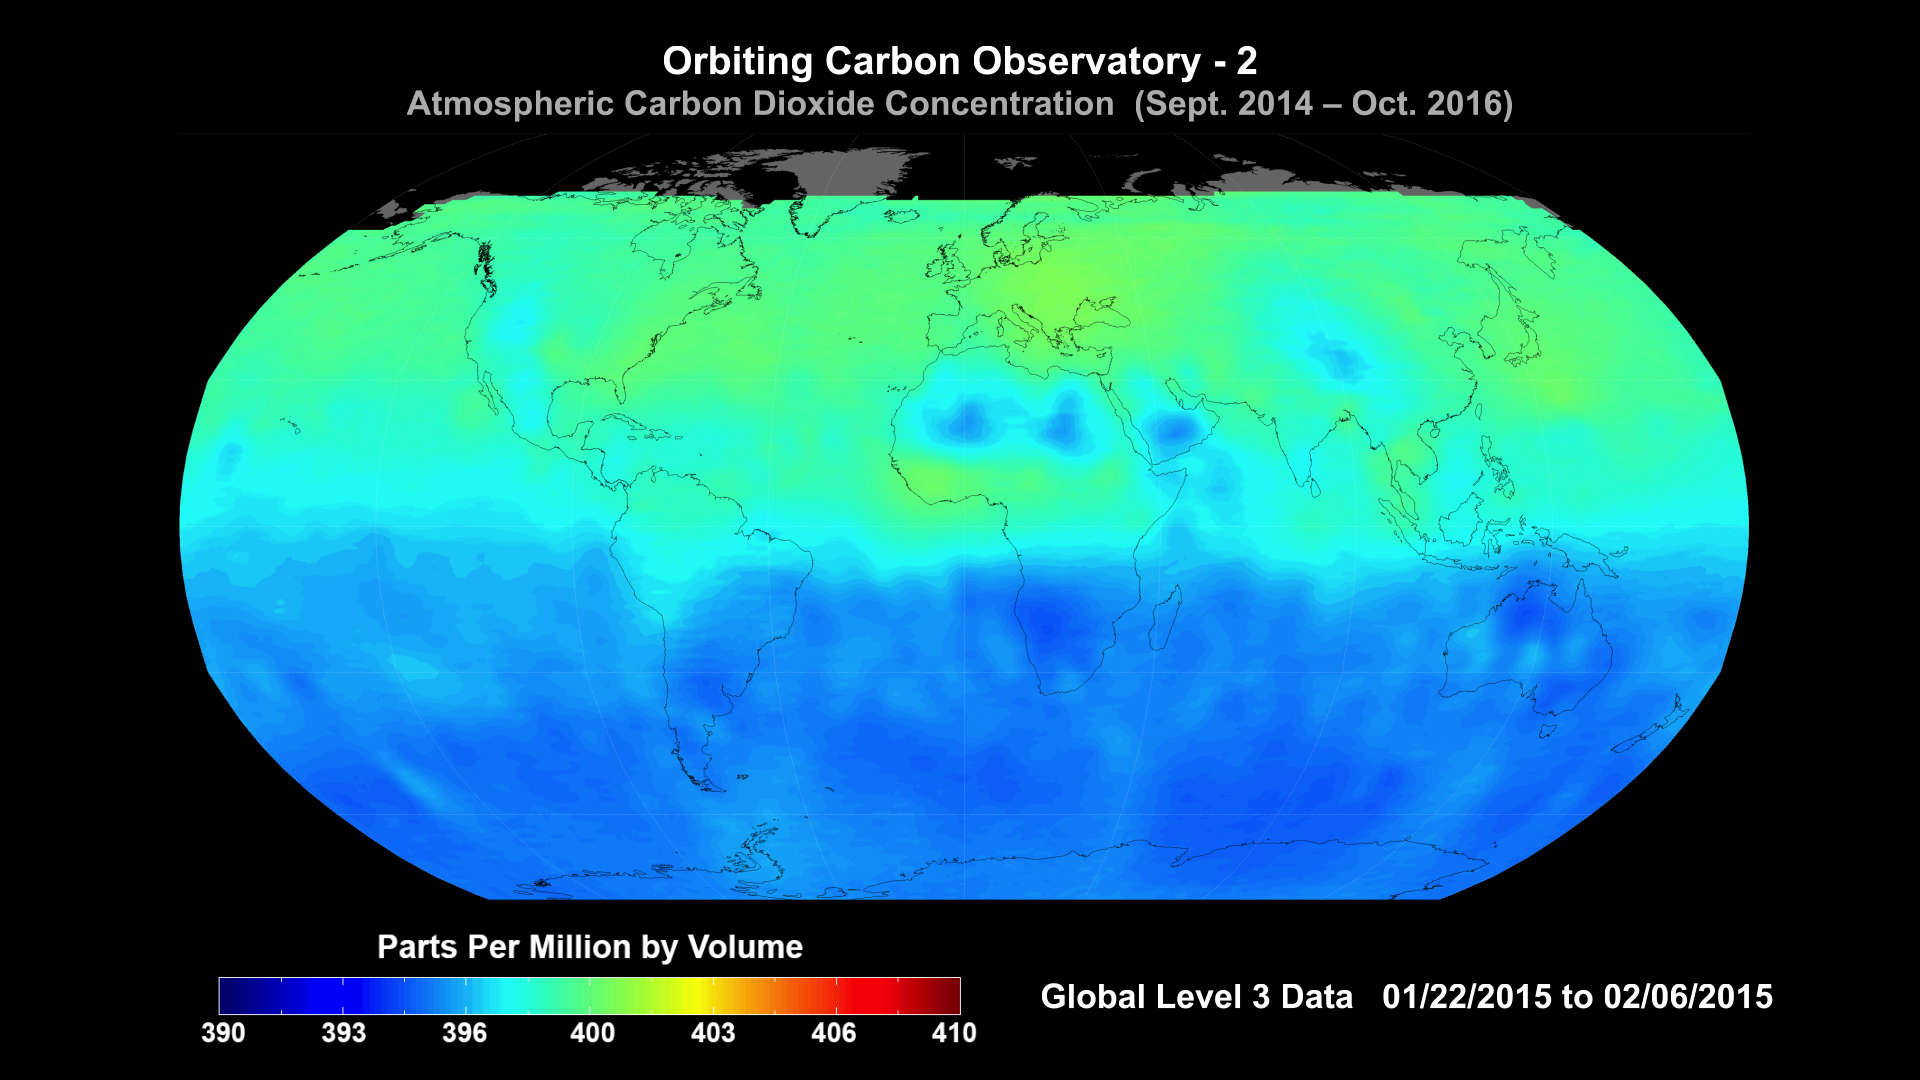
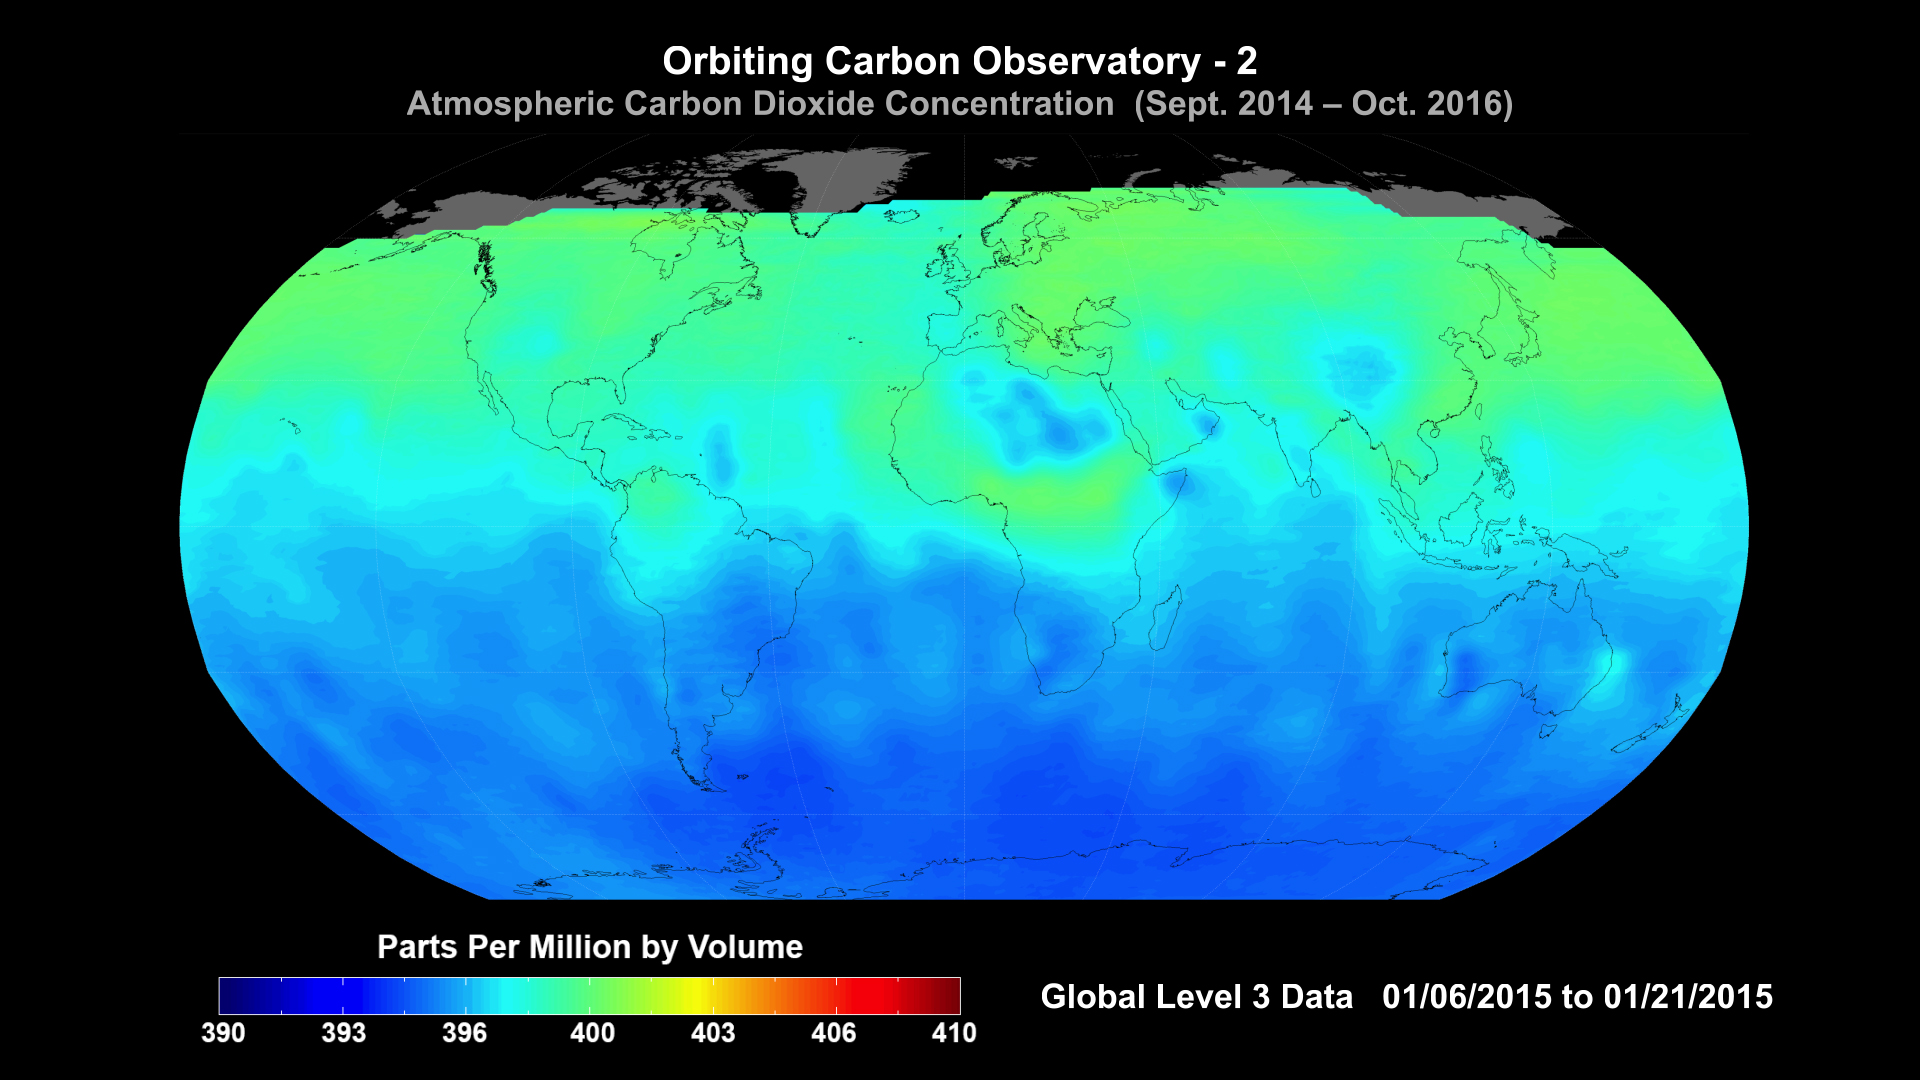
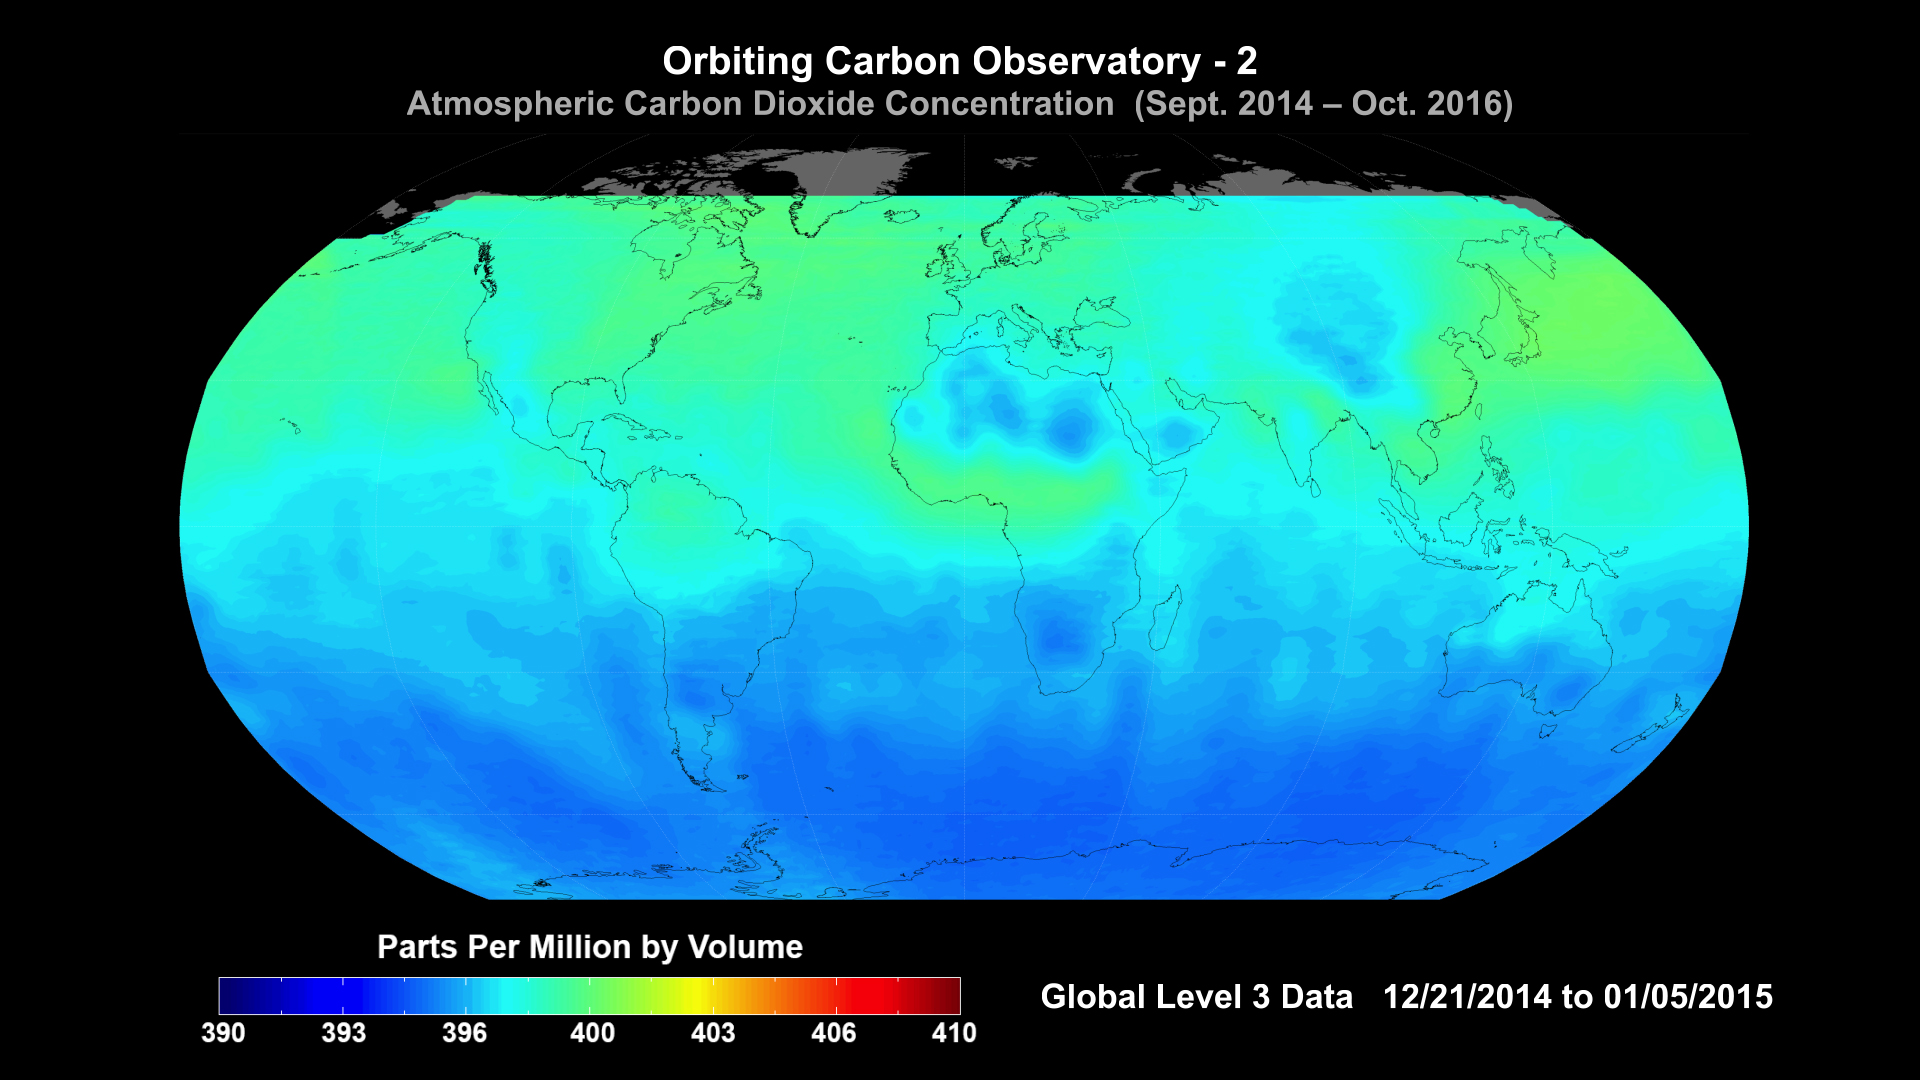
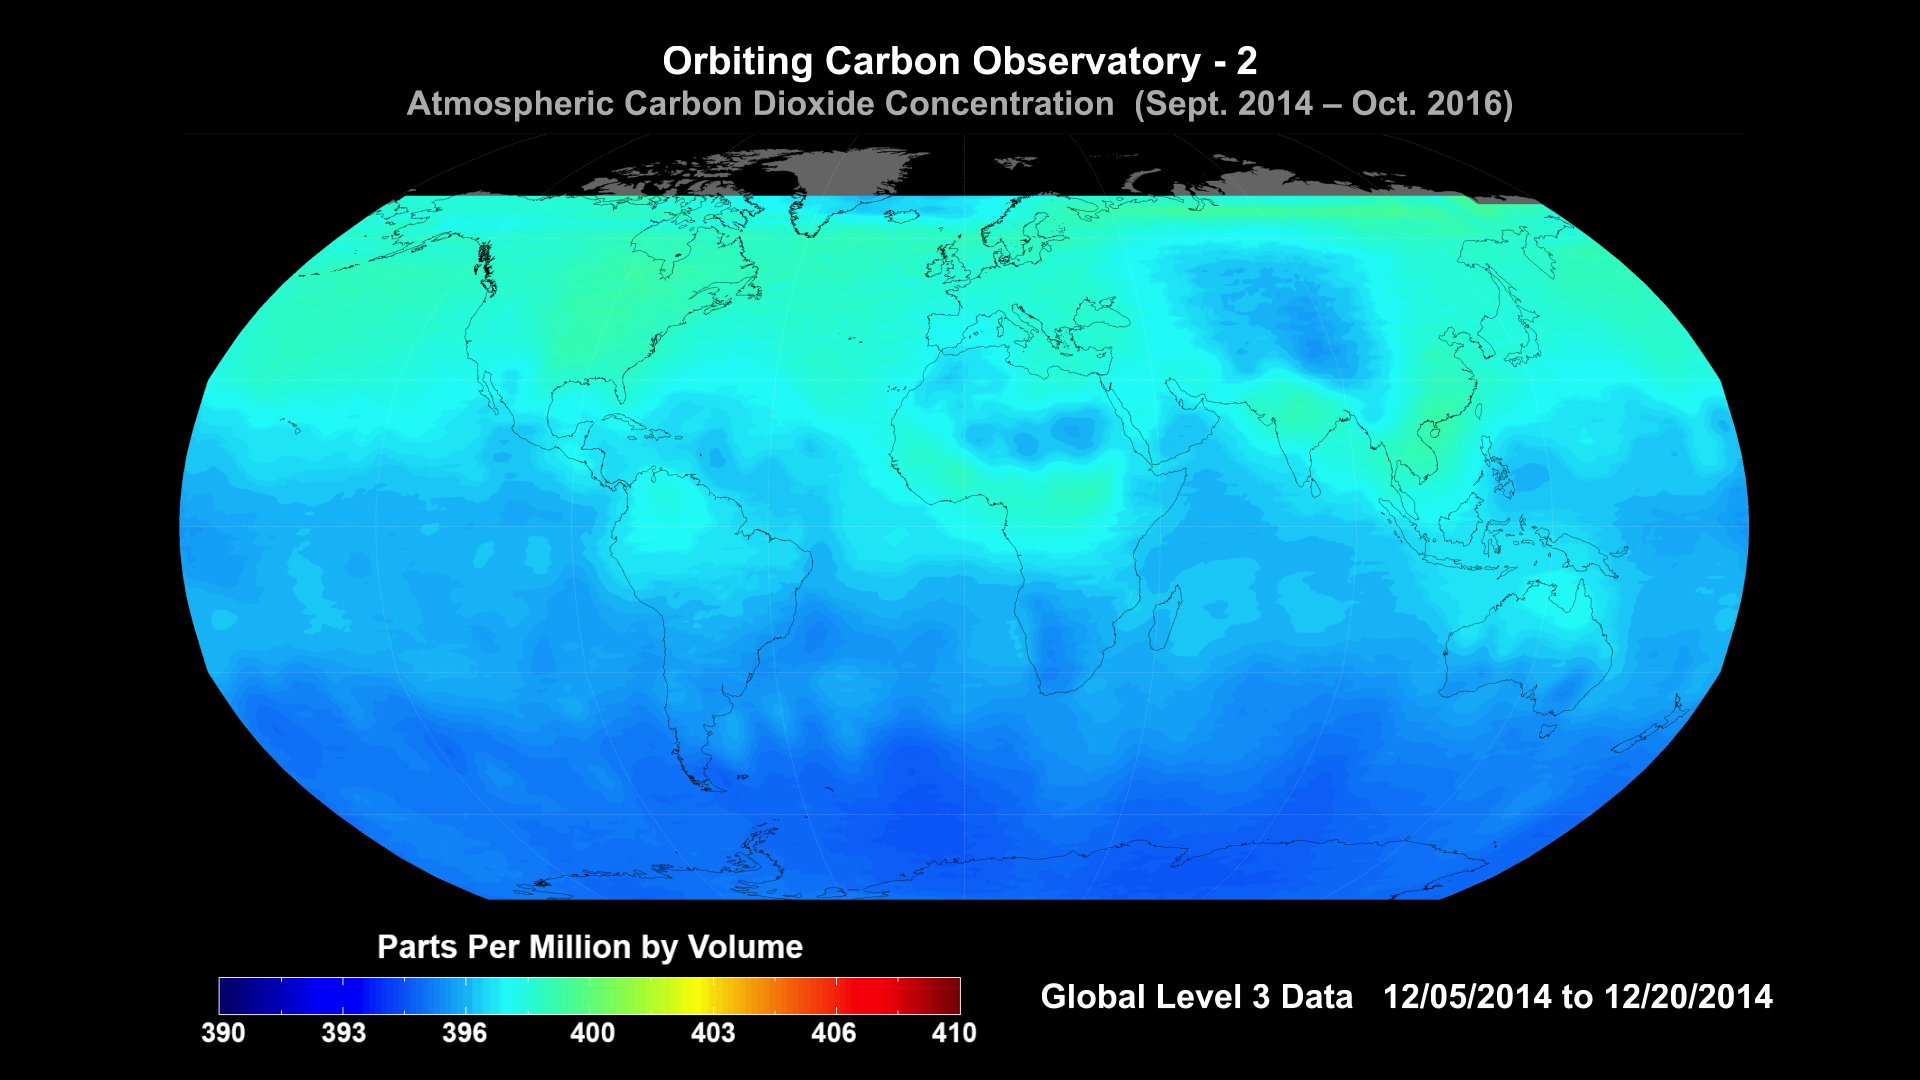
Global average carbon dioxide concentrations as seen by NASA’s Orbiting Carbon Observatory-2 mission. OCO-2 measures carbon dioxide from the top of Earth's atmosphere to its surface. Higher carbon dioxide concentrations are in red, with lower concentrations in yellows and greens. Scientists poring over data from OCO-2 mission are seeing patterns emerge as they seek answers to questions about atmospheric carbon dioxide.
NASA/JPL-Caltech

Global average carbon dioxide concentrations as seen by NASA’s Orbiting Carbon Observatory-2 mission. OCO-2 measures carbon dioxide from the top of Earth's atmosphere to its surface. Higher carbon dioxide concentrations are in red, with lower concentrations in yellows and greens. Scientists poring over data from OCO-2 mission are seeing patterns emerge as they seek answers to questions about atmospheric carbon dioxide.
NASA / JPL

Global average carbon dioxide concentrations as seen by NASA’s Orbiting Carbon Observatory-2 mission. OCO-2 measures carbon dioxide from the top of Earth's atmosphere to its surface. Higher carbon dioxide concentrations are in red, with lower concentrations in yellows and greens. Scientists poring over data from OCO-2 mission are seeing patterns emerge as they seek answers to questions about atmospheric carbon dioxide.
NASA/JPL-Caltech

Global average carbon dioxide concentrations as seen by NASA’s Orbiting Carbon Observatory-2 mission. OCO-2 measures carbon dioxide from the top of Earth's atmosphere to its surface. Higher carbon dioxide concentrations are in red, with lower concentrations in yellows and greens. Scientists poring over data from OCO-2 mission are seeing patterns emerge as they seek answers to questions about atmospheric carbon dioxide.
NASA/JPL-Caltech
Two-week smoothed average
NASA/JPL-Caltech

Two-week smoothed average
NASA/JPL-Caltech
Two-week smoothed average
NASA/JPL-Caltech

Two-week smoothed average
NASA/JPL-Caltech

Two-week smoothed average
NASA/JPL-Caltech
Two-week smoothed average
NASA/JPL-Caltech

Two-week smoothed average
NASA/JPL-Caltech

Two-week smoothed average
NASA/JPL-Caltech
Two-week smoothed average
NASA/JPL-Caltech

Two-week smoothed average
NASA/JPL-Caltech

NASA/JPL-Caltech
Two-week smoothed average
NASA/JPL-Caltech
Two-week smoothed average
NASA/JPL-Caltech

Two-week smoothed average
NASA/JPL-Caltech

Two-week smoothed average
NASA/JPL-Caltech

Two-week smoothed average
NASA/JPL-Caltech

Two-week smoothed average
NASA/JPL-Caltech
Two-week smoothed average
NASA/JPL-Caltech

Two-week smoothed average
NASA/JPL-Caltech
Two-week smoothed average
NASA/JPL-Caltech

Two-week smoothed average
NASA/JPL-Caltech

Two-week smoothed average
NASA/JPL-Caltech

Two-week smoothed average
NASA/JPL-Caltech

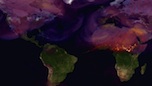
Carbon dioxide from wildfires and urban sources blankets the Northern Hemisphere.
NASA/GSFC/GMAO

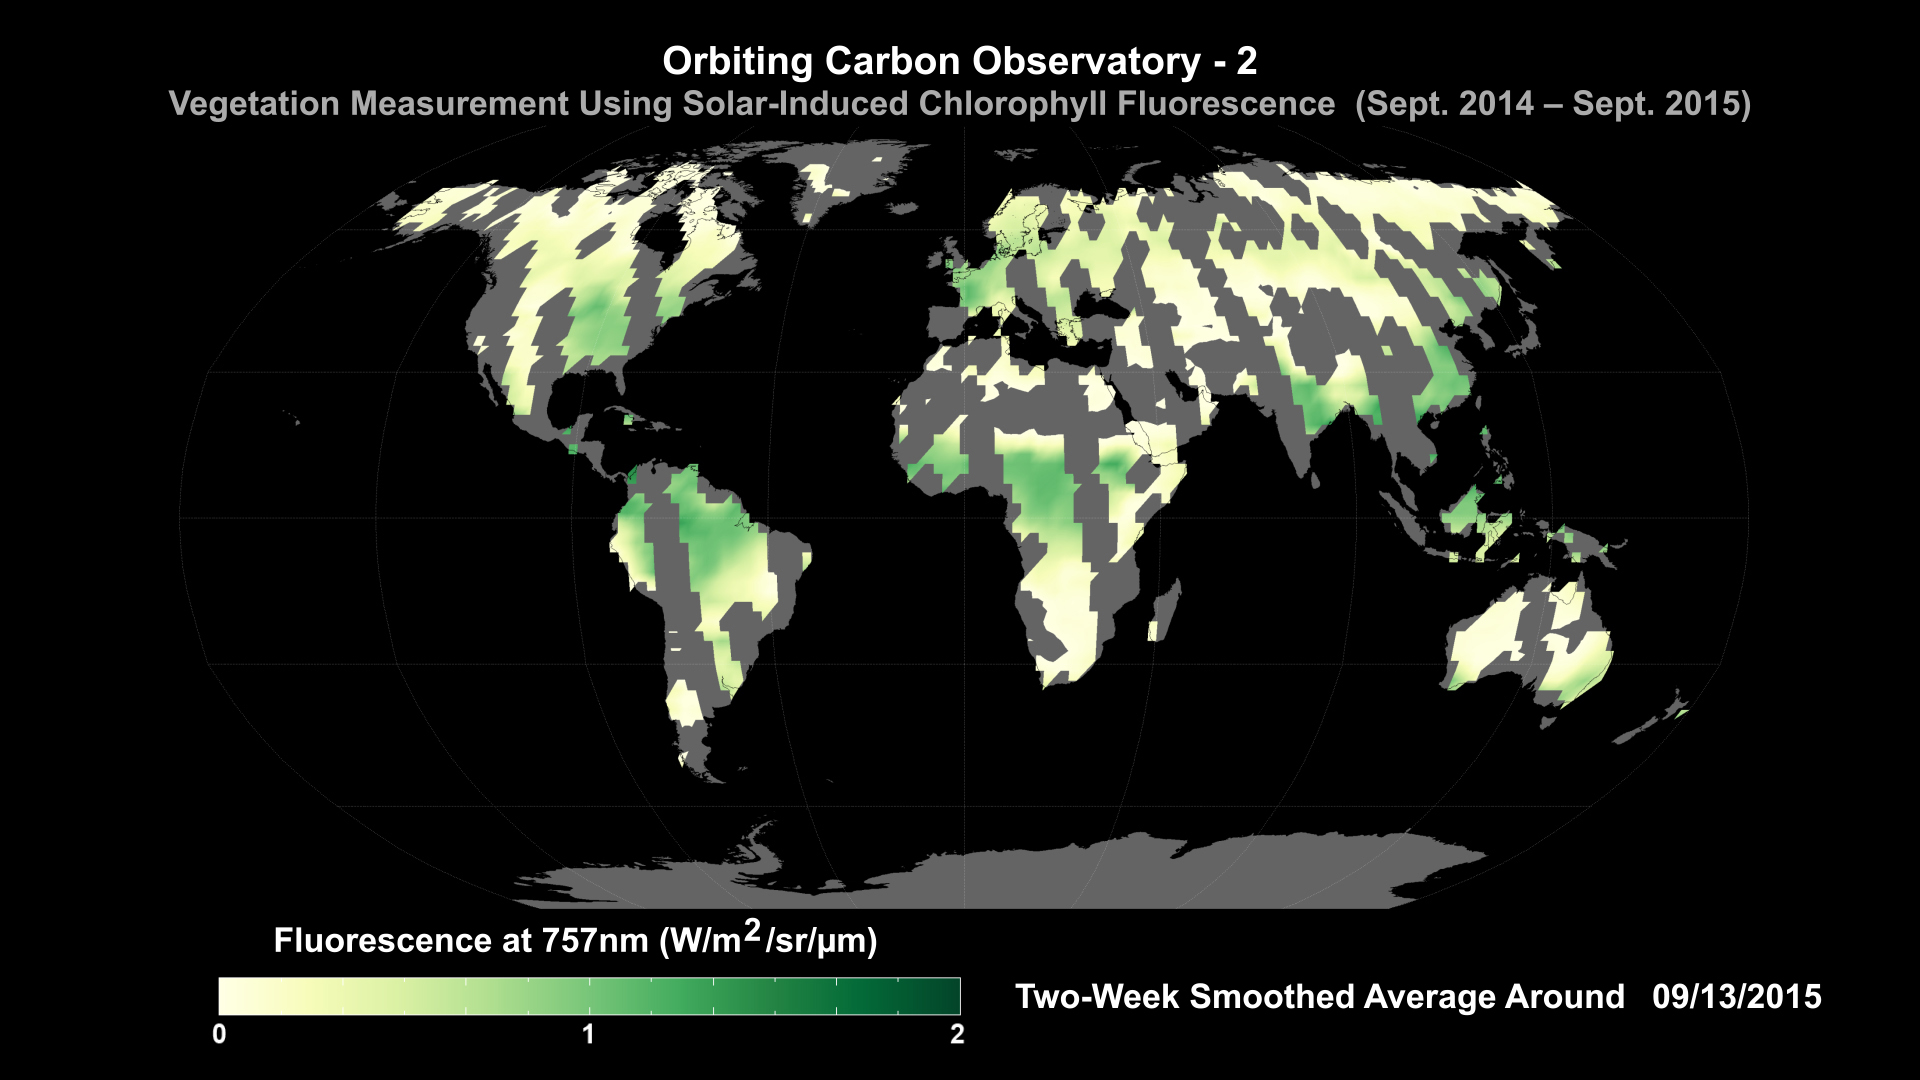
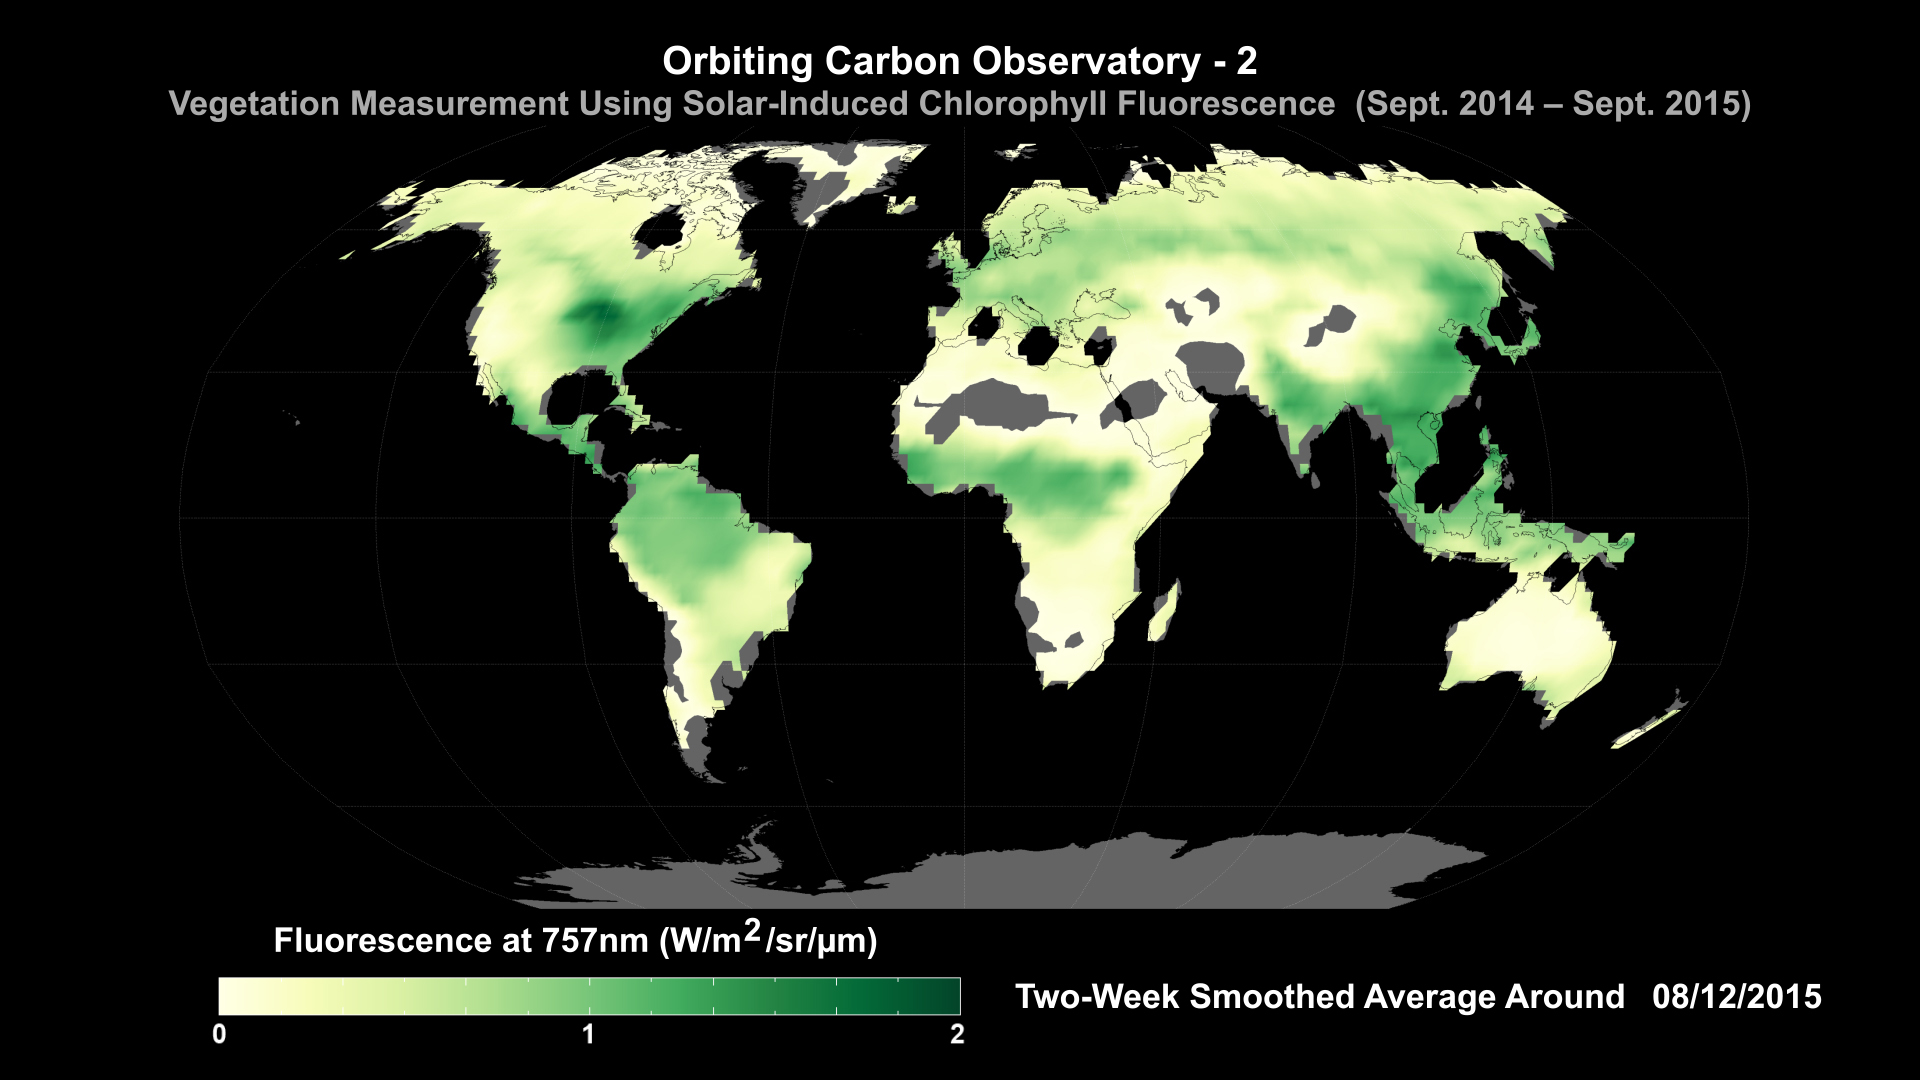
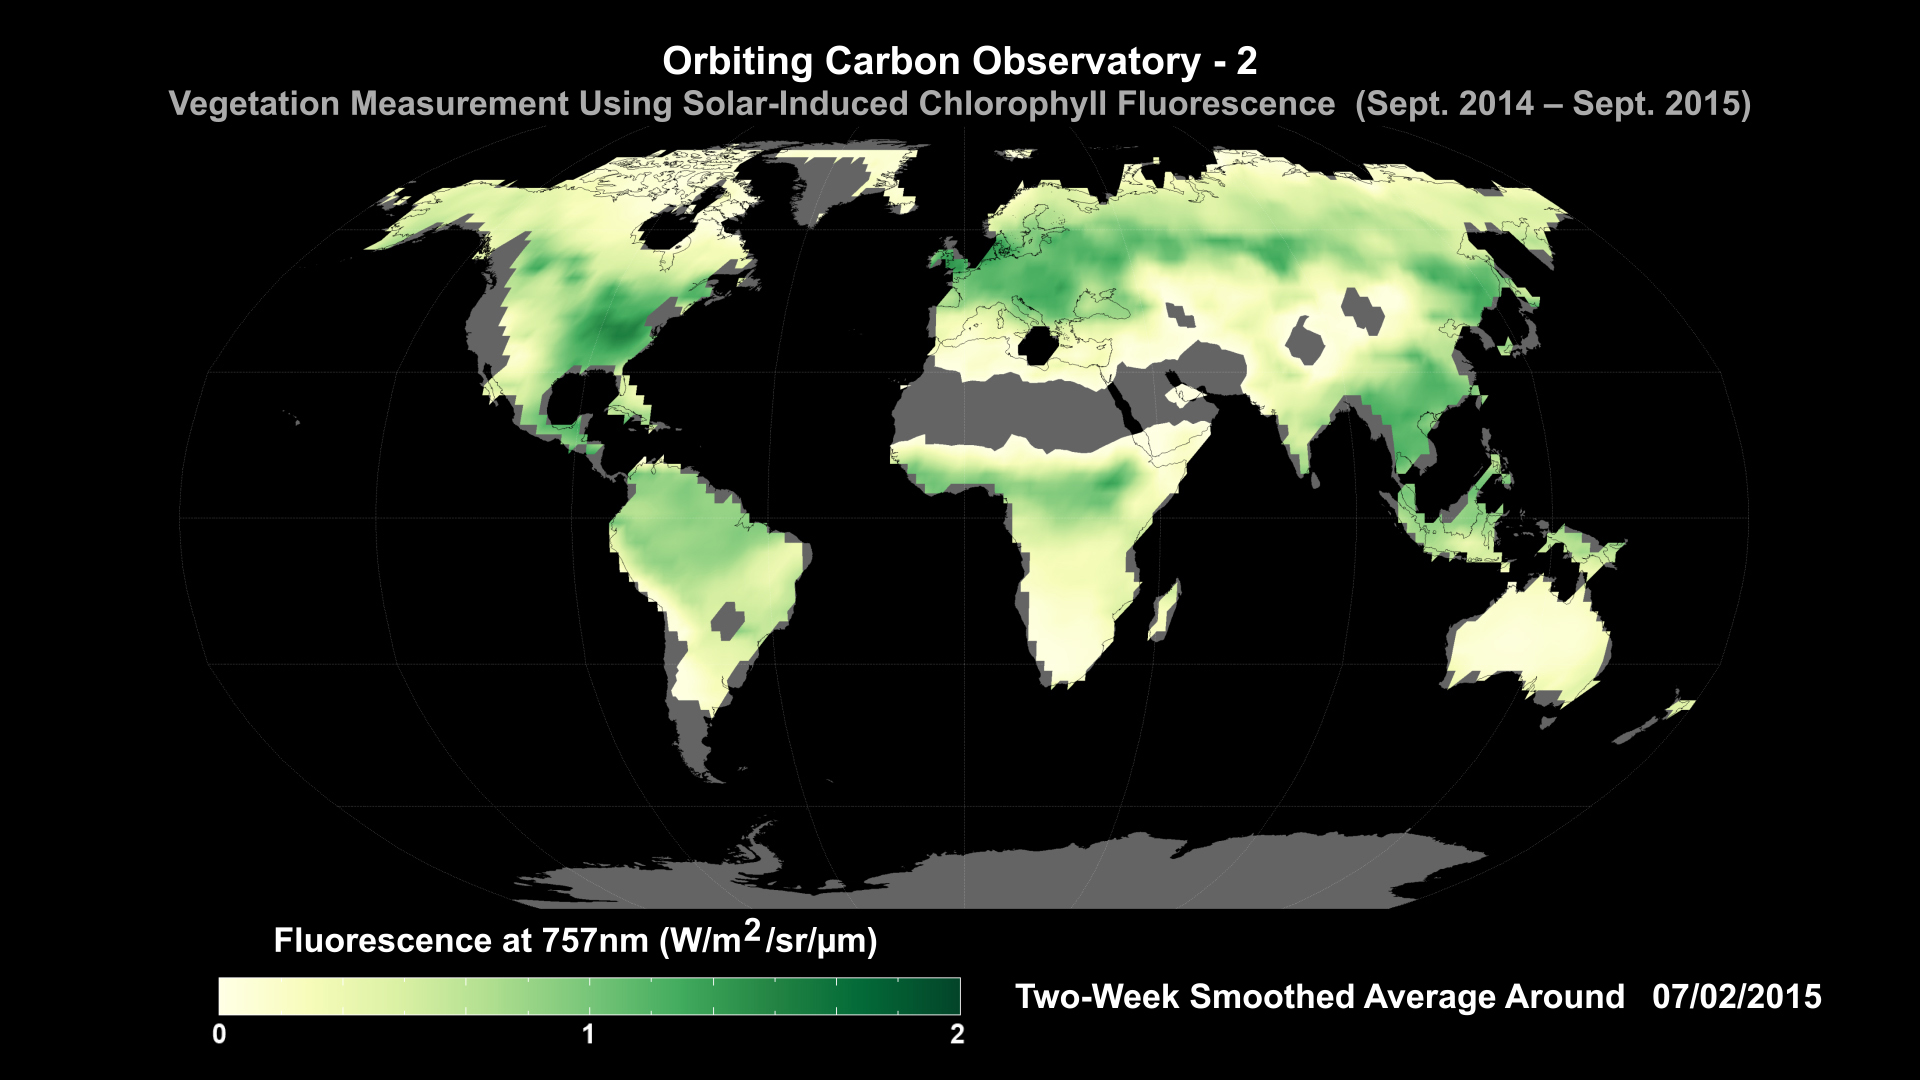
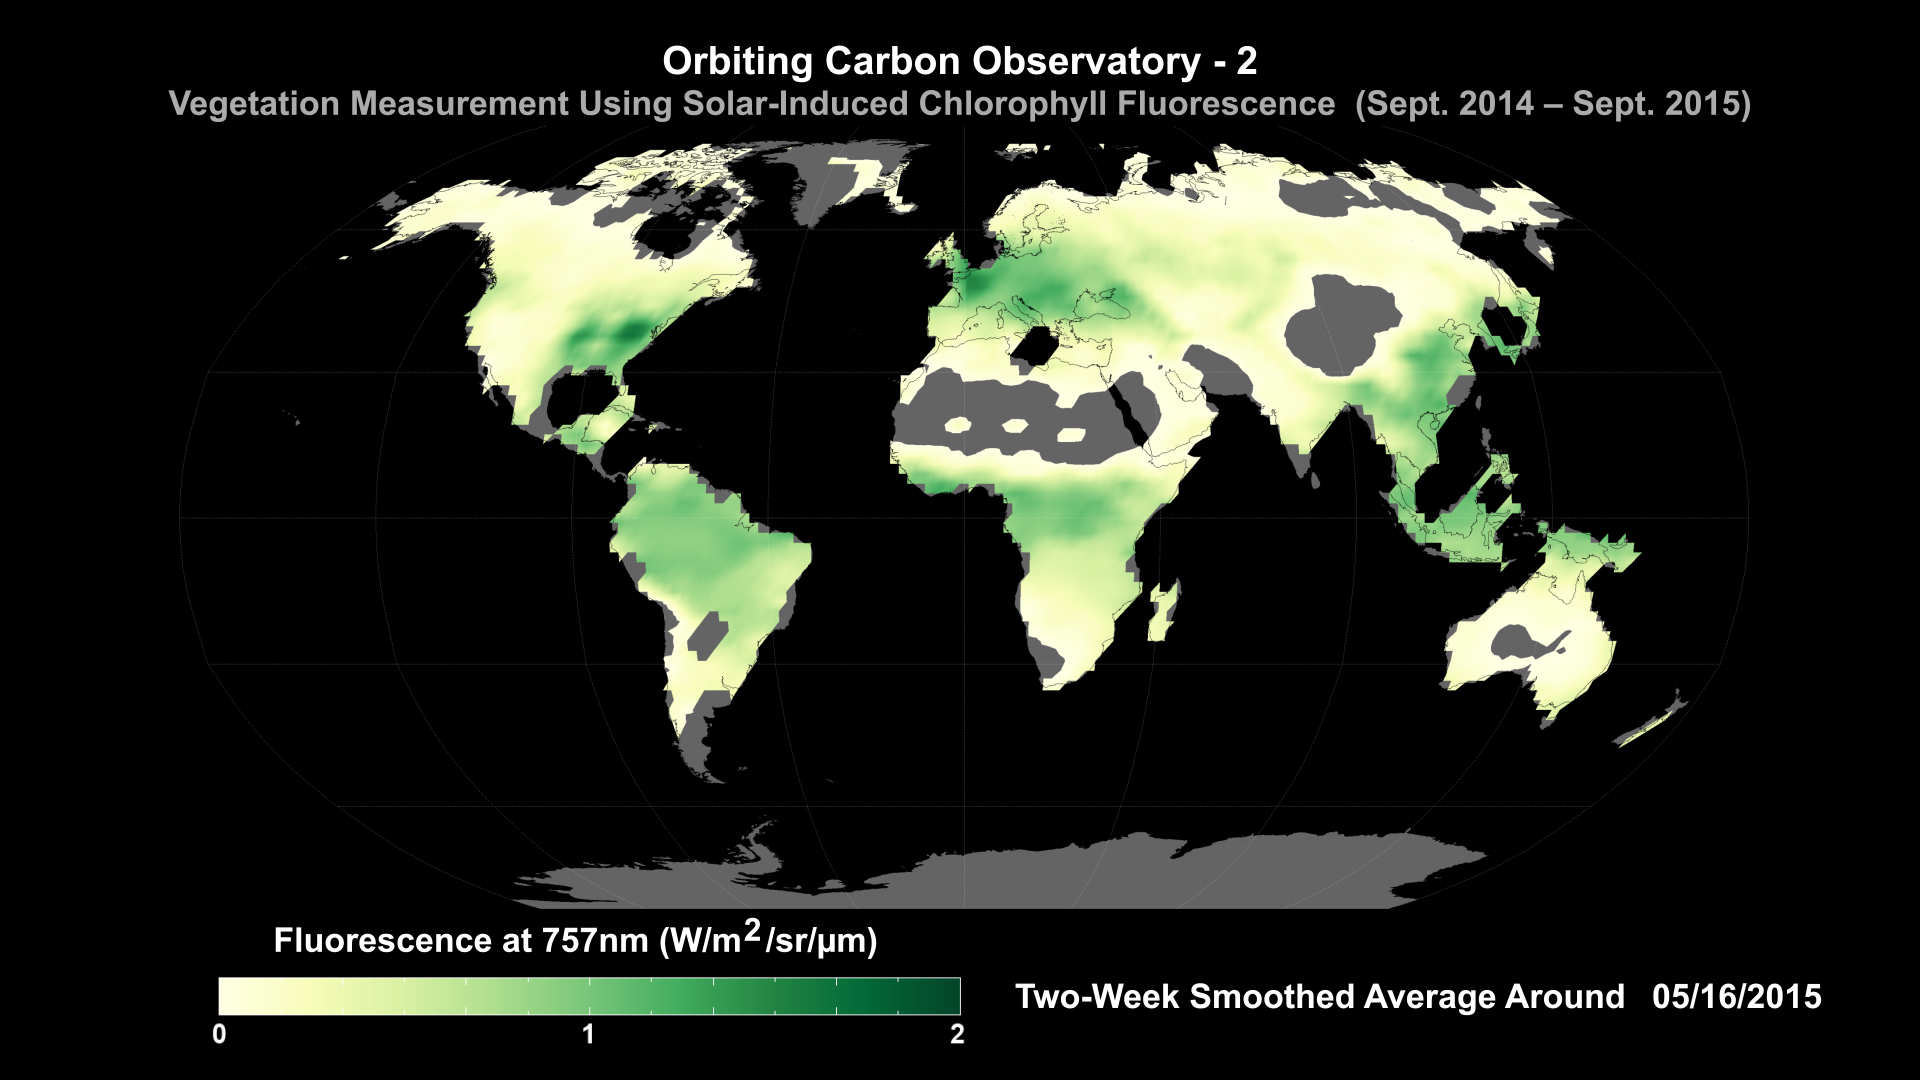
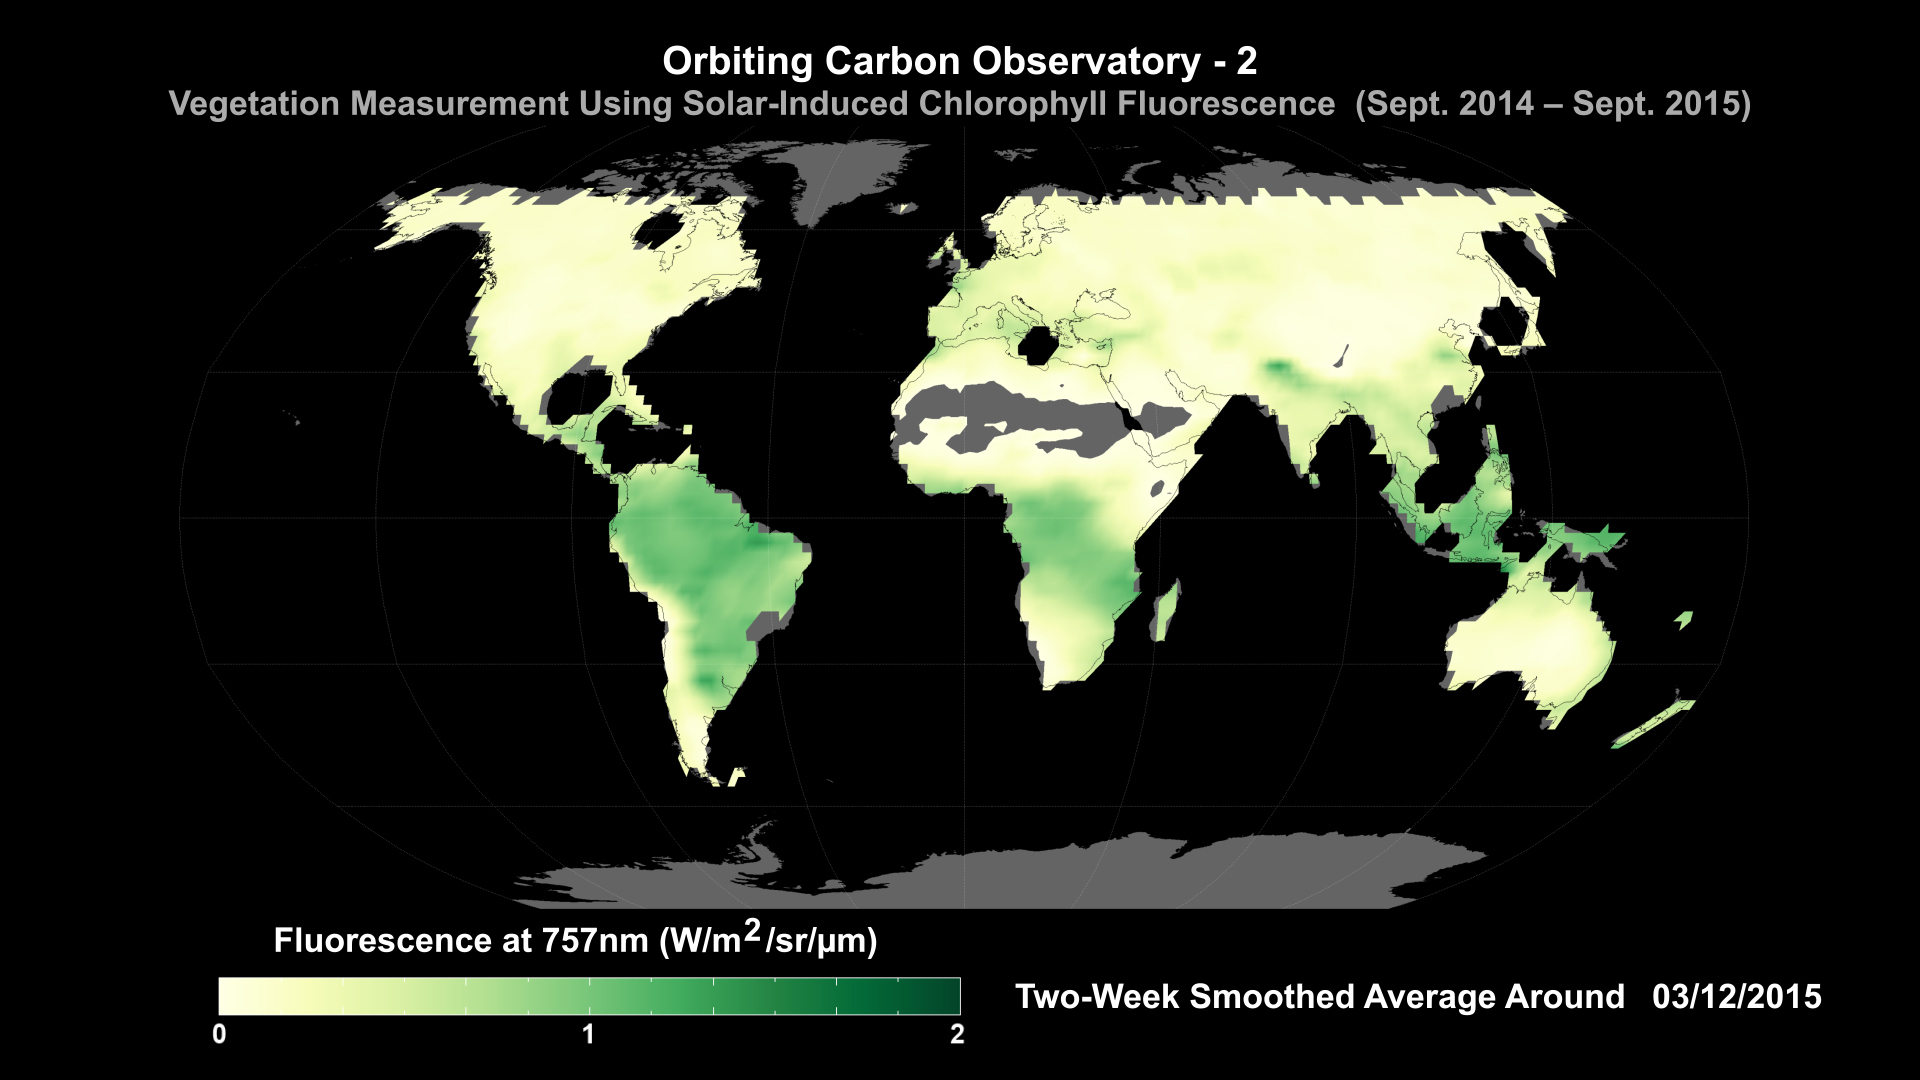
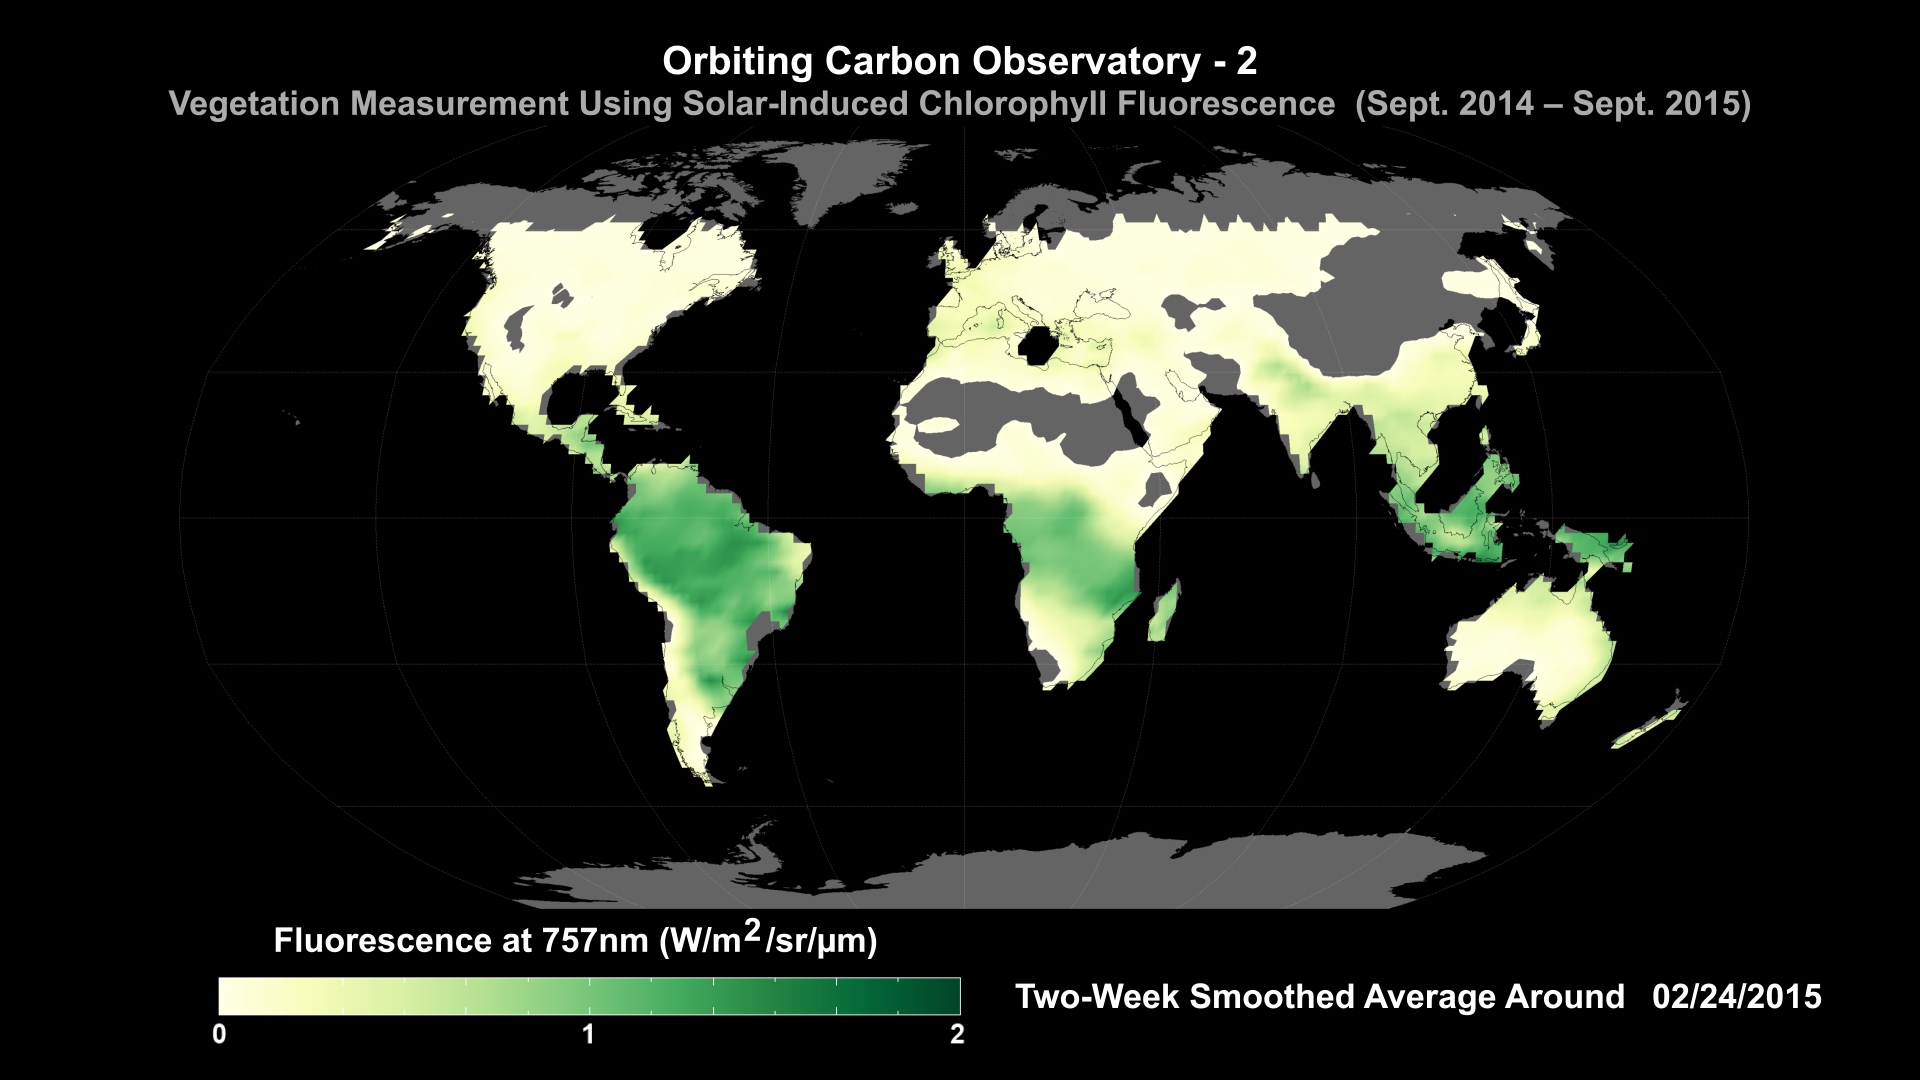
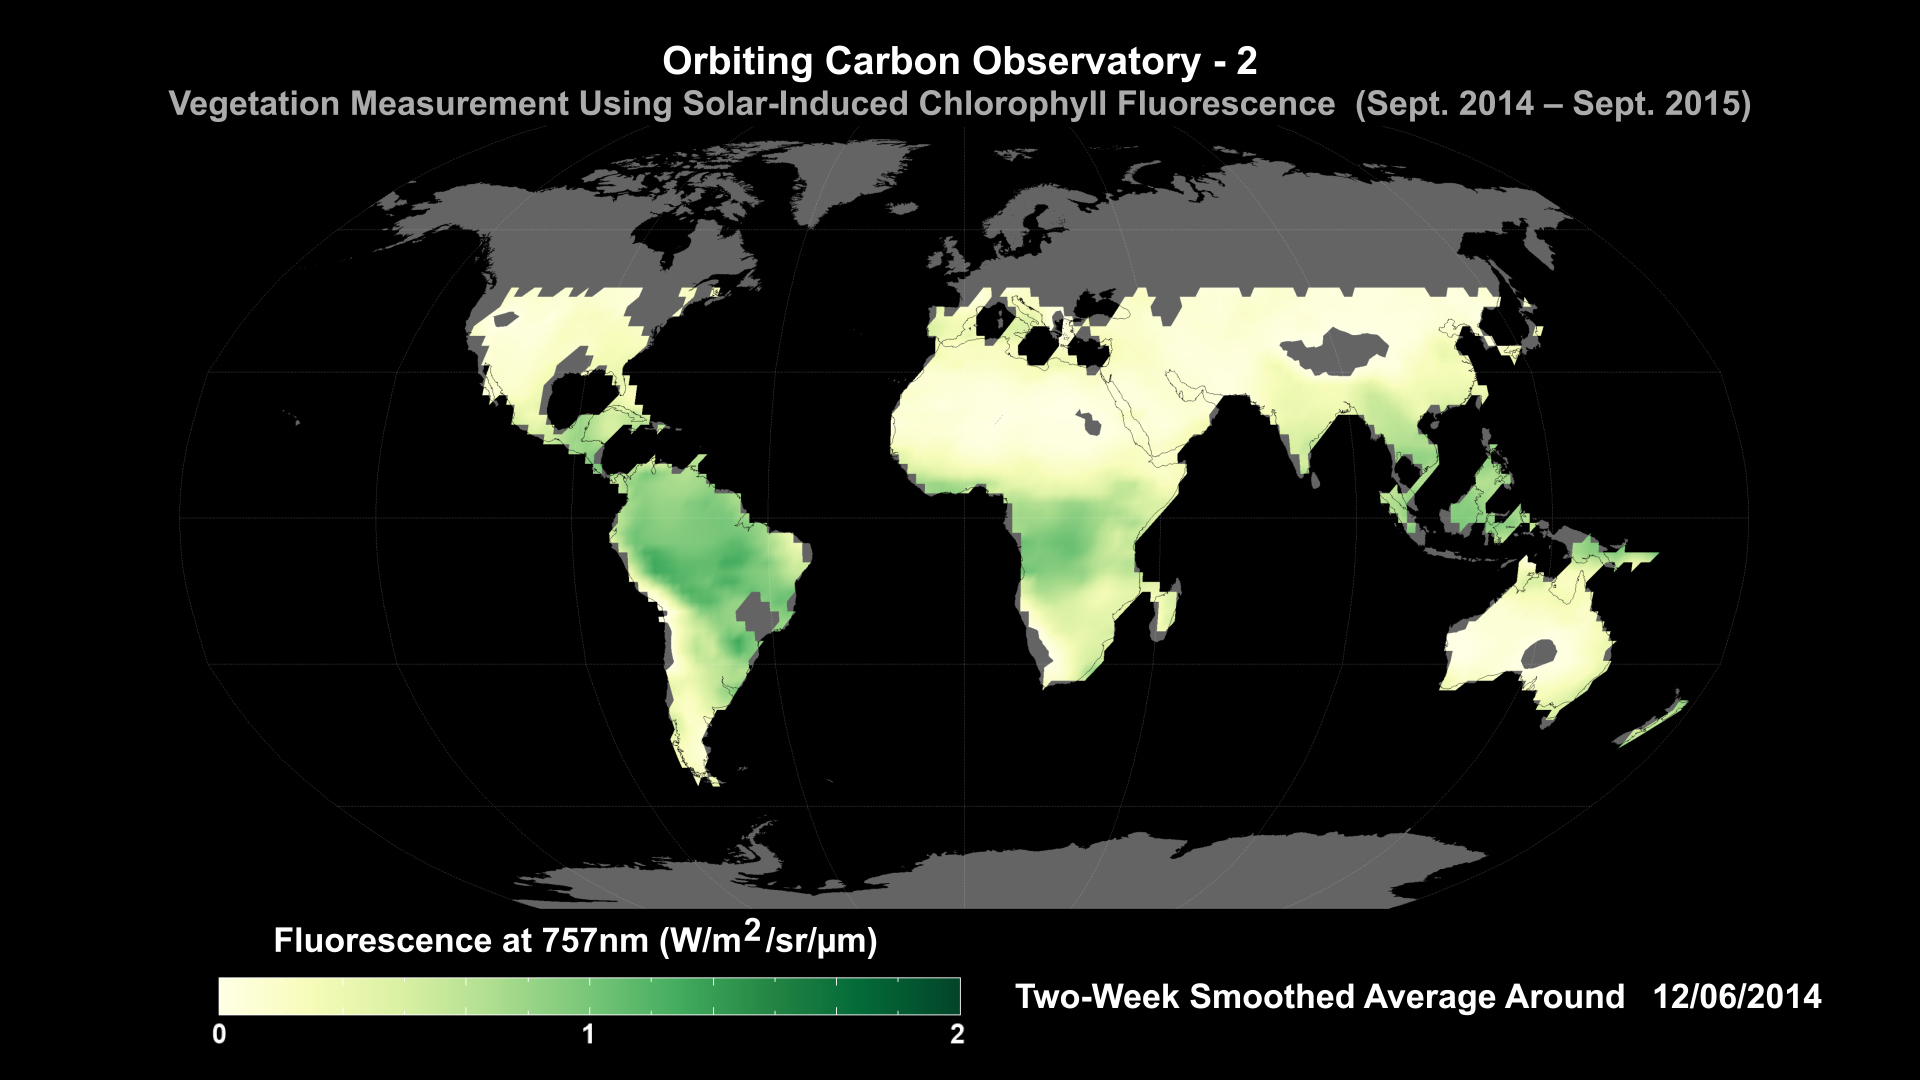
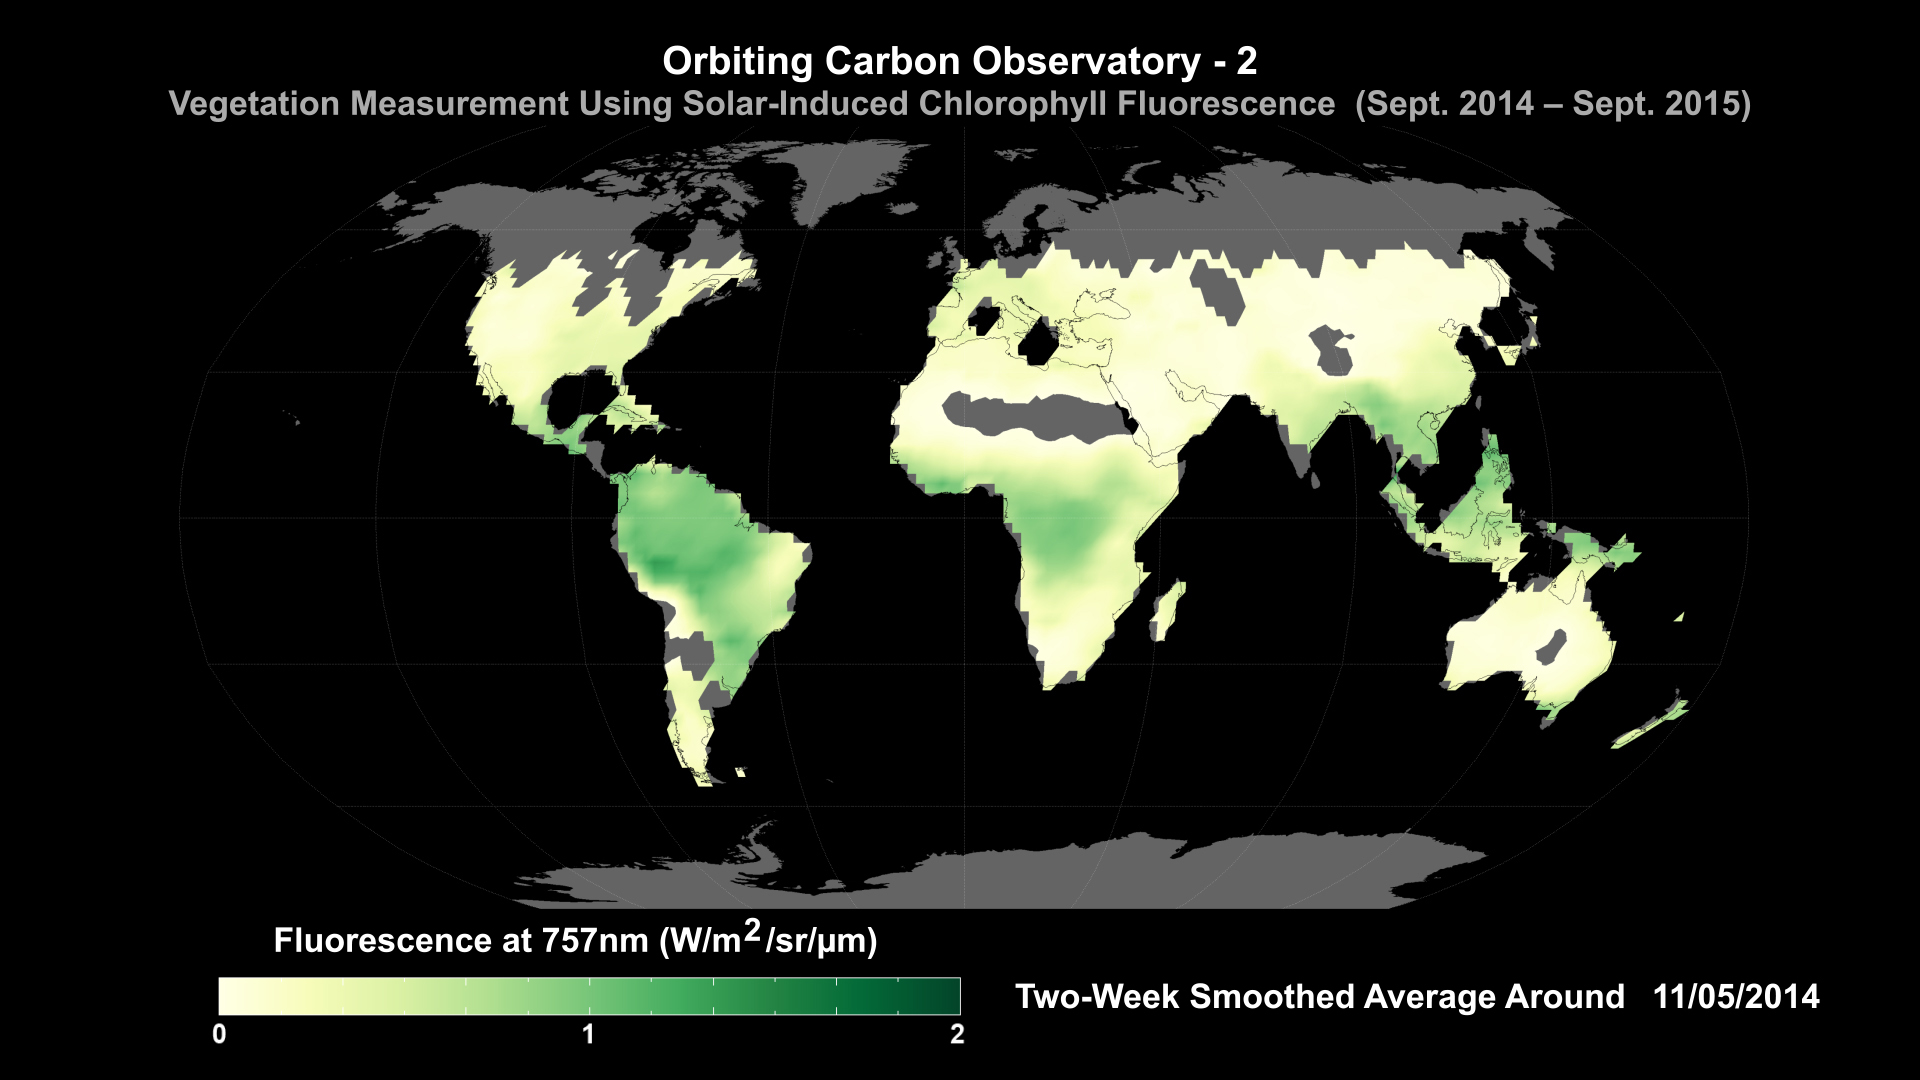
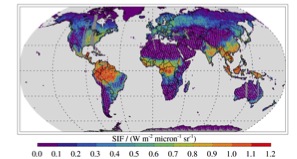
This map shows the solar induced fluorescence as captured by OCO-2 from the months of August to October 2014. Warmer colors show higher fluorescence or more photosynthetic activity relative to the other observed areas at the time period.
OCO-2 Science Team

Data map from GoSAT/ACOS
This is a sample data map of the collaboration between the Japanese mission GoSat and the NASA/JPL ACOS team.
JPL/NASA
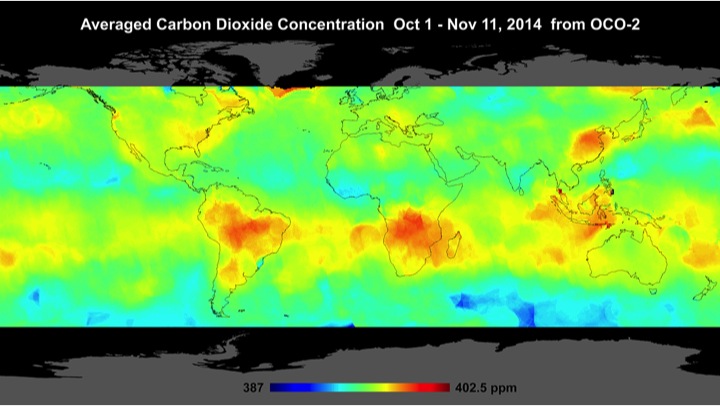
This is the first global map of averaged carbon dioxide from OCO-2. The map was unveiled at the 2014 Fall AGU meeting press conference that highlighted the unique capability of the mission.
OCO Science Team

C. Frankenberg

Global average carbon dioxide concentrations as seen by NASA’s Orbiting Carbon Observatory-2 mission. OCO-2 measures carbon dioxide from the top of Earth's atmosphere to its surface. Higher carbon dioxide concentrations are in red, with lower concentrations in yellows and greens. Scientists poring over data from OCO-2 mission are seeing patterns emerge as they seek answers to questions about atmospheric carbon dioxide.
NASA/JPL-Caltech

Global average carbon dioxide concentrations as seen by NASA’s Orbiting Carbon Observatory-2 mission, June 1-15, 2015. OCO-2 measures carbon dioxide from the top of Earth's atmosphere to its surface. Higher carbon dioxide concentrations are in red, with lower concentrations in yellows and greens. Scientists poring over data from OCO-2 mission are seeing patterns emerge as they seek answers to questions about atmospheric carbon dioxide.
NASA/JPL-Caltech


OCO-2 Global Visualization (09/20/2016 - 10/05/2016)
CAPTION
- OCO-2 Global Visualization (09/20/2016 - 10/05/2016)

- OCO-2 Global Visualization (09/04/2016 - 09/19/2016)

- OCO-2 Global Visualization (08/19/2016 - 09/03/2016)

- OCO-2 Global Visualization (08/03/2016 - 08/18/2016)

- OCO-2 Global Visualization (07/18/2016 - 08/02/2016)
- OCO-2 Global Visualization (07/02/2016 - 07/17/2016)
- OCO-2 Global Visualization (06/16/2016 - 07/01/2016)

- OCO-2 Global Visualization (05/31/2016 - 06/15/2016)

- OCO-2 Global Visualization (05/15/2016 - 05/30/2016)

- OCO-2 Global Visualization (04/29/2016 - 05/14/2016)

- OCO-2 Global Visualization (04/13/2016 - 04/28/2016)
- OCO-2 Global Visualization (03/29/2016 - 04/12/2016)

- OCO-2 Global Visualization (03/21/2016 - 03/27/2016)

- OCO-2 Global Visualization (02/25/2016 - 03/11/2016)

- OCO-2 Global Visualization (02/09/2016 - 02/24/2016)

- OCO-2 Global Visualization (01/24/2016 - 02/08/2016)

- OCO-2 Global Visualization (01/08/2016 - 01/23/2016)

- OCO-2 Global Visualization (12/23/2015 - 01/07/2016)
- OCO-2 Global Visualization (12/07/2015 - 12/22/2015)
- OCO-2 Global Visualization (11/21/2015 - 12/06/2015)

- OCO-2 Global Visualization (11/05/2015 - 11/20/2015)

- OCO-2 Global Visualization (10/20/2015 - 11/04/2015)

- OCO-2 Global Visualization (10/04/2015 - 10/19/2015)

- OCO-2 Global Visualization (09/18/2015 - 10/03/2015)
- OCO-2 Global Visualization (09/02/2015 - 09/16/2015)

- OCO-2 Global Visualization (08/17/2015 - 09/01/2015)
- OCO-2 Global Visualization (08/01/2015 - 08/16/2015)
- OCO-2 Global Visualization (07/16/2015 - 07/31/2015)
- OCO-2 Global Visualization (06/20/2015 - 07/15/2015)

- OCO-2 Global Visualization (06/14/2015 - 06/29/2015)
- OCO-2 Global Visualization (05/29/2015 - 06/13/2015)

- OCO-2 Global Visualization (05/13/2015 - 05/28/2016)

- OCO-2 Global Visualization (04/11/2015 - 05/12/2015)

- OCO-2 Global Visualization (03/26/2015 - 04/10/2015)

- OCO-2 Global Visualization (02/23/2015 - 03/10/2015)

- OCO-2 Global Visualization (02/11/2015 - 03/26/2015)

- OCO-2 Global Visualization (02/07/2015 - 02/22/2015)

- OCO-2 Global Visualization (01/21/2015 - 02/06/2015)
- OCO-2 Global Visualization (01/06/2015 - 01/21/2015)
- OCO-2 Global Visualization (12/21/2014 - 01/05/2015)
- OCO-2 Global Visualization (12/05/2014 - 12/20/2014)
- OCO-2 Global Visualization (11/19/2014 - 12/04/2014)

- OCO-2 Global Visualization (11/03/2014 - 11/18/2014)

- OCO-2 Global Visualization (10/02/2014 - 11/02/2014)

- OCO-2 Global Visualization (09/16/2014 - 10/01/2014)

- Vegetation Measurement Using Solar Induced Chlorophyll Fluorescence - 09/13/2015

- Vegetation Measurement Using Solar Induced Chlorophyll Fluorescence - 08/28/2015

- Vegetation Measurement Using Solar Induced Chlorophyll Fluorescence - 08/12/2015

- Vegetation Measurement Using Solar Induced Chlorophyll Fluorescence - 07/27/2015

- Vegetation Measurement Using Solar Induced Chlorophyll Fluorescence - 07/11/2015

- Vegetation Measurement Using Solar Induced Chlorophyll Fluorescence - 07/02/2015

- Vegetation Measurement Using Solar Induced Chlorophyll Fluorescence - 06/16/2015

- Vegetation Measurement Using Solar Induced Chlorophyll Fluorescence - 05/31/2015

- Vegetation Measurement Using Solar Induced Chlorophyll Fluorescence - 05/16/2015

- Vegetation Measurement Using Solar Induced Chlorophyll Fluorescence - 04/13/2015

- Vegetation Measurement Using Solar Induced Chlorophyll Fluorescence - 03/28/2015

- Vegetation Measurement Using Solar Induced Chlorophyll Fluorescence - 03/12/2015

- Vegetation Measurement Using Solar Induced Chlorophyll Fluorescence - 02/24/2015

- Vegetation Measurement Using Solar Induced Chlorophyll Fluorescence - 02/08/2015

- Vegetation Measurement Using Solar Induced Chlorophyll Fluorescence - 01/23/2015

- Vegetation Measurement Using Solar Induced Chlorophyll Fluorescence - 01/07/2015

- Vegetation Measurement Using Solar Induced Chlorophyll Fluorescence - 12/22/2014

- Vegetation Measurement Using Solar Induced Chlorophyll Fluorescence - 12/06/2014

- Vegetation Measurement Using Solar Induced Chlorophyll Fluorescence - 11/20/2014

- Vegetation Measurement Using Solar Induced Chlorophyll Fluorescence - 11/05/2014

- Vegetation Measurement Using Solar Induced Chlorophyll Fluorescence - 10/19/2014

- Vegetation Measurement Using Solar Induced Chlorophyll Fluorescence - 10/03/2014

- Vegetation Measurement Using Solar Induced Chlorophyll Fluorescence - 09/17/2014

- As Earth Warms, NASA Targets 'Other Half' of Carbon, Climate Equation
- Global Solar Induced Fluorescence (SIF) Map Aug-Oct 2014

- Data map from GoSAT/ACOS

- First Global Map from Orbiting Carbon Observatory

- Typical simulated fluorescence retrieval using a 16-day OCO-2 Nadir repeat cycle
- OCO-2 Global Visualization (09/18/2015 - 10/03/2015)

- OCO-2 Global Visualization (12/21/2014 - 01/05/2015)
