Lynn Kurth: The Ocean and Humans are Inextricably Interconnected, July 1, 2016

NOAA Teacher at Sea

Lynn M. Kurth

Aboard NOAA Ship Rainier

June 20-July 1, 2016

Mission: Hydrographic Survey

Geographical area of cruise:  Latitude:  58˚03.973 N   Longitude:  153˚34.292 W

Date:  July 4, 2016

Weather Data from the Bridge
Sky:  Cloudy
Visibility: 10+ Nautical Miles
Wind Direction: 010
Wind Speed: 10 Knots
Sea Wave Height: 0-1 ft. (no swell)
Sea Water Temperature: 11.1° C (51.9° F)
Dry Temperature: 12° C (53.6° F)
Barometric (Air) Pressure: 1013.3 mb


Science and Technology Log

Throughout my experience as a Teacher at Sea, it has been evident that the ocean and humans are inextricably interconnected.  This was apparent from my very first evening in Homer when I came across an eagle poised next to its colossal nest assembled in the middle of three rusty pier pilings.  An illustration of nature conforming to our presence on the water and what we deem to be acceptable for our environment.


eagle

Eagle with nest located in deep water port of Homer, AK

But, humankind must sometimes accept and conform to nature.   The fishermen of Uganik Bay have built their fishing camps above the tidal line and strung out their nets where the fish traditionally run.  Most of the men and women who live here have chosen to do so because this is where the fish are found.  One such gentlemen is Toby Sullivan, a commercial fisherman, who in 1975 headed to Alaska from Connecticut to work on the Alaskan pipeline.  Instead, he found himself fishing vs. working on the pipeline and to this day is still gill-netting salmon to make a living.  Toby’s fishing camp, East Point, located on the south shore of the Uganik Bay, has had a net on the site for the past 80 years.  And, unfortunately, we drifted into that site when a strong current took us by surprise while we were gathering water quality data over the side of the small sonar vessel.  When this happened, Toby and his crew worked swiftly and diligently to secure their fishing gear while NOAA divers were summoned from the Rainier to safely help our vessel leave the area.


enhancedtoby

Toby Sullivan and crew work to install an additional line on their fishing set

A few evenings later, Mr. Sullivan and his crew came on board the Rainier as dinner guests and a rich discussion of hydrographic work and fishing gear followed.  He explained in detail how he sets his fishing gear and offered the idea that a radio channel be utilized between NOAA’s small vessels that are working around fishing gear and the local fisherman, in order to facilitate better communication.


discuss

Toby Sullivan and XO (executive officer) Jay Lomincky

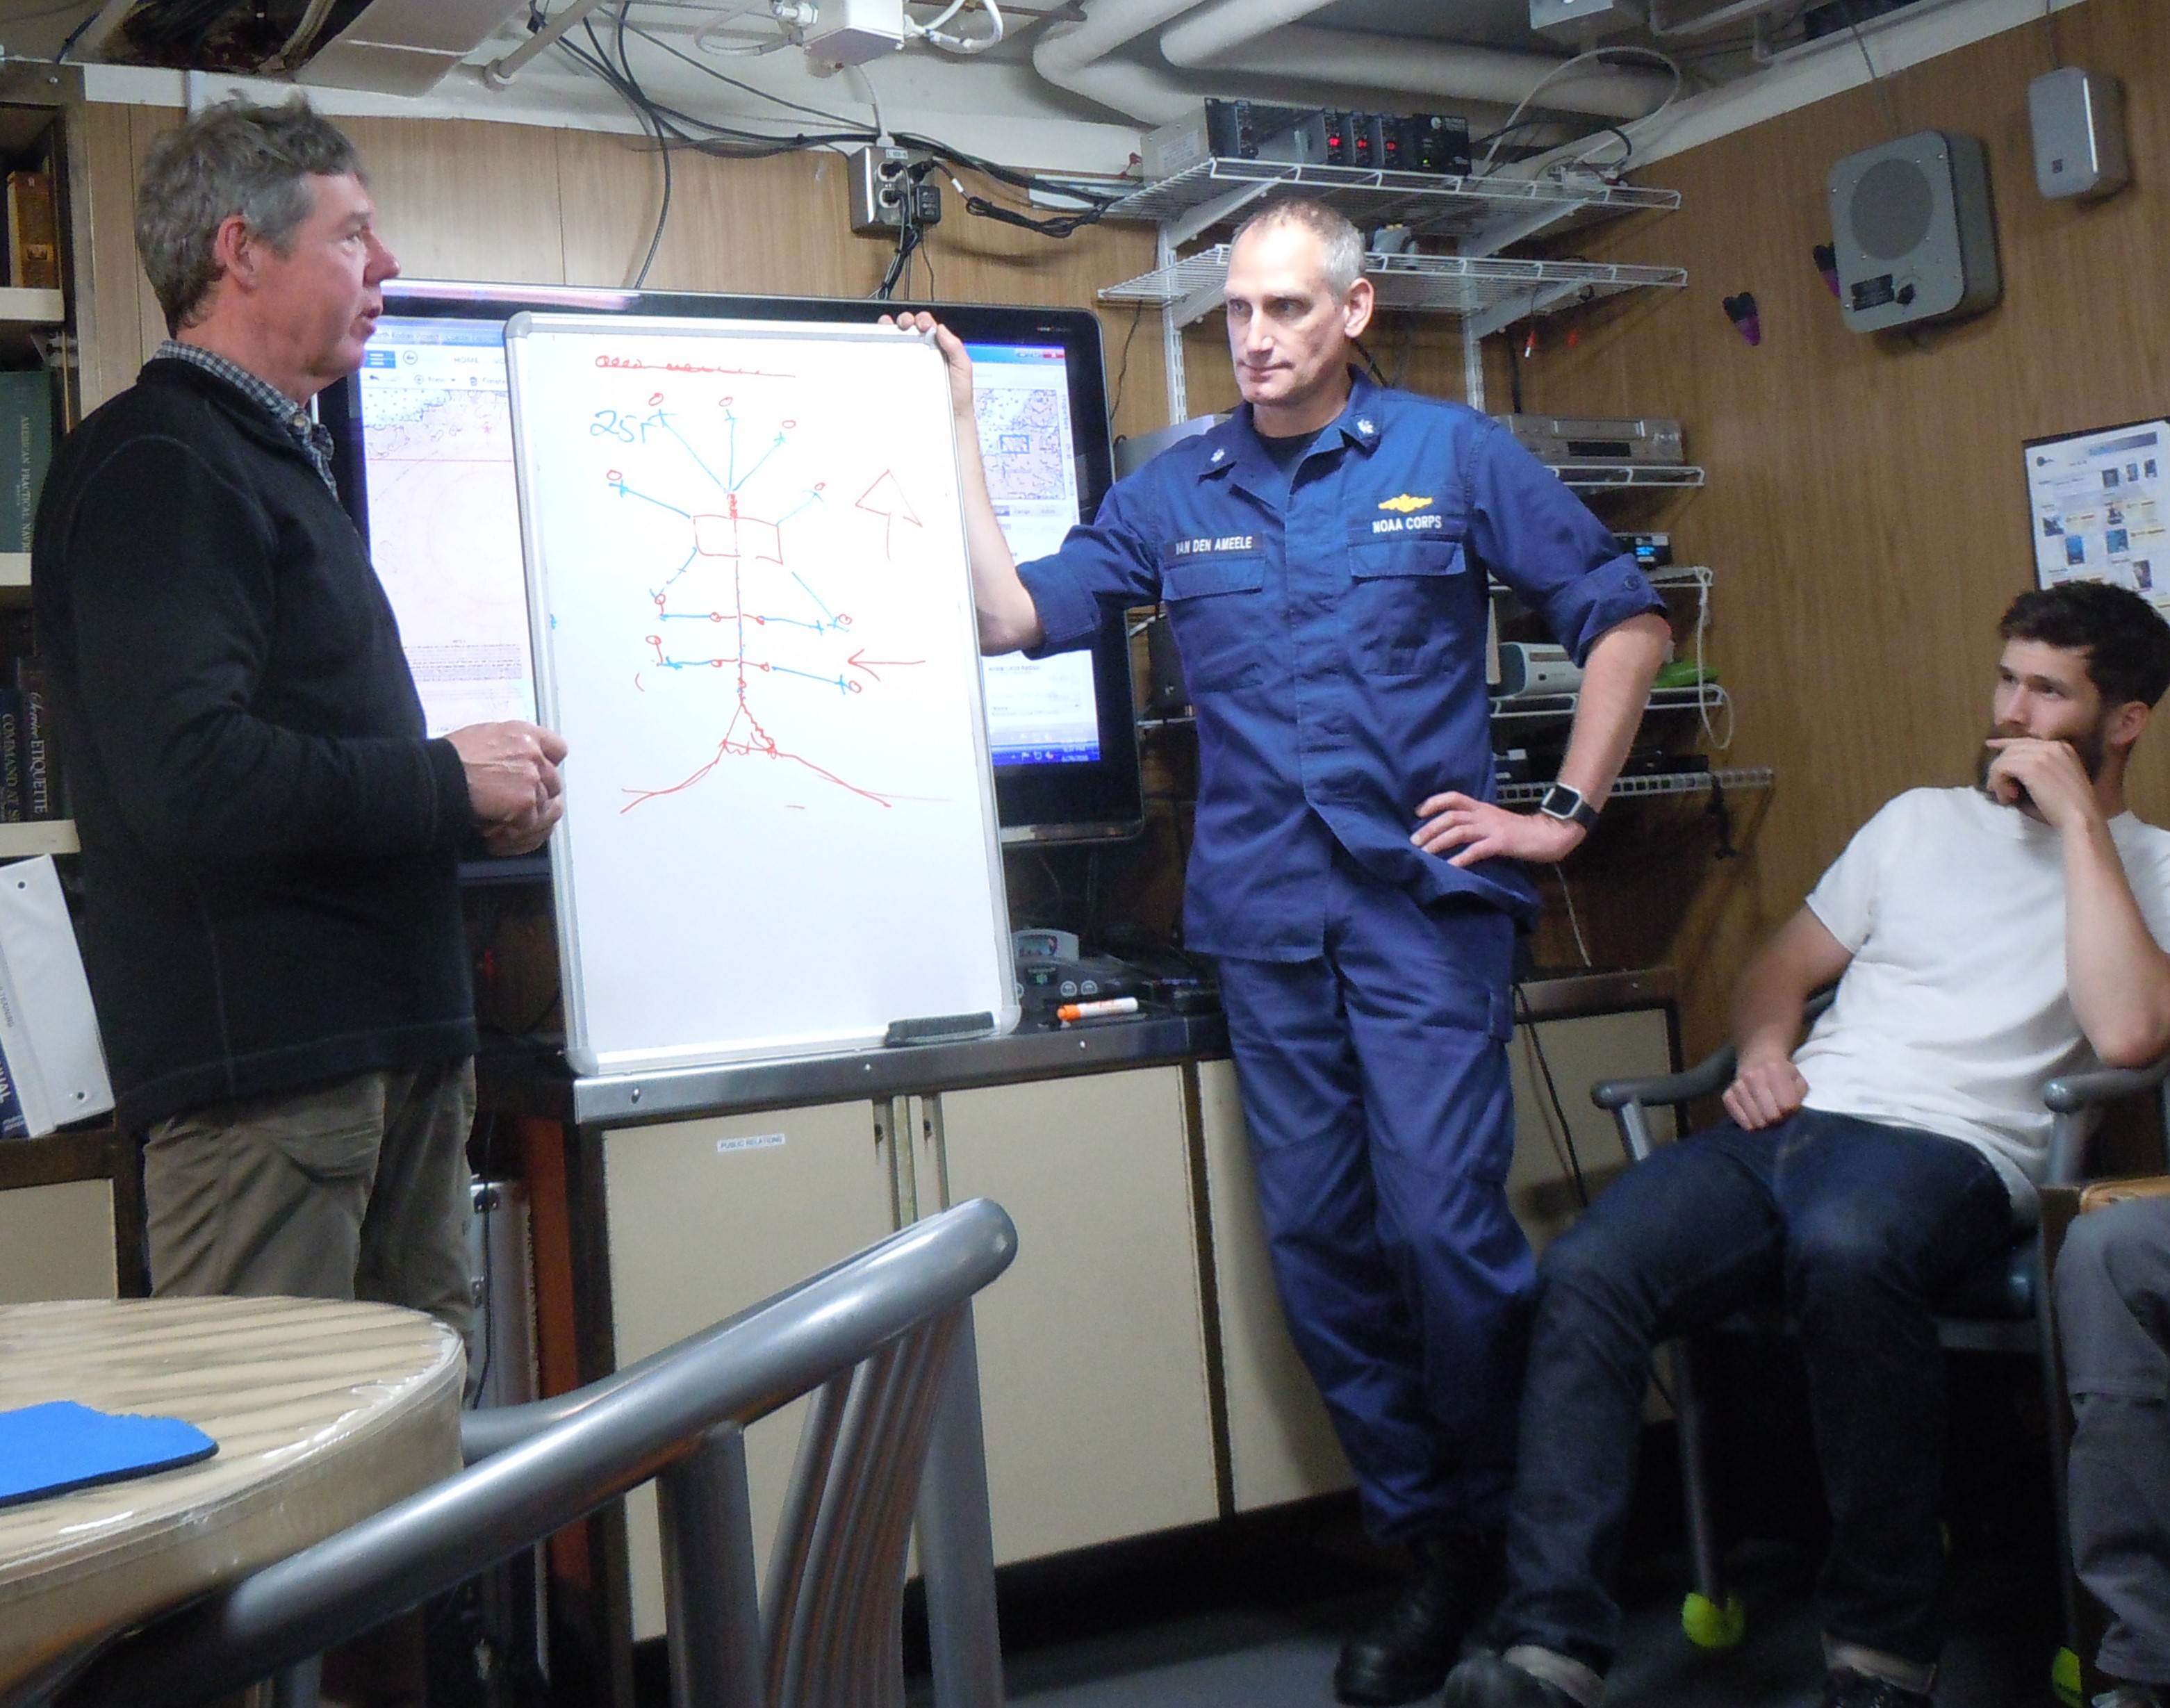
As I watched the exchange of ideas between Commanding Officer E.J. Van Den Ameele and Mr. Sullivan it appeared that both men recognized that both parties were interested in Uganik Bay because the ocean and humans are inextricably interconnected.  The Rainier’s primary mission in Uganik Bay is to gather the necessary data to create accurate and detailed charts for navigational use by the local fisherman and other mariners.  As a commercial fisherman, Mr. Sullivan’s primary interest is to keep his gear and crew safe while continuing to make a living from the harvest of local fish.

toby

Toby Sullivan shares information about how he sets his fishing gear

Today the Rainier continues on with its mission of hydrographic work at sea using the multibeam sonar which is located on the hull of the Rainier.  The swath that multibeam sonar on the Rainier covers is similar to the swath of the multibeam sonar on the smaller boats; the coverage area depends on the depth of the water.  For example, at our current water depth of 226 meters, the swath of each pass that the multibeam sonar makes an image of  is 915 meters wide.  This evening, upon the completion of the work with the Rainier’s multibeam sonar we will depart the area and be underway for Kodiak, AK.


All Aboard!

Michael Bloom serves as as survey technician aboard the Rainier and kindly took some time with me to discuss his background and work aboard the Rainier.

DSCN0300

Survey Technician Michael Bloom completes the collection of a bottom sample in Uganik Bay

Tell us a little about yourself:

I grew up in a military family, so I was actually born in England and have lived in Florida, Nebraska, Montana, Oregon and Washington.  I went to college at Oregon State University located in Corvallis, OR and majored in earth systems with a focus on marine science.

How did you discover NOAA?:  

Ever since I was a little kid instead of having posters of bands etc… I had posters of maps.  NOAA Corps participated in career fairs at my university.  I stopped at their booth my sophomore year and again my junior and senior year to learn more about their program.  After learning more about NOAA I also focused on the marine aspect of earth science because I knew I wanted to work with them.  Initially I didn’t know about the civilian side of NOAA, so I applied for the NOAA Corps two times and wasn’t accepted into the program, although I was an alternate candidate once.  At some point, when speaking with an officer he told me to apply for a civilian position with NOAA.  So, I applied and was accepted.

I’m happy to be on the civilian side because I get to work on the science side of the operations all of the time and I get to keep my beard!


DSCN0393 (2)

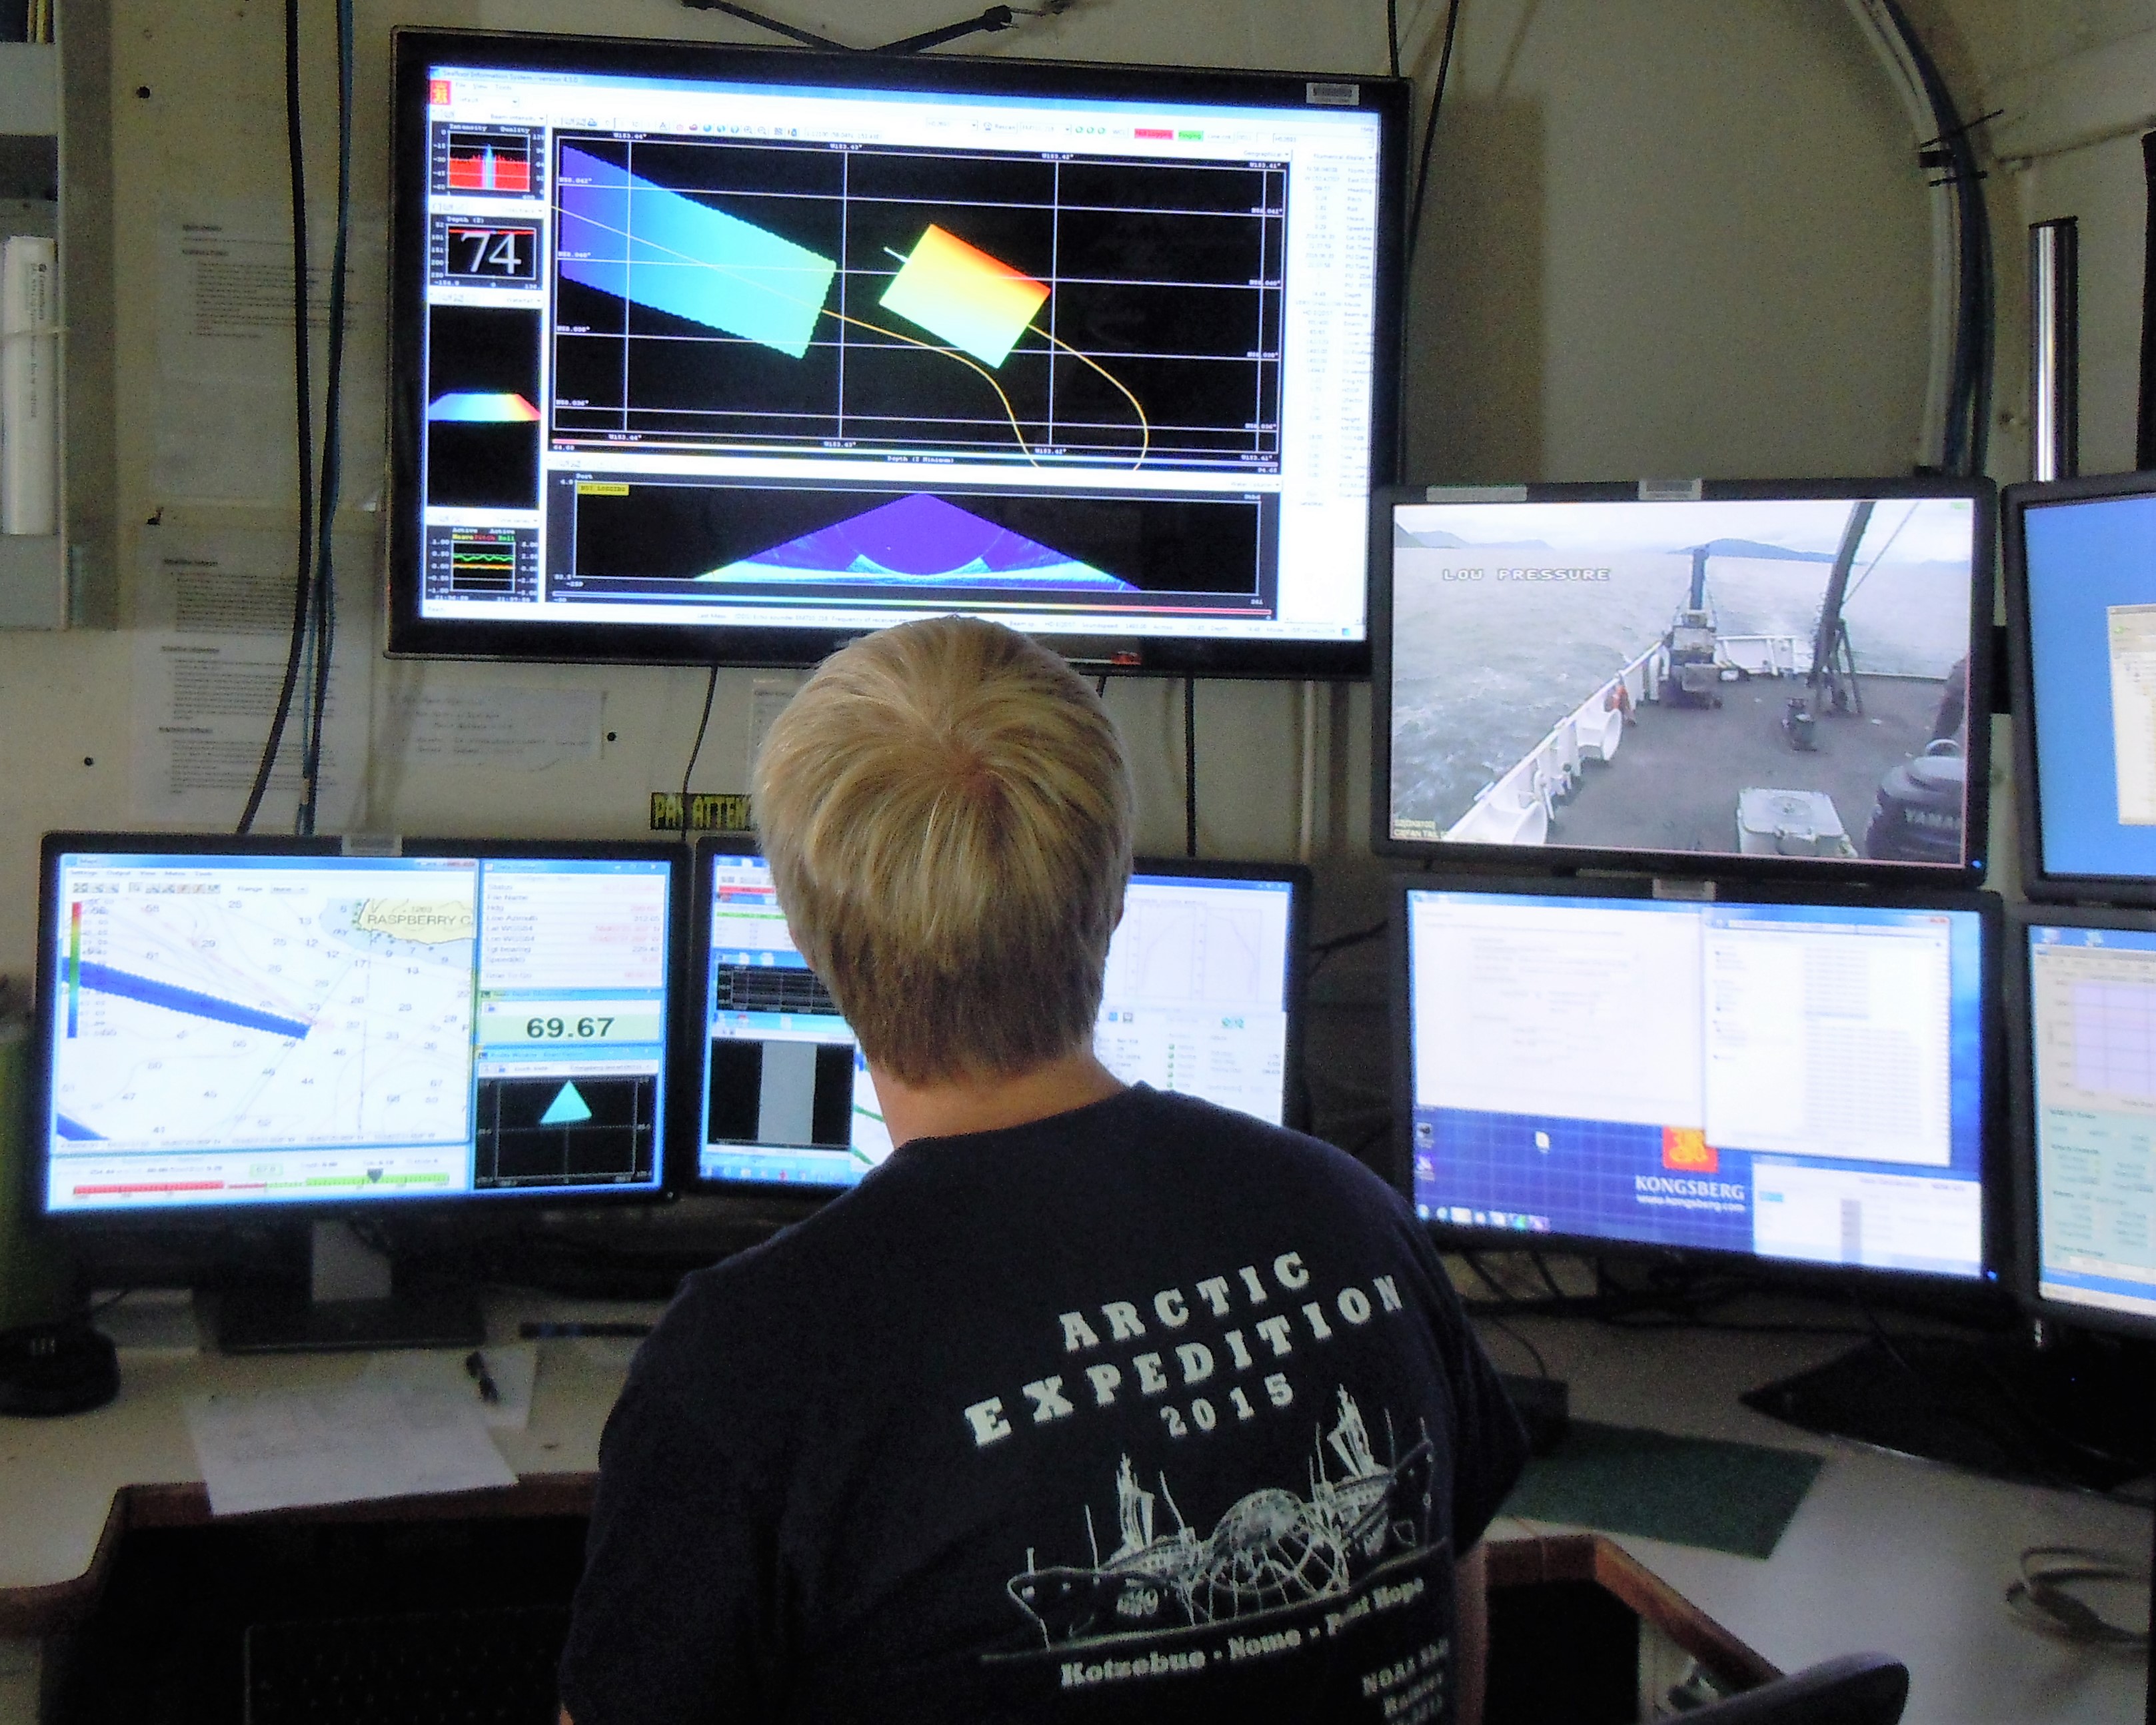
Survey Technician Michael Bloom monitors the settings of the Rainier’s multi beam sonar

What are your primary responsibilities when working on the ship?:

I am survey tech and my primary duties include data acquisition and data processing.  We can work to become the Hydrographer in Charge on the surveys after enough time working in the field and, if after the Field Operations Officer observes us, he feels confident that we are ready. Eventually I’d like to work for NOAA as a physical scientist, a job that would have me going out to sea several times a year but one that is primarily land based.

What do you love about your work with NOAA?:

I get paid to travel!  I go to places that people pay thousands of dollars to visit and I actually get paid thousands of dollars to go there.  I enjoy that I can see the real world application of the work that I do.  Scientists are using our data and ultimately we could be saving lives by creating such accurate charts.


Personal Log

NOAA’s website for the Rainier states that the Rainier is one of the most productive and advanced hydrographic ships in the world.  After spending two weeks working on board the Rainier, I couldn’t agree more.  However, I don’t believe that it is only the cutting-edge technology that makes the Rainier one of the best hydrographic ships in the fleet.  But rather a group of outstanding people at the helm of each of the different technical aspects of hydrography.  Hydrographic surveying has many steps before the end product, a chart, is released.  The people I met on board who are part of that process are teaching each other the subtle nuances of Rainier’s hydrographic mission in order to become even better at what they do.  I am grateful for the time that the crew and Officers have graciously given me while I have been on board.  I felt very welcome from the moment a NOAA Corps member picked me up at the airport throughout my stay on the Rainier as I continued to pepper everybody with questions.  Thank you Rainier!  I am confident that when I return to my classroom your efforts to help me better understand your work of hydrographic surveying will pay off.   You have given me the gift of new knowledge that, when shared with my students has the potential to ignite in them the same excitement and passion for science that so many of you possess.

DSCN0398 (2)

Teacher at Sea Kurth on the middle deck of the ship

Robert Ulmer: Build Upon a Strong Foundation, June 19, 2013

NOAA Teacher At Sea

Robert Ulmer

Aboard NOAA Ship Rainier

Underway from June 15 to July 3, 2013

Current coordinates:  N 56⁰35.547’, W 134⁰36.925’

(approaching Red Bluff Bay in Chatham Strait)

Mission:  Hydrographic survey

Geographical area of cruise:  Southeast Alaska, including Chatham Strait and Behm Canal, with a Gulf of Alaska transit westward to Kodiak

Log date:  June 19, 2013

Weather conditions:  10.93⁰C, less than 0.5 km visibility in thick fog, 95.42% relative humidity, 1013.38 mb of atmospheric pressure, light variable winds (speed of less than 3 knots with a heading between 24⁰ and 35⁰)


Explorer’s Log:  Survey, sample, and tide parties

Scientists are explorers, wandering the wilderness of wonder and curiosity their with eyes and minds wide open to events, ideas, and explanations that no other humans may have previously experienced.  And by definition, explorers — including scientists — also are builders, as they construct novel paths of adventure along their journeys, built always upon the strong foundations of their own reliable cognitions and skill sets.

Ensign Rosemary Abbitt making a level sighting measurement

Ensign Rosemary Abbitt making a level sighting measurement

Starting from their own observations of the world around them, prior knowledge, and context, scientists inject creativity and insight to develop hypotheses about how and why things happen.  Testing those ideas involves developing a plan and then gathering relevant data (pieces of information) so that they can move down the path of whittling away explanations that aren’t empirically supported by the data and adding to the collective body of knowledge, so that they and others might better fathom the likely explanations that are behind the phenomena in question.

Rainier lowering a launch vessel

NOAA Ship Rainier lowers launch vessel RA-5 for a survey excursion.

Because progress along the scientific path of discovery and explanation ultimately depends on the data, those data must be both accurate and precise.  Often these terms are confused in regular conversation, but each word has its own definition.

Approaching the shore from the skiff

A view from the skiff of the shoreline where the benchmarks and tide gauge staff already are installed.

Accuracy is a description of the degree of closeness or proximity of measurements of a quantity to the actual value of that quantity.  A soccer player who shoots on goal several times and has most of his shots reach the inside of the net is an accurate shooter.  Likewise, a set of measurements of the density of a large volume of seawater is more accurate if the sample data all are near the actual density of that seawater; a measurement that is 0.4% higher than the actual density of the water is just as accurate as another measurement of the same water that is 0.4% below the actual density value.

HAST Curran McBride visually examining the condition of the tide staff

Before making more detailed data collections, Hydrographic Assistant Survey Technician (HAST) Curran first conducts a visual inspection of the previously-installed tide staff upon arriving at the shore.

Precision (also called reproducibility or repeatability), on the other hand, is the degree to which repeated measurements under unchanged conditions show the same results.  If every shot attempted by the soccer player strikes the left goalpost four feet above the ground, those shots aren’t necessarily accurate – assuming that the player wants to score goals – but they are very precise.  So, similarly, a set of measurements of seawater density that repeatedly is 5.3% above the actual density of the water is precise (though not particularly accurate).

HAST Curran McBride collecting data near the tide staff

HAST Curran collects data near the tide staff during the closing level run in Behm Canal.

The NOAA teams that conduct hydrographic surveys, collect seafloor samples, and gather data about tide conditions must be both accurate and precise because the culmination of their work collecting data in the field is the production of nautical charts and tide reports that will be used around the world for commerce, recreation, travel, fisheries management, environmental conservation, and countless other purposes.

Cabin of the launch vessel

Crew of the survey/sample team in the cabin of the launch vessel (and the Coxswain piloting the boat)

Hydrographic surveys of some sort have been conducted for centuries.  Ancient Egyptian hieroglyphs show men aboard boats using ropes or poles to fathom the depths of the water.  In 1807, President Thomas Jefferson signed a mandate establishing the Survey of the Coast.  Since that time, government-based agencies (now NOAA’s Office of Coast Survey) have employed various systems of surveying depths, dangers, and seabed descriptions along the 95,000 miles of navigable U.S. coastlines, which regularly change due to attrition, deposition, glaciation, tectonic shifts, and other outside forces.

Analyzing data aboard the launch

Hydrographic Senior Survey Technician Barry Jackson and Physical Scientist Kurt Brown analyze historic and new data from multi-beam sonar aboard the launch vessel.

For most of that history, data were collected through a systematic dropping of weighted lines (called “lead lines”) from boats moving back and forth across navigable channels at points along an imaginary grid, with calibration from at least two shore points to assure location of the boat.  Beyond the geometry, algebra, and other mathematics of measurement and triangulation, the work was painstakingly slow, as ropes had to be lowered, hauled, and measured at every point, and the men ashore often traveled alongside the boat by foot across difficult and dangerous terrain.  However, the charts made by those early surveys were rather accurate for most purposes.

Starboard of launch vessel RA-4

Starboard of launch vessel RA-4

The biggest problem with the early charts, though, was that no measurements were made between the grid points, and the seafloor is not always a smooth surface.  Uncharted rocks, reefs, or rises on the seabed could be disastrous if ships passed above them.

HSST Barry Jackson collecting sea floor sample

HSST Barry Jackson pulls a line hand over hand to retrieve a scooped sea floor sample from a depth of more than 45 meters in Behm Canal.

HSST Barry Jackson analyzing sea floor sample

… and then analyzes what the scoop captured: mud and gravel in this case.

Starting in the 1990s, single-beam sonar became the primary mechanism for NOAA’s surveys.  Still looking straight down, single-beam sonar on large ships and on their small “launch vessels” (for areas that couldn’t be accessed safely by larger craft) provided a much more complete mapping of the seafloor than the ropes used previously.  Sonar systems constantly (many times per second) ping while traveling back and forth across and along a channel, using the speed and angle of reflection of the emitted sound waves to locate and measure the depth of bottom features.

Handwritten notes about sea floor samples

Data about sea floor samples first are recorded by hand on a chart aboard the launch vessel before being uploaded to NOAA computers later.

Sound waves travel at different speeds through different materials, based on the temperature, density, and elasticity of each medium.  Therefore, NOAA also deploys CTD devices through columns of surveyed waterways to measure electrical conductivity (which indicates salinity because of ionization of salts dissolved in the water, thus affecting solution density), temperature (which usually is colder at greater depths, but not necessarily, especially considering runoff from glaciers, etc.), and depth (which generally has a positive-variation relationship with water pressure, meaning more pressure – and thus, greater density – as depth below the surface increases).

CTD device about to be deployed

This CTD device measures conductivity, temperature, and depth in the water. All three affect the speed of the sound waves in water, and the speed of sound is a necessary bit of data when using sonar (which tracks reflected pings of sound) to determine the distance to the sea floor.

The most modern technology employed by NOAA in its hydrographic surveys uses multi-beam sonar to give even more complete coverage of the seafloor by sending sound waves straight downward and fanned outward in both directions as the boat travels slowly forward.  Even though sonar beams sent at angles don’t reflect as much or as directly as those sent straight downward, uneven surfaces on the seabed do reflect some wave energy, thus reducing the occurrence of “holidays” (small areas not well-defined on charts, perhaps named after unpainted bits of canvas in portraits because the painter seemed to have “taken a holiday” from painting there).

Acquiring hydrographic data

FOO Mike Gonsalves and HAST Allix Slagle acquire hydrographic data with the ship’s Kongsberg EM-710 multi-beam sonar.

TAS Rob Ulmer retrieving sea floor sample in Behm Canal

Aboard the small launch vessel, everyone works. This is Teacher At Sea Rob Ulmer hauling in a sea floor sample in Behm Canal.

But that’s not all.  To help sailors make decisions about navigation and anchoring – and often giving fishermen and marine biologists useful information about ecology under the waterline – NOAA also performs systematic samples of the types of materials on the sea floor at representative points in the waterways where it conducts surveys.  Dropping heavy metallic scoop devices on lines* dozens of meters long through waters at various locations and then hauling them back aboard by winch or hand-over-hand to inspect the mud, sand, silt, gravel, rocks, shells, plants, or animals can be physically demanding labor but is necessary for the gathering of empirical data.

* A note about terminology from XO Holly Jablonski:  Aboard the ship, lines have a job.  Think of a “rope” as an unemployed line.

Additionally, Earth’s moon and sun (along with several underground factors) affect the horizontal and vertical movement of water on Earth’s surface, especially due to their gravitational pulls as Earth spins on its axis and orbits the sun and as the moon orbits Earth.  Therefore, information about tides is extremely important to understanding the geography of nautical navigation, as the points below the waterline are identified on charts relative to the mean low water mark (so sailors know the least amount of clearance they might have beneath their vessels), and points above the waterline are identified relative to the mean high water mark (including notation of whether those object sometimes are fully submerged).

Evidence of tidal changes along the shoreline of Behm Canal

Can you see the evidence of tidal changes along the shoreline of Behm Canal? Color differences form strata along the rocks, and lowest leaves of the trees give further evidence of the highest reach of the water.

Ensign Damian Manda manually levels the sighting rod

Ensign Damian Manda manually levels the sighting rod upon the “turtle” using a carpenter’s bubble-leveling device.

To gather accurate and precise data about tidal influences on local waters, NOAA sends tides-leveling shore parties and dive teams into difficult conditions – commonly climbing up, down, and across rock faces, traversing dense vegetation, and encountering local wildlife (including grizzly bears here in Alaska!) – to drill benchmarks into near-shore foundation rocks, install (and later remove) tidal gauges that measure changing water heights and pressures, and use sophisticated mathematics and mechanics to verify the levels of those devices.

Pondering the next measurement

Ensign Rosemary Abbitt and HST Brandy Geiger ponder the placement of equipment before the next level measurement.

Needless to say, this description is significantly less detailed than the impressively intricate work performed at every level by NOAA’s hydrographic scientists, and in the end, all of the collected data described in the paragraphs above – and more, like the velocity of the sonar-deploying vessel – must be analyzed, discussed, and interpreted by teams of scientists with broad and deep skills before the final nautical charts are published for use by the public.

Portable tools of the trade

A leveling rod is balanced on the highest point of a “turtle,” positioned carefully to be seen from multiple points.

As you choose where and how to proceed in your own journeys, remember that you can be more confident about your decision-making by using information that is both accurate and precise.  And keep exploring, my friends.

View from the benchmark

This is the view from the benchmark atop a rocky outcropping (under an 80-foot evergreen) along Behm Canal while righting a measurement rod with the tide gauge leveling party.

Did You Know?

NOAA Ship Rainier in Behm Canal with launch vessels underway

NOAA Ship Rainier in Behm Canal with launch vessels underway

Every ship in the NOAA fleet also is a voluntary mobile weather station, and so are many other seagoing vessels around the world.  For many years ships have been required to report their locations and identities on a regular basis to agencies like the U.S. Coast Guard and local or regional harbormasters.  Those periodic reports were (and still are) vital for local traffic control on the waters and for helping to provide quick response to emergency situations on vessels at sea.

View aft while launch is underway

The view aft through Behm Canal from the launch vessel

Eventually, someone insightful realized that having the ships also provide weather reports from their positions along with those identity-and-location reports would make a much richer and broader network of timely data for the National Weather Service, which is another branch of the National Oceanic and Atmospheric Administration.  As NWS adds the weather data from those many boats to the data gathered at land-based NWS stations and from voluntary land-based reporters of conditions, their models and forecasts become stronger.

(For more info about being a volunteer weather observer or volunteering with NOAA in some other capacity related to oceans, fisheries, or research, please visit www.volunteer.noaa.gov.)

Especially because weather conditions are the results of interactions among local phenomena, regional climate, and the global systems, building more accurate and precise forecast models depends on information from everywhere, but the result is that everyone benefits from the better forecasts, too.

Evidence of tectonic activity and rundown

Southeast Alaska is area with frequent tectonic activity, including uplift and earthquakes. Here a scar among the trees on the mountainside shows evidence of tectonic shifts, which also creates a ready path for meltwater to move downhill from the snowy mountaintop to the seawater below, taking trees and soil with it.

NOAA Ship Rainier ready for the returning skiff

NOAA Ship Rainier waits offshore, ready to receive the skiff returning with the tide/level shore party.

Paige Teamey: November 7, 2011

NOAA Teacher at Sea
Paige Teamey
Aboard NOAA Ship Thomas Jefferson
October 31, 2011 – November 1, 2011

Mission: Hydrographic Survey
Geographical Area: Atlantic Ocean, between Montauk, L.I. and Block Island
Date: November 7, 2011


Weather Data from the Bridge

Early Morning Sunrise

Clouds: 2/8 Cu, Ci
Visibility: 10 Nautical Miles
Wind: SE 21 knots
Temperature 14.0° Celsius
Dry Bulb: 14.1 ° Celsius
Wet Bulb: 12.0 ° Celsius
Barometer: 1024.2 millibars
Latitude: 41°08’232″ ° North
Longitude: 072°04’78″ ° West

Current Celestial View of NYC:

Current Moon Phase:

Current Seasonal Position (make sure to click on “show earth profile):

http://www.astroviewer.com/ http://www.die.net/moon/ http://esminfo.prenhall.com/

OR

http://www.learner.org/

Science and Technology Log

Monday started with my alarm beckoning my eyes to open at 4:15am.  I found my right pointer finger hitting snooze not once, but twice, only to finally move myself from the medium of a dreamlike state to a stand-up position at 4:36.  I made it to the galley for breakfast and a safety brief for the 3102 launch.

Safety Brief. Mapping locations and surveys to be accomplished along Fisher Island.

Today I will be joining COXSWAIN Tom Bascom and HIC  Matt Vanhoy to perform near-shore surveying on sections that have both holidays and missed information.  Holidays do not mean we will be scanning for Santa’s missing sleigh, or find Columbus’s ship Santa Maria run aground, but rather areas that have been previously surveyed and unfortunately recorded absolutely no information.  Holidays occur sometimes due to rough seas, oxygen, as well as possible rocky ocean floors.

After Tom, Matt, and I were lowered in the 3102 by the davit and help of the TJ crew, we went to Fisher Island and began the slow mowing movements of surveying.  The ride to Fisher Island was incredibly bumpy and the entire deck was wet from the swells pushing up at the bow.  Currently there are winds upwards of 16 knots and a chill in the air.  Vanhoy is below deck in the surveying room and Bascom is manning the boat.  Me, well, I am observing for now and loving the chaotic changing seas.  After about 2 hours on deck with Tom I went below to the survey room… that lasted about 20 minutes.  I became really sea sick and returned to deck with Tom.  Matt told me that he often gets sea sick while surveying on the launches and will come up to the stern, puke, and continue on through the day (wow).  When you are on a launch the motions of the ocean are magnified and you can feel the movements much more so than on the ship.

Polygons and

While we were passing by the massive houses located on Fisher Island, Tom commented that unless there is love inside the homes, they are like the numerous clam shells we find already emptied and eaten by fish and gulls.  He said that peace and happiness is not a large house, but the land that surrounds the home.  Tom has been on the open waters for the past 30 years and has found solace in simplicity.  He is a determined individual who presses on and is concerned with following protocol and ensuring the safety of those around him.

After lunch we finished our survey sections and still had 3 hours before needing to return so went around the area and collected bottom samples.  Bottom samples (BS) is probably the most fun thing I have been able to help with on the ship.  We used a  device called the Van Veen Grab system and lowered it into the water. When we thought the Sampler was in contact with the ocean floor we pulled a few times up and down on the line and then hoisted the grabber to the deck.

The bottom samples are taken for the fisheries division as well as for ships that are interested in areas that they will be able to anchor in.  For the most part we pulled samples of course sand and broken clam shells (I hope this is no reflection of Fisher Island).  The further away from the shore line we went the more courser the sand became as well the more rocks we sampled.  Most of the rocks were metamorphic and consisted of marble and a little quartzite.  This surprised me given the location.  I though most of the rocks would be sedimentary based on the surrounding topography and surface features.

I appreciate Tom and Matt taking the time to review and connect me into each process.  Tom taught me how to drive the launch… that was really FUN.  With all of the monitors it was hard to discern between reality and a glamorous video game.  Radar showed me where I was going, and a survey map outlined the areas I was trying to move to in order to take the next bottom sample.  Watching everything at once is not easy to do because you also have to pay attention to the waters.  The shoals (shallow waters) often have “pots” which are lobster traps placed everywhere.  The pots have a cage on the bottom of the ocean floor and a huge buoy at the surface so you can locate them and steer clear of them.

Upon returning to the ship, I watched yet another amazing sunset and Matt take the survey data from the ship and upload it on the ship’s network while Tom and ENS Norman hosed down the salt from the deck and prepped the 3102 for a new day.

ENS Norman Hosing down 3101 after surveying Fisher Island for the day.

Sue Zupko: 6 Flying to 300 Meters

NOAA Teacher at Sea: Sue Zupko
NOAA Ship: Pisces
Mission: Study deep water coral, Lophelia Pertusa, in the Gulf Stream
Geographical Area of Cruise: SE United States in Gulf Stream from off Mayport, FL to south of St. Lucie Inlet, FL
Date: June 3, 2011
Time: 15:33 EDT

Weather Data from the Bridge
Wind Speed: 2.59 knots
Visibility: 10 n.m.
Surface Water Temperature: 28.25°C
Air Temperature:28.9°C
Relative Humidity: 61%
Barometric Pressure:1018.20mb
Water Depth: 280.94 m
Salinity: 36.33 PSU

Hello from the Pisces “flight” deck.  I am sitting next to the pilots of the ROV.  John Butler is currently flying the ROV at a depth of 243 meters.  We are drifting with the ship as it makes its way to our survey site.  The ROV has been in the water since around 9:00 this morning EDT and we have finished our lunch and are waiting to get to our drop site.  Why is the ROV flying along at 243 meters when our survey site is at 300 meters?  When the ROV first launched, the current was 3.5 knots above and below the surface.  The ship’s crew on the bridge calculated how long it would take for us to arrive at the dive site given the currents.  Once we started flying the ROV at depth, we found the counterweight acted as an anchor and the current slowed down above and below the surface.  Accordingly, the ROV slowed down and it’s taking a lot longer to get to our dive site than originally calculated.

Jelly with tentacles spread out floating in the water column.

Jellyfish found on the way to the sea floor

What are we seeing on the video feed from the ROV?  Lots of marine snow–detritus, zooplankton, and other small particles, plus a few interesting creatures– jellies,  salps, several squid,  arrow worms, and some hydrozoa.  It really is surreal watching the video of our journey to the bottom of the sea.

Two men with helmets holding the ROV over the side of the boat, helped by a winch.

Crew Members holding the ROV, helped by a winch

What are we expecting to find? Lophelia pertusaLophelia is a ture hard, or stony, coral from the phylum Cnidaria, class Anthozoa (meaning it is a polyp), class Anthozoa (starts as a larva swimming around and then becomes attached to something, or sessile).  We want to find out how many there are, their health, their size, and what is living amongst them.  Lophelia are white when they are alive, unlike shallow water corals that most people are familiar with which have colors from the algae which live with them.  If the Lophelia is not white, it’s either sick or dead.

David Altizio, May 19 – 20, 2010

NOAA Teacher at Sea
David Altizio
Onboard NOAA Ship Fairweather
May 17 – May 27, 2010

NOAA Teacher at Sea: David Altizio

NOAA ship Fairweather
Mission: Hydrographic survey
Geographical Area of Cruise: SE Alaska,
from Petersburg, AK to Seattle, WA
Dates: Wednesday, May 19 and Thursday, May 20

Weather Data from the Bridge

Position: Customhouse Cove                       Position: Behm Canal
Time: 0800 on 5/19                                        Time: 0800 on 5/20
Latitude: 550 05.97’ N                                   Latitude: 55017.77’N
Longitude: 1310 13.8’ W                                Longitude: 130058.03’W
Clouds: Overcast                                               Clouds: Mostly Cloudy
Visibility: 10 miles                                           Visibility: 10 miles
Winds: 6 knots from the SE                            Winds: 14 knots from the SW
Waves: Less than one foot                              Waves: Less than one foot
Dry Bulb Temperature: 13.00C                   Dry Bulb Temperature: 12.50C
Wet Bulb Temperature: 12.50C                   Wet Bulb Temperature: 10.50C
Barometric Pressure: 1010.5 mb                Barometric Pressure: 999.9 mb
Tides (in feet):                                                      Tides (in feet):
High @ 0447 of 14.6                                        High @ 0558 of 14.0
Low @ 1128 of ‐0.7                                           Low @ 1233 of 0.2
High @ 1802 of 13.2                                         High @ 1909 of 13.9
Low @ 2349 of 4.0
Sunrise: 0429                                                      Sunrise: 0418
Sunset: 2055                                                        Sunset: 2102

Science and Technology Log

On Wednesday, May 19, I was able to go out on a small boat launch. Four such boats were deployed from the Fairweather that morning. They all use 400 kilohertz multi‐beam sonar to map the bottom of the channels we are currently in, near Ketchikan, AK. This type of SONAR sends out 512 beams/ping of sound, and is most effective in shallow water. The area or swath that can be scanned at anytime is about 5 times the depth of the water. Therefore in shallow water the swath is much narrower and in deeper water the swath is much wider. Most of the work today on all of the launches was filling in small areas in the chart in which data was missing or not dense enough to complete the project. These areas are referred to as “holidays”, because they are areas where previous survey launches have been through the area and the data was not good enough. Some possible reasons for this could be that they are areas where acoustic noise was picked up by the multi‐beam SONAR, or where shadows were cast from the surface bedrock or boulders on the bottom of the channels. The area that we surveyed first is called Cascade Inlet.

Me on a small boat (launch) to survey the bottom of channels around

Me operating the multi‐beam sonar on the small boat launch

Not only did I get to use the computers on board to operate the SONAR and collect data, I was also able to deploy an instrument called a CTD that measures the conductivity, temperature and density of the water. This is very important because the speed of sound in water changes depending on the waters temperature density and conductivity. For example, the top layer of the water is typically a little warmer, less dense and less salty than deeper water due to influences from rain and inputs from rivers. When using SONAR you must know all of these factors in order to understand the speed at which sound waves will travel through the water. The sound waves will travel faster in cold deeper water, and the computer models take this into account before finalizing a chart. Ideally when using the CTD the sample must be taken at a depth that is greater than any spot you have surveyed so as to have a complete profile of these factors.

Me on a small boat (launch) pulling the CTD sampler back onto the boat.

In the afternoon we spent most of our time performing shoreline verification of small features around an area called Hog Rocks that have been previously identified. Here we used GPS (Global Positions Satellites), latitude and longitude, azimuth bearings, elevation and photos. As the name implies we were visiting small features to double check their exact location and exact heights.

On Thursday, May 20 I was scheduled to go out on a launch boat again but things did not go accordingly. There was a problem with the Davit, a mechanical crane that picks the 7 ton, 28 foot survey launch off the decks of the Fairweather and deploys them into the water. Since I was unable to go out and scan shallow water from the launch, I stayed on the Fairweather to scan and plot deeper water (approximately 400 meters) in and around Behm Canal. From the plot room of the ship I helped operate the computer, by starting and stopping the collection of data. In addition to filling in “holidays” we also mapped some cross lines. Cross lines are lines that run perpendicular to the main channel and are a means of verifying previous scans or quality control.

Example of shoreline features near Hog Rocks that we were verifying from the launch boats

Me, in the plot room on the Fairweather, collecting data.

Personal Log

I can’t say that the launch on May 19 was fun, but it was very cool and interesting. One thing no one told me was that after the morning rain was over that the sun would come out and it would reach almost 60 degrees, and that I should have brought sunscreen and a hat: warmer than it was in NY on this day. I now know for future launch days. I am usually going to be scheduled on a different launch team, doing slightly different tasks each day.

For now I just finished dinner, and yes it was very good again. In the meantime I am awaiting a debriefing of the day’s launches, and then hang out until bed. Before going to bed I went up to the highest deck on the Fairweather, called the flying bridge and watched one of the most beautiful sunsets unfold in front of my eyes.

What else, is on my mind…..Well SE Alaska is ridiculously beautiful, this coming from someone who has traveled a lot and used to work in the Grand Canyon. All over the place there is something new to see. I am still waiting for major whale sightings. Tuesday night before bed I caught a glimpse of some tails of a few porpoises (similar to dolphins), and Wednesday morning at the safety meeting on the stern of the boat (back) I sort of saw a whale surface for a moment. On Thursday, again at the safety meeting on the stern, a few of us saw a humpback whale at a distance breach the water a few times.

While at port, a picture showing the Davit, that picks up the launch boats to deploy them

Sun set on the Fairweather on May19

Bald eagle taking off on May19 from a shoreline feature we were verifying

Patricia Donahue, August 22, 2008

NOAA Teacher at Sea
Patricia Donahue
Onboard NOAA Ship Rainier 
August 19-23, 2008

Mission: Hydrographic Survey of Bear Cove, AK
Geographical Area: Kachemak Bay, Alaska, 59.43.7 N, 151.02.9 W
Date
: August 22, 2008

One of the Rainier’s small boats, also called a launch

One of the Rainier’s small boats, also called a launch

Science and Technology Log 

Much of today had to do with technology. The small boat I went out on, pictured to the right, was filled with computer equipment. Each day at the survey technology department meetings, I’ve listened but not entirely understood the reports of computer issues on the small boats.  This morning I witnessed one such incident. Something didn’t work. Fortunately, there was a work-around and the data collection proceeded smoothly.

I was reminded of the early 18th century efforts to determine longitude. The problem was so pressing that kings of various countries offered rewards for the development of a clock that could keep time at sea. In 1772, James Cook, for whom Cook Inlet in Alaska is named, sailed with the first marine chronometer. The chronometer was a clock that kept accurate time for the home port. On board Cook’s ship, Resolution, there was another clock that kept local time.

Sonar equipment is lowered into the water.

Sonar equipment is lowered into the water.

Since the Earth turns 15 degrees of longitude each hour, by using the difference between the two clocks, seamen would know how far east or west they had traveled. They already knew how to determine latitude with an instrument called a sextant so by using the marine chronometer they could actually plot their coordinates. Now, of course, we take GPS for granted. Many people even have GPS in their cars. These devices and the hand held ones I use with my students at school are accurate to within 4 to 10 meters. Well, the boat I was on today has DGPS, which is even better. It is accurate to within 5 centimeters! With this high-tech equipment, NOAA is able to take very accurate measurements and make very accurate maps.

This graph depicts the velocity of sound through water.

This graph depicts the velocity of sound through water.

The boat I was on today used multi-beam sonar to determine the depth of the ocean floor. This is similar in concept to the single beam in that ping return-times are used. The multi-beam uses a lot more pings, sometimes as many as 200 per second. In the picture above, the sonar equipment is being lowered into the ocean. I learned that salinity, temperature and depth (which is another way of saying pressure) determine the electrical conductivity and density of the water. These two factors then determine the sound velocity.  In the graph, depth is on the Y axis and velocity is on the X axis. Notice the bulge in the plotted line. This represents an area nearer the surface where glacial melt water and ocean water are mixing. The velocity of sound through this water is slower than deeper down where it’s mostly salt water.

This graph displays the pitch, roll, and heave of the boat.

This graph displays the pitch, roll, and heave of the boat.

Measurements of salinity, temperature, electrical conductivity, depth and density were taken 27 times today. This data will be used to adjust the sound velocity to get the most accurate picture of the ocean bottom. The movement of the boat also has an effect on the sonar equipment. NOAA is using the moving vessel profiler or MVP to eliminate the interference caused by the boat’s movement. A boat has a pitch, roll and heave. The computer screen to the left shows graphs of these three types of movement. What do you think was happening on the boat at about halfway across the graph? Remember, the boat is “mowing the lawn” as it collects data. Lastly, the tides also affect the data. Upon return to Rainier, the data is processed and also corrected for the effect of the tides.

TAS Donahue gets a chance to drive the launch.

TAS Donahue gets a chance to drive the launch.

Personal Log 

Several crewmembers have tried fishing from the boat and we’ve seen many small boats with fishermen aboard but no one has caught anything. Using the binoculars aboard the small boat today I watched someone land a fish. I think it was a halibut, which makes sense since we’re in Halibut Cove. The most exciting part of the day was driving the small boat. Data was not collected from a small piece of sea bottom so the boat had to make one last pass over it with the sonar equipment. I’ve driven many different vehicles, even a motorcycle, but a boat is different. I couldn’t make it stay straight!

The scariest thing that happened today didn’t happen to us at all. The United States Coast Guard broadcast a message all afternoon over the marine radio. The message would also start with “pan, pan, pan,” which is the appropriate way to begin a distress call. Most of us have heard of “may day” calls. Those are used when there is immediate danger. A “pan” call is more similar to a warning. A boat carrying two adults and one child had not returned as expected and was missing. The Coast Guard was asking all other boaters to keep an eye out for them. I hope they’ve been found and that everyone is okay.

Animals Seen Today 

A raft of otters, Common Murres, Marbled Murrelets, and Barrow’s Goldeneye

Vocabulary of the Day 

The coxswain is the person who drives the boat.

Challenge Yourself What is 5 cm in inches? What types of movements are pitch, roll and heave?


Lisa Hjelm, August 9, 2008

NOAA Teacher at Sea
Lisa Hjelm
Onboard NOAA Ship Rainier
July 28 – 15, 2008

Mission: Hydrographic Survey
Geographical area of cruise: Pavlov Islands, Alaska
Date: August 9, 2008

A survey technician night processing on the Rainier

A survey technician night processing on the Rainier

Science and Technology Log: Ping to Chart … 

For the past three days I have been Night Processing. That may sound confusing, so I’ll explain. Instead of going out to sea to collect data, I have been processing the data that comes in from the launches. I can’t begin my job for the day until the evening. Survey technicians rotate between collecting and processing data. This science log will summarize the steps that go into turning raw hydrographic data into a navigational chart. Beginning right after dinner, three, four or five, (depending on how many launches were out that day) survey technicians get right to work processing data. CTD casts are used to calculate sound velocity throughout the water column. Night processors take that sound velocity data and apply it as a correction to the raw bathymetry data collected by the launch. Next, the raw data is corrected for the heave of the boat (wave action), and finally for the influence of tides. Then all of this corrected data is merged, and a preliminary base surface (seafloor surface) is created for the bathymetry data.

A preliminary bathymetry chart posted in the Mess.

A preliminary bathymetry chart posted in the Mess.

To check the preliminary base surface, it is viewed with the corrected raw data overlaid. The night processor scans each line of the merged data and looks for anomalies, variations from the norm that might have skewed the base surface. This scan is a time-consuming process. To an outsider it looks a little bit like playing a computer game. Each survey line is divided into small increments and scanned in cross section. Any obviously anomalous data points are highlighted and eliminated. Once the day’s charted area has been scanned and cleaned, the new data is merged with other days’ work. Gradually, building day by day, an entire work area is charted.  To make this process manageable over a sizable area, the survey is divided into sections. Each survey technician is responsible for a section, or sheet. When all of the data has been collected and reviewed, the survey technician writes a scientific report that discusses any data quality  issues, and the work that was done. Other information collected, such as bottom sample data, is included in the scientific report. The sheet is compared with the existing, current chart and also with the bordering sheets. The completed field sheet is sent to the Pacific Hydrographic Branch (PHB) in Seattle where it is reviewed and checked for quality. Finally, the sheet is sent to the Marine Charting Division (MCD) in Silver Spring, MD. The Marine Charting Division chooses the actual soundings that will appear on the chart and publishes it.

An important exception to this step by step process occurs when a danger to navigation is discovered. Dangers are fast tracked, and the information is released to the public almost immediately.

The current chart on the Bridge. The red circle indicates the area in the bathymetric map to the left.

The current chart on the Bridge. The red circle indicates the area in the bathymetric map above.

Personal Science Log: There Ought to be Vents 

Each year my sixth grade science students at Crossroads Academy use one of the NOAA Ocean Explorer Expedition websites for a research project. The students ask a question, and then use NOAA resources to answer the question and write a lab report. This is a challenging project for sixth grade students, so I think some of my students will enjoy reading about how I have used the Teacher at Sea experience to “practice what I preach.”

Vocabulary: Hydrothermal vents -places on the seafloor where warm or hot water flows into the ocean. They are found in areas where there is volcanic activity. The hot, acidic fluids may carry dissolved metals that can precipitate to form ore deposits.

Pavlov Island volcano on the Alaska peninsula

Pavlov Island volcano on the Alaska peninsula, AK Observatory Program

I must confess that along with my Mission from NOAA to perform the duties of a Teacher at Sea (TAS), I came aboard Rainier on a mission of my own. I came to see volcanoes, and even more specifically, I dreamed of discovering volcanic activity or active hydrothermal venting on the seafloor. For as long as I can remember I have been interested in ore deposits that form at vents.

Before becoming a teacher, I mapped and studied ore deposits that formed millions of years ago. It would be very exciting to find evidence of an active vent here in Alaska. That evidence might be: cone shaped or cratered features on seafloor bathymetry maps; floating pumice; gas bubbling on the sea surface; local seawater color changes; and seismic activity (Carey and Sigurdsson, 2007).  By searching the NOAA Vents website I was able to confirm that anomalous values detected by the CTD (Conductivity, Temperature, Depth sensor) instrument (described in log 2) can also be used to help locate hydrothermal vents. Prior to the cruise, I researched the geology of the area as best I could without knowing the exact location of our work area. When I arrived at Rainier, I knew there would be active volcanoes nearby, and I was ready to go.

Approximate area of the current survey with nearby volcanoes indicated.

Approximate area of the current survey with nearby volcanoes indicated, Observatory Program

So far I haven’t seen evidence of hydrothermal venting, no floating pumice, discolored or bubbling water, and the Alaska Volcano Observatory, hasn’t reported seismic activity here within the last month. I have learned how to take a CTD cast, observed volcanic and glacial features in the local landscape, and studied the preliminary bathymetry posted on a chart in the Mess. I am not disheartened nor dissuaded from my quest. In fact, I am encouraged by news from the Office of Marine and Aviation Operations (OMAO) Newsletter for the weeks of July 21 through August 4, 2008 where I read the following report.

Oscar Dyson and Fairweather:  In late June, Oscar Dyson responded to a request from the Office of Coast Survey to investigate a reported area of discolored water outside Dutch Harbor. Dyson confirmed the discoloration during a transit and took a water sample that suggested a possible plankton bloom.  OCS and OMAO then tasked Fairweather to investigate the anomaly during a scheduled transit. Fairweather personnel also confirmed the discolored water, and surveyed the area with the ship’s hull-mounted multi-beam echosounder systems. This revealed a group of small mounds rising a few meters off the seabed in about 100 meters of water directly below the area of discolored surface water. The sonar trace indicated that at least one of these features appeared to be actively emitting a plume of fluid or material. Based on a chartlett produced from the scan, OCS does not believe that these features pose any hazard to surface navigation.  These results have been shared with the U.S. Coast Guard and the Alaska Volcano Observatory, as well as NOAA’s National Weather Service, Pacific Marine Environmental Laboratory, and Office of Ocean Exploration and Research.

Rainier and I are only about 200 miles east of active hydrothermal vents. I have resisted the urge to shout, “Turn the ship around and head west!” After all, when compared to the vast territory that is Alaska, Dutch Harbor is right next door.

References: Carey, Steven, and Sigurdsson, Haraldur. 2007. Exploring submarine arc volcanoes. Oceanography, 20, 4: 80-89.

To learn more about discovering hydrothermal vents and to watch a submarine volcanic eruption, check out the websites below.