Lynn Kurth: Goodbye “Toes”, June 26, 2016

NOAA Teacher at Sea

Lynn M. Kurth

Aboard NOAA Ship Rainier

June 20-July 1, 2016

Mission: Hydrographic Survey

Geographical area of cruise:  Latitude: N 57˚23  Longitude: W 153˚20  (North Coast of Kodiak Island)

Date:  June 26, 2016

Weather Data from the Bridge:
Sky: Fog
Visibility: 1 Nautical Mile
Wind Direction: 085
Wind Speed: 12 Knots
Sea Wave Height: –
Sea Water Temperature: 12.2° C (54° F)
Dry Temperature: 12.6° C (54.7° F)
Barometric (Air) Pressure: 1008.6 mb


Science and Technology Log

As I was looking up at the stars over the ship one evening, I was thinking about the study of space and the 1980’s Teacher in Space program.  It’s difficult to believe that as of this past January it has been thirty years since the Space Shuttle Challenger disaster, which took the life of educator Christa McAuliffe and six other astronauts.  Christa had been selected to become the first teacher in space, which offers such opportunity to learn and grow.  I admire Christa McAuliffe because of this and the fact that she recognized that the study of space offers the opportunity for discovery, innovation and investigation.

kurthblog2

Kurth at Sea (Uganik Bay, Alaska)

I love being a Teacher at Sea because the ocean is similar to space in that it is largely unexplored and offers the chance to discover, innovate and investigate.   In fact, less than 5% of earth’s ocean has been explored even though new technologies have expanded our ability to explore.  Scientists like those I am working with on the Rainier use a variety of this new technology such as satellites, complex computer programs, and multi beam sonar to explore and carry out their hydrographic work.  Over the past week, I have been fortunate to work with these scientists in Uganik Bay and gain a better understanding of how they use these technologies in their work.

DSCN0035 (2)

Out on the skiff with Chief Jim Jacobson and crew

Before the surveying work using the multi beam sonar system can begin, a small crew is sent off the Rainier in a skiff, a shallow flat-bottomed open boat, to complete near shore work.  During this work, the crew on the skiff meticulously examines the features of the coastline while comparing what they see to any available charts and other sources of information about the area.  The depth of Uganik Bay was last surveyed and charted in 1908 but the area does have some additional charting of shoreline features documented throughout the years via aerial photography and information shared by local mariners.  The skiff used for the near shore work is equipped with a GPS (global positioning system) unit and a computer program which continually maps where it travels.  The skiff moves slowly along the shoreline while circling rocks and other features (reefs, islands, kelp beds, fishing gear) in order to accurately determine their size and location.  The scientists record all of their findings on a sheet illustrating the area they are working in and enter the revisions into a computer program when they return to the Rainier.   These revisions frequently include adding features not previously documented, modifying information on existing features or suggesting possible features to be eliminated when they are not found and verified.

DSCN0112

Chief Jim Jacobson enters updated information from near shore work documented while on the skiff.

For example, one of the days while I was working with a crew on a skiff, part of our work involved verifying whether or not a series of rocks existed where they had been previously charted.  Oddly enough, when looking at the chart the formation of rocks looked like a giant left footprint.  This particular feature on the chart, was flagged for us to investigate and verify because each of the rocks that made up “the little toes” seemed to be too equally spaced to be natural features.  When we examined the area we found that there was only one rock, “the big toe”, at the top of the formation vs. a total of five.  The suggested updates to this feature were supported with the documentation of photographs and measurements.  In other words, the scientists suggested that the final revisions completed by NOAA staff in Seattle would include the “amputation” of the four “little toes” from the charts.

footblog1

Sheet used on skiff to document suggested revisions. Notice the “foot” feature?


All Aboard!

I have really enjoyed chatting with the people on board the Rainier because they have interesting stories to share and are happy to share them. Erin Earley, member of the engine utility crew, was one of those people who graciously gave me some of her time for an interview.

DSCN0198

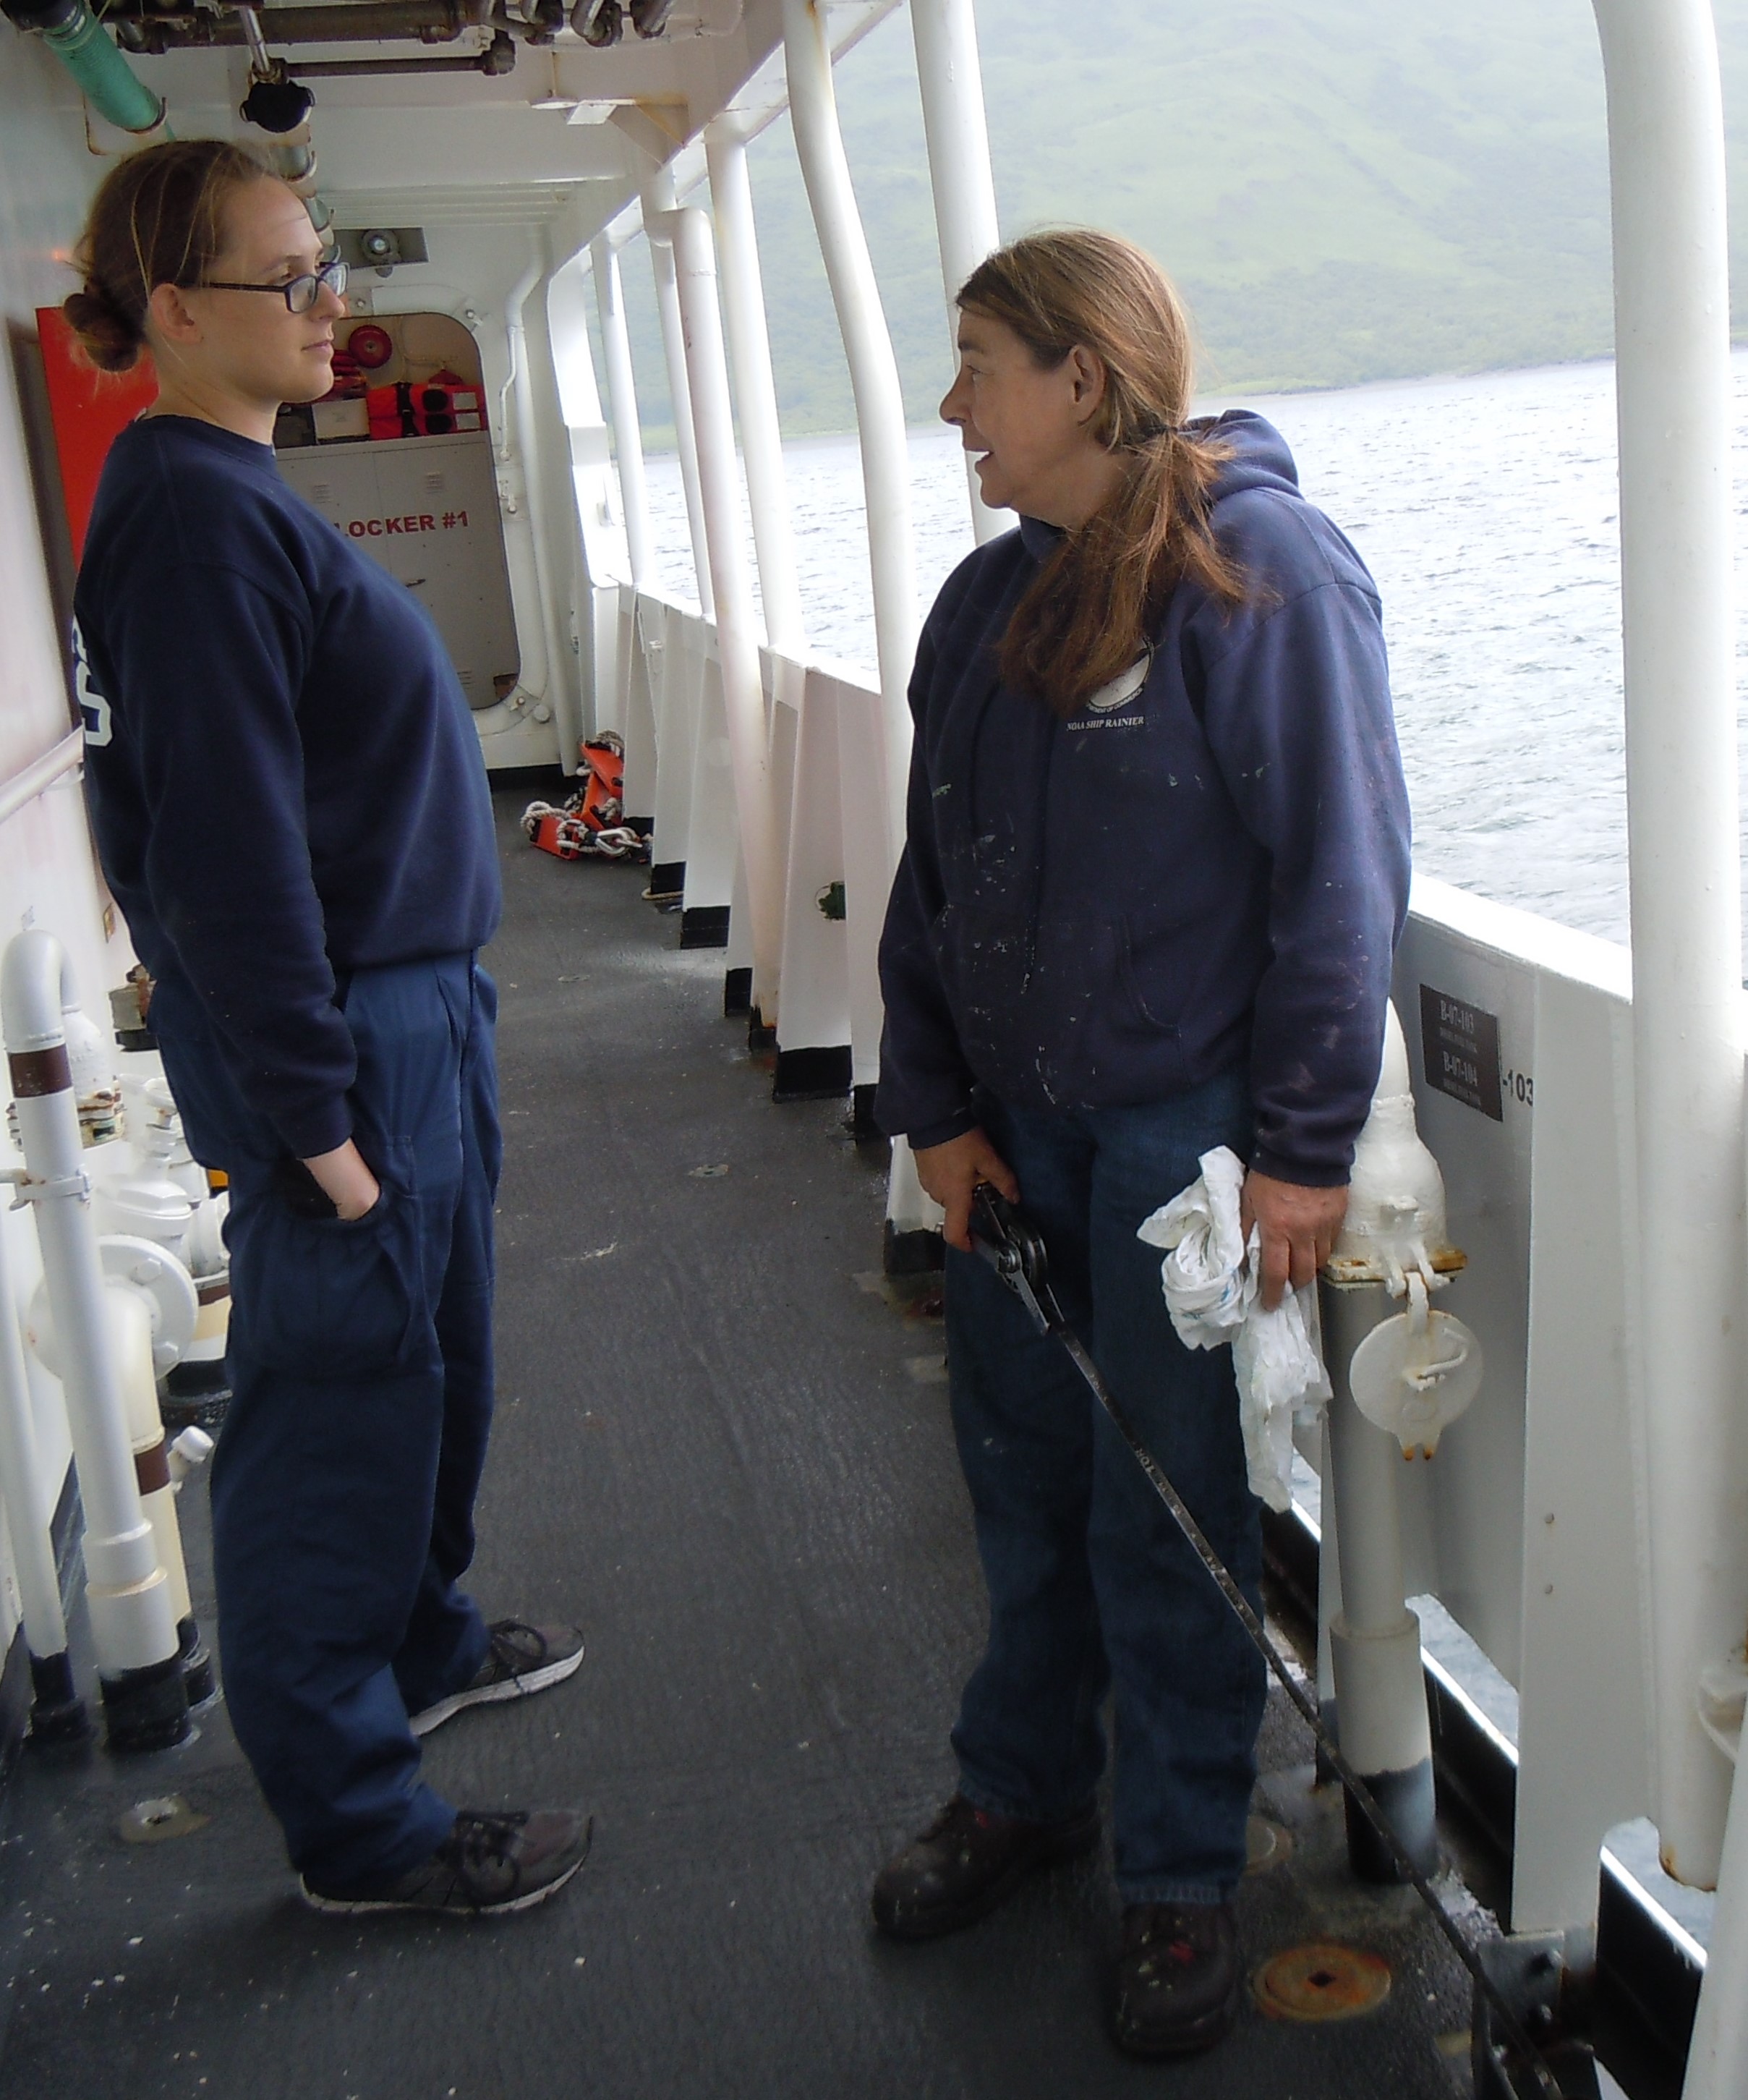
Erin Earley (right) discusses ship operations with Ensign Bethany McAcy (left)

Tell us a little about yourself:

I’m Erin Earley from Sacramento, California and was a social worker prior to working for NOAA (National Oceanic Atmospheric Administration).  I enjoy water color painting, creating multi-medium sculptures, and anything to do with designing gardens.  And I love dogs, Shelties in particular.

How did you discover NOAA and what do you love the most about your job with NOAA?:

As a social worker I had a couple of young adults in the child protection system who wanted to find a different career.  When looking at career options for them I came across a maritime program for youth in Sacramento that seemed to meet their needs.  So, I went to a parent night to learn more about the program and when I heard about the rate of pay and opportunity to travel I asked if they were considering an option for adults to join the program. They said that they were and I registered for the program and began with the AB (able bodied seaman) program for deck work but after watching the Deadliest Catch I decided that wasn’t for me.  So, I decided to complete the engineering program to be qualified for engine room work.  The course work included survival work, emergency ship repair work and fire fighting skills.

I love my job with NOAA because for the most part I’m working with a small group of people, we all know our duties, and we all help each other out.  I enjoy seeing jobs get completed and things getting fixed.  And, the most important reason I love my job is that I don’t have to drive to work and dress up.  I come from Sacramento, and here I don’t have to wait for traffic coming across town and wait at Starbucks for an hour.  On a ship you become a minimalist, you learn what is important and what is not.   I love meeting new people, trying new foods and seeing new things!

DSCN0194

Erin Earley takes a sounding of a fuel tank

What are your primary responsibilities when working on the ship?  

My primary responsibilities at sea include monitoring the oil levels of the equipment, making sure that everything is running properly, reporting to the engineer anything that might be a problem, making sure the bow thruster has proper fluids, and making sure there’s no excess water in any of the places.  We’re floating on a huge ocean and we want to make sure none of it’s coming in!

What kind of background and/or education do you need to have this job?

It would help to go to a maritime school and a lot of major coastal cities have these schools that offer these programs.  If you want a four year college education you could go to a maritime academy (San Francisco, New York and Baltimore ) to get a degree in mechanical engineering and then you could work on a ship or on the shore side at a port.  If you don’t want to go to a four year college you can still work in engineering but you would have to take certification courses and work your way up.  I think for a young person the adventure of working for NOAA is fun but you should always have a plan as far as where you might want to go.  Keep your options open!


Did You Know?

DSCN0185 (2)

The Rainier, Uganik Bay

The Rainier:

  • has 26 fuel tanks
  • uses 500 gallons of fuel a day while at anchor
  • uses 100 gallons of fuel each hour while underway (2400 gallons/day)
  • goes through approximately 50 lbs of beef and 30 lbs of chicken each week
  • uses 8 different kinds of milk (lactose free, soy, almond, cashew, 1%, 2%, whole, and skim)


Virginia Warren: Life at Sea is GREAT!! March 15, 2016

NOAA Teacher at Sea Virginia Warren
Mission: Acoustic and Trawl Survey of Walleye Pollock
Geographical Area of Cruise: Shelikof Strait
on NOAA ship Oscar Dyson
Date: 3/15/2016

Data from the Bridge:
Sky:  Light and variable
Visibility: 10+ Nautical Miles
Wind Direction: West
Wind Speed: 2.50 (4 knots)
Sea Wave Height:  1 – 2, light swell
Air Temperature: 4.2 degrees C (40 degrees F)
Barometric Pressure: 1004.8


NOAA and NOAA Corps Information:

NOAA is an acronym that stands for National Oceanic and Atmospheric Administration. NOAA is a government agency that helps keep citizens informed on weather conditions and the climate. It also conducts fisheries management, and coastal restoration. As stated on their website, NOAA’s mission is to understand and predict changes in climate, weather, oceans, and coasts, to share that knowledge and information with others, and to conserve and manage coastal and marine ecosystems and resources. NOAA has nine key focus areas, 12,000 NOAA personnel, and 6,773 scientists and engineers.

If you would like to read more about what NOAA does, please check out their website here: http://www.noaa.gov/about-our-agency

The NOAA Commissioned Corps Officers are in charge of running NOAA ship Oscar Dyson. The officers keep the ship functioning properly and the people safe. The NOAA Commissioned Officer Corps is one of the seven uniformed services of the United States. As stated on the NOAA Corps website, the NOAA Corps mission is to provide officers technically competent to assume positions of leadership and command in the National Oceanic and Atmospheric Administration (NOAA) and Department of Commerce (DOC) programs and in the Armed Forces during times of war or national emergency.  If you would like read more about what the NOAA Corps does, please check out their website here:  http://www.noaacorps.noaa.gov/about/about.html

You can also watch the NOAA Corps Recruitment video here: http://www.noaacorps.noaa.gov/audiovideo/noaacorps_video.html


Science and Technology Log:

This is my second full day on the ship and my science crew has sorted three trawls. On the first day on shift, I learned that there is a lot of waiting to get the fishing pollock job done correctly. The Chief Scientist, Patrick, is responsible for choosing where and when to launch the trawl. He does this by watching data on a screen that comes from the echo sounder, which is placed under the ship. When you see bright red color on the screen, then you know there is something registering on the echo sounder. This part of the process can take several hours.

Echo Sounder Screen

Echo Sounder Screen

Once you find the fish, then you have to launch the trawl net. This is a very intricate process because as the net is being launched, it has to be kept free of tangles. If tangles occur in the net it could cause the net to rip once the trawl has begun. At the mouth of the trawl where the opening is for fish to enter, there are two large trawl doors that glide through the water like airplane wings, except the “lift” is a spreading force that goes sideways to open the mouth of the trawl for fish to enter.

awt-model-commented1

Scale model of the Aleutian Wing Trawl (AWT) net courtesy of NOAA Scientist Kresimir Williams


Once the trawl is complete, the catch is dumped onto a table that lifts up to the conveyor belt where we separate pollock from all the other types of animals. The pollock are placed into baskets where they are then weighed. A sample of pollock is taken to examine further. Data on everything that we catch goes into a computer system called CLAMS, which is an acronym for Catch Logger for Acoustic Midwater Survey. I will further explain the sorting and data collection processes, and the CLAMS program on a future blog.

This slideshow requires JavaScript.

Personal Log: 

I’m happy to report that all of my flights went great and my luggage didn’t get lost on my way to Kodiak, Alaska. I spent Friday and Saturday nights in Kodiak waiting to rendezvous with the NOAA ship Oscar Dyson Sunday morning.

This slideshow requires JavaScript.

Kodiak is a beautiful, scenic fishing community. I love that Kodiak is able to use clean, alternative-renewable energy resources to make their energy for the island. Notice the wind turbines in the picture below, however Kodiak also uses hydroelectric dams to make most of their power.

Wind Powered Turbines

Wind Powered Turbines

The Oscar Dyson anchored up outside of the Kodiak harbor in efforts to save time by not having to completely dock up in the harbor. The Dyson sent out its small boat called “The Peggy D” to take people to and from the ship. We put really warm jackets that also served as life jackets(float coats).

The "Peggy"

I loved this boat ride because it gave me a view of the harbor I hadn’t been able to see yet!

Beautiful Mountains from the Harbor in Kodiak, Alaska

Beautiful Mountains from the Harbor in Kodiak, Alaska

My first view of the Oscar Dyson was spectacular. I saw it as we rounded a very small island outside of the harbor. With the mountains in the background, the ship made a pretty picture.

NOAA Ship Oscar Dyson

NOAA Ship Oscar Dyson

This is only the beginning of the trip and I am so looking forward to experience the rest of it.

This slideshow requires JavaScript.


Andrea Schmuttermair, Anchors Away from Kodiak, July 7, 2015

NOAA Teacher at Sea
Andrea Schmuttermair
Aboard NOAA Ship Oscar Dyson
July 5 – 25, 2015

Mission: Walleye Pollock Survey
Geographical area of cruise: Gulf of Alaska
Date: July 7, 2015

Weather Data from the Bridge:

Latitude: 56 36.1N
Longitude: 156 04.1W

Visibility: 10nm
Speed: 12 knots
Wind Speed: 4 knots
Wind Direction: 202 degrees
Surface Water Salinity:35.31
Air Temperature: 12.6 C
Barometric Pressure: 1004.6 mbar
Sky: SCT (scattered clouds)

TASAK15 (12)

One of the signs from my walk along the docks in Kodiak. I learned a lot about Kodiak and the fishing industry by reading these signs.

Science and Technology Log:

The walleye pollock fishing industry is the largest commercial fishing industry in the country, and one of the largest fishing industries in the world. Have you eaten fish sticks? Filet-O-Fish from McDonald’s? Imitation crab? If your answer is yes to any of these questions, then you have eaten walleye pollock. Since pollock supports such a large industry, scientists need to carefully monitor its abundance each year. Bring on the scientists and crew on board the Oscar Dyson to make this mission possible.

TIn summer, and in a few locations in winter, scientists head out to assess the walleye pollock population in both the Bering Sea and in the Gulf of Alaska. The summer survey alternates between the two areas, and this summer we are traveling in the Gulf of Alaska for our survey. This second leg (out of 3 legs total) will head counterclockwise around the island of Kodiak. This survey, conducted by the Midwater Assessment and Conservation Engineering Program at the Alaska Fisheries Science Center in Seattle, uses acoustic technology to gather data on the distribution and abundance of fish, which provides researchers with pertinent information about the walleye pollock population.

The Oscar Dyson at Pier 2 before departure from Kodiak.

The Oscar Dyson at Pier 2 before departure from Kodiak.

The Oscar Dyson is a relatively new ship, equipped with noise quieting technology in order to create as little acoustic disturbance as possible when out at sea. Another neat feature crucial to the work of the Dyson is the acoustic transducers located on the bottom of the ship. There are several of these transducers, which are composed of small ceramic disks, and they help scientists detect ocean life and map the seafloor. If you are like me, you are probably wondering what a transducer is, right? It took me a couple of explanations and analogies in order to understand what was happening in these tiny devices. Remember, sound waves are pressure waves that move through a medium, in this case water. The transducer converts electrical energy to mechanical energy, expanding and contracting with electrical signal it receives. This expansion and contraction creates sound waves that move through the water away from the transducers. After sending the pressure waves the transducer switches modes to “listen” to the incoming waves. When the sound waves hit something in the water they are reflected back to the transducer. These reflected waves that are received by the transducers indicate the presence of obstacles in the water. An analogy for this process is that the transducer first acts as a speaker and then as a microphone.

The transducers on the bottom of the ship sending out a signal to the ocean floor.

The transducers on the bottom of the ship sending out a signal to the ocean floor.

Five of these transducers are being used for the pollock survey in order to detect pollock and other ocean life. The information the transducer receives back is automatically graphed on the computer. Scientists and other crew members can view and analyze this graph, and will use this information to determine when it is appropriate to send out a trawl to collect fish. There are also several transducers located around the bottom of the ship that are gathering information about the ocean floor. Hydrographic surveys use this technology as they map the sea floor. I am amazed at where we have come with technology, especially out at sea. Stay tuned for my next post to learn about more amazing technology we are using on board!

Personal Log:

TASAK2015 (30)

Ready to fly on this little plane from Anchorage to Kodiak.

Lucky. That is how I would describe myself when I landed at the Kodiak airport on my flight from Anchorage. First, I was lucky that the flight I was scheduled on made it to Kodiak on its first attempt, as flights are often cancelled for poor weather or low visibility. Planes have been known to turn around and fly back to Anchorage if they can’t make a safe landing in Kodiak. I am also feeling very lucky to have the opportunity to partake in yet another assignment as a NOAA Teacher at Sea, in another area of the country I haven’t yet explored.

I arrived in Kodiak on the 4th of July, and was swept up from the airport by one of the NOAA Corps officers, ENS Justin Boeck. We weren’t scheduled to depart on the Oscar Dyson until Monday, July 6th, so Justin gave me a quick tour of the ship. I wasn’t sure what to expect of the Oscar Dyson, but when my first thoughts climbing on board were that it would take me a week to find my way around! It is much larger than the last ship I was on, the Oregon II, down in the Gulf of Mexico.

Trying to take advantage of the nice weather, I decided to explore the area before we left. The town of Kodiak is quaint, and in walking through the downtown area, it is clear that fishing has been and will continue to be integral to the way of life here.

The science crew came in on the 4th as well from Seattle. I met them all when we went out to dinner Saturday evening. Even though we are going to be sleeping on the ship for next 2 nights before we depart, meals won’t be served until we are underway. I did manage to track down some good sushi and seafood places here in town, and am quite satisfied!

This sculpture was made entirely of trash found in the ocean.

This sculpture was made entirely of trash found in the ocean.

On Sunday, the weather turned for the worse, which made the walk into town for coffee a wet one. If you think weather changes quickly in Colorado, try coming to Alaska. My favorite image of the weather status was at a little shop in Homer, Alaska, which outlined a box with a marker on the window and wrote, “If you want to know the weather, look here.”

That afternoon, I was given a little orientation on what some of my tasks would be on the ship, as there is quite a bit going on in addition to the pollock survey. I will be spending most of my time in the acoustics lab analyzing data, the wet lab processing our catches, and chem lab for some of the special projects.

In the evening, the weather cleared just long enough for me to convince ENS Gilman (ok, he didn’t really need any convincing- he was just as excited as I was) to head down to the pier to test out the Waverunner, the ROV made by the students in my class. While the visibility was not the best, we were able to see plenty of moon jellies, sea anemones and some kelp beds. The ROV handled pretty well in the ocean, although we did have some difficulties bringing it back up when it went down too deep. Students, do you have any suggestions for how we could account for this? Any suggestions or modifications we need to make?

We were supposed to be leaving early afternoon on Monday, however due to the bad weather, several of our crew members had not yet made it in to Kodiak. They finally made it over later that afternoon and we left port at 11pm. I stayed up to watch the sun set as we were leaving port (yes, it does actually set in parts of Alaska), and pushed myself to stay awake for a few more hours. I’ll be working the night shift for the next few weeks, which means I’m on duty from 4pm-4am. The faster I can get myself used to this schedule, the better off I’ll be. The first days in Kodiak have been a blast, and I am excited to begin conducting our survey!

Checking out the ship before we set sail.

Checking out the ship before we set sail.

Did you know? Acoustic transducer technology has been in use since World War II.

Where on the ship is Wilson?

IMG_6055

Wilson, our ring tail camo shark (so aptly named by our awesome science crew) , has been enjoying his time on the ship as much as I have. He has traveled all over the place, and is having fun with the crew on board. Can you guess where he is in the picture above?

Andrea Schmuttermair, Wander-lusting for Alaska, June 24, 2015

NOAA Teacher at Sea
Andrea Schmuttermair
Soon to be Aboard NOAA Ship Oscar Dyson
July 6 – 24, 2015

Mission: Walleye Pollock Survey
Geographical area of cruise: Kodiak, AK
Date: June 24, 2015

TAS2012

Ms. Schmuttermair on the Oregon II, 2012

Wanderlust (n): a strong desire or urge to wander or travel and explore the world.

As I sit writing this initial blog post on the beach here in San Diego, California, I find myself reminiscent of the summer of 2012, the “summer of ships”, as I referred to it. In June of 2012, I was preparing for adventures of a lifetime, for I would be on board not one but two ships throughout that summer. The first, the mighty Oregon II, one of NOAA’s fishery vessels, conducting research in the Gulf of Mexico. The second, a luxurious cruise ship, sailing the waters of Alaska. Little did I know I would be sitting here, 3 years later, eagerly anticipating my voyage back to Alaska yet again on board one of NOAA’s fishery vessels, again as a Teacher at Sea.

Andrea and Wesson

Ms. Schmuttermair and Wesson

My name is Andrea Schmuttermair, and I am currently an elementary teacher at the Colorado STEM Academy just north of Denver, Colorado. I just finished my 11th year teaching, and I have had the privilege to teach some amazing students in Germany, California, and Colorado. I have a lot of fun with my students (like 3D printing sharks and coding our own reaction timer), and strive to give them as many engaging science experiences as I can. Outside of the classroom, you can find me creating opportunities for new adventures and experiences through travel and the outdoors. I love to hike and backpack the trails in Colorado with my faithful companion, Wesson. Traveling to new, uncharted territory is also a frequent occurrence.

I first learned about the Teacher at Sea program back in 2008, and it immediately went on my bucket list. After a couple years of applying, I was accepted as a TAS in 2012 and helped scientists conduct the SEAMAP Summer Groundfish Survey in the Gulf of Mexico. To say I enjoyed it would be an understatement. It was by far one of the best experiences I have had, so much so, that when given the option to reapply, I knew I just had to. I am thrilled to be heading back to Alaska, this time wearing a different hat, to help scientists conduct the walleye pollock survey. The Walleye pollock is a key species in one of the largest fishing industries in the world. I am looking forward to helping scientists with this important research.

My students spent the last several months of school immersed in the fascinating world of the ocean. Being in a landlocked state, the ocean was still relatively undiscovered for them, yet it drew my students in with a desire and passion I couldn’t feed quick enough. From engaging in problem/project based learning to studying ocean animals and their adaptations to skyping with our favorite shark scientist, Dr. Mikki, to creating 3D printed models of new ocean discoveries, I knew my students had found a niche and a passion for learning. They weren’t done yet though. After some brainstorming, we decided to spend the last month of school on an in-depth project learning about and building our very own underwater ROVs. Inspired by NOAA and James Cameron’s recent film, our class learned about how ROVs are built and how they are used in research in the ocean. Very fascinating! We ended our year building 5 ROVs, which culminated in a competition running them through various challenges. The winning ROV, the Waverunner, is coming with me on this trip to swim through the Alaskan waters off the shore in Kodiak. How cool is that?!

This slideshow requires JavaScript.

 I am counting down the days until I head out to sea. Stay tuned for my next entry on board the mighty Oscar Dyson!

Did you know…that the scientific name for the Walleye Pollock was recently changed? After extensive genetic studies, researchers decided to change the scientific name from Theragra chalcogramma to Gadus chalcogrammus. Read more about it here.

Do you…have any questions about the research being done on Walleye pollock? Leave your questions in the comments below!

*Photos courtesy of Caine Delacey and Andrea Schmuttermair

Cassie Kautzer: The Big Picture! August 19, 2014

NOAA Teacher at Sea
Cassie Kautzer
Aboard NOAA Ship Rainier
August 16 – September 5, 2014

Mission: Hydrographic Survey
Geographical Area of Survey: Woody Island Channel, Kodiak, Alaska
Date: August 19, 2014

Temperature:  14°C  (~57°F), Mostly Sunny

Science & Technology Log

Plans have changed quite a bit since I first found out I would be joining the Rainier on the next leg of their mission.  Instead of heading to Cold Bay as originally planned for today, several highly skilled crew members are preparing to join the Fairweather, the Rainier’s sister ship, and help get her back to Seattle, Washington, as she is done for the field season.  Those crew members helping out will return to Kodiak and the Rainier next week, in time to head out and survey around the other side of Kodiak Island.  Until their return, the Rainier is staying “alongside”, (or docked) at the Coast Guard Base in Kodiak (the largest Coast Guard Base in the United States).

NOAA Ship Rainier at the Coast Guard Base in Kodiak, AK.

NOAA Ship Rainier at the Coast Guard Base in Kodiak, AK.

While we are alongside, however, there is plenty of work to be done!  Some survey technicians are busy processing and analyzing data from past projects and surveys, while other techs are planning and preparing a survey around the Woody Island Channel, slightly Northeast of where we are currently docked.  The Woody Island Channel is an important one to get surveyed, as most of the maritime traffic (traffic on the water) coming into Kodiak, goes through the Woody Island Channel.

We will begin that survey work tomorrow, taking out several Launch boats (Survey Launches that are about 30 feet long, are carried aboard the Rainier and able to be deployed for survey missions) to begin gathering sounding data from the ocean floor  in that area.  While the survey technicians make their plans and preparations, I found myself thinking about the big picture: Why is NOAA here?  Why do we need scientists mapping the ocean floor?

To be honest, I had never heard of Hydrography before I applied for the NOAA Teacher as Sea program.  Hydrography is the science of mapping the ocean floor. I feel that I should have been aware of this, however, because Hydrography work affects all of our lives, even if we don’t live anywhere near the ocean (like those of us that live in Arkansas!  Here is how:

  • NOAA is responsible for producing nautical charts for all of our waters, including the territories. This is approximately 3.4 million square (nautical) miles of underwater territory and 95,000 linear (nautical) miles of shoreline.
  • Looking globally, only 5% of the oceans have been mapped with modern Sonar techniques. About half of the area that is charted, is from Lead Line Soundings (some dating back to the 1800’s).  And then there are places like the Arctic, that have never been mapped.
  • Today, commerce drives the use of our oceanic highways. More than ¾ of all goods and supplies in the United States are shipped and delivered across our oceans.  More than ½ our domestic oil comes by ship as well.  And, the grain that we export to countries around the world, goes by ship!

Without accurate survey information, these commercial ships, as well as any fishing or recreational vessels, cannot safely navigate (find their way) through different ocean routes.  Running into an unexpected feature (underwater landform, rocks, an old wreck (shipwreck), or other obstructions) can be very dangerous and costly to any ship.  Without updated nautical charts (maps), boats, ships, and vessels of any size face many unknown hazards as they try to navigate safely (often with goods we need) to their destination.  The Woody Island Channel that we will be surveying this week, is just three days in Kodiak, I have seen two freight ships, a Coast Guard Vessel near 300 feet long, and many small fishing vessels travel through this passage.

So the Big Picture?

THIS… is dangerous for people, and affects global commerce, import, exports, etc.   THIS is what hydrographers don’t want to happen:

This MV Miner ran ashore on these rocks on its way from Montreal to Turkey in 2011.  This is one thing NOAA hopes to prevent with updated nautical charts from hydrographic surveys.  (Courtesty of Canada's  TheStar.Com)

This MV Miner ran ashore on these rocks on its way from Montreal to Turkey in 2011. This is one thing NOAA hopes to prevent with updated nautical charts from hydrographic surveys. (Courtesty of Canada’s TheStar.Com)

Personal Log     

The first several days in Alaska have been amazing.  While we are alongside in Kodiak, I have been able to do some exploring after work each day! I have walked along the beach and hiked up into the mountains.

Me, atop Old Woman's Mountain, Kodiak Island, Alaska.  (Courtesy of ENS Micki Ream)

Me, atop Old Woman’s Mountain, Kodiak Island, Alaska. (Courtesy of ENS Micki Ream)

Alaska is beautiful – so majestic!  I have been fortunate enough to enjoy some beautiful weather, in the high 50s, and sunny most days!  This is rather unusual, they tell me- it is usually starting to cool down and get very rainy this time of year.  I told them I must have brought the warm weather with me from Arkansas!  I am going to try and enjoy it while it lasts, as I am sure I will not luck out to spend three weeks in the sunshine!

For My Students

Check out this graph of the wildlife I have seen thus far!  I am only tracking wildlife that I have seen UP CLOSE (within 20 feet – except for the bear – it would be dangerous to get that close to a bear)!

Wildlife I have seen thus far, graphed using Create A Graph (nces.ed.gov/nceskids/createagraph)

Wildlife I have seen thus far, graphed using Create A Graph (nces.ed.gov/nceskids/createagraph)

Oh kids, I am also wondering if you can tell me:

1. What is the difference between SQUARE miles and LINEAR miles?

2. What kind of tools do you think Hydrographers (or Hydrographic Surveyors) need to survey and map the ocean floor?

Denise Harrington: The Best Day Ever, April 30, 2014

NOAA Teacher at Sea
Denise Harrington
Aboard NOAA Ship Rainier
April 20 – May 3, 2014

Mission: Hydrographic Survey

Geographical Area of Cruise: North Coast Kodiak Island

Date:  April 30, 2014, 11:44 a.m.

Location: 58 03.175’ N  127o 153.27.44’ W

Weather from the Bridge: 6.3C (dry bulb), Wind 5 knots @ 250o, clear, 1-2′ swell.

Our current location and weather can also be seen at NOAA Shiptracker: http://shiptracker.noaa.gov/Home/Map

Science and Technology Log

The last couple of days have been the best ever: beautiful weather, hard work, deep science. We acquired data along the continental shelf and found a cool sea floor canyon and then set benchmarks and tidal gauges.

In hydrography, we gather data in seven steps, by determining: our position on Earth, depth of water, sound speed, tides, attitude (what the boat is doing), imagery and features.  Step 1 is to determine where we are.

In this picture you can see a GOES satellite antenna and a GPS antenna that helps us determine our precise location.

In this picture you can see a GOES satellite antenna (square white one) that is used to transmit tide data ashore and a GPS antenna (the small white eggs shaped one) that provides the tide gauge with both position and UTC time. Photo by Barry Jackson

In this picture  Brandy Geiger, Senior Survey Technician, uses the GOES from various locations to determine the exact location of the tide gauge.

In this picture Brandy Geiger, Senior Survey Technician, uses GPS to record the positions of the benchmarks we have just set for the tide gauge. Photo by Barry Jackson

tide gauge install 023

Where we are happens to be the most beautiful place on earth. Photo by Barry Jackson


In Step 2, we determine the depth of the water below us.

Bathymetry is a cool word that means the study of how deep the water is.  Think “bath” water and metry “measure.”  When your mom tells you to get out of the tub, tell her to wait because you’re doing bathymetry.

As I explained in my first blog, we measure depth by sending out a swath of sound, or “pings,” and count how long it takes for the pings to return to the sonar, which sits beneath the ship or smaller boat.

Yesterday we used the multi-beam sonar to scan the sea floor.  Here is a screen shot of the data we collected.  It looks like a deep canyon, because it is!

Here is the image of the trench Starla Robinson, a Senior Survey Technician, and I discovered.  We decided it should be named Denla Canyon, after us.

Here is the image of the sea floor canyon Starla Robinson, a Senior Survey Technician, and I discovered. We decided it should be named Denla Canyon, after the two scientists who discovered it.

Here I am, gathering pings.

Here I am talking with "the bridge,"  the team responsible for navigating the ship while surveyors collect data.

While collecting data, I kept in contact with “the bridge,” the team responsible for navigating the ship, by radio to ensure the ship’s safety and maximum, quality data acquisition.     Photo by Starla Robinson


Step 3, we take into consideration the tide’s effect on the depth of the water.  Tides are one predictable influence on water depth. There are over 38 factors or “constituents” that influence the tides.  The gravitational pull of the sun and the moon at various times of the day, the tilt of the earth, the topography, and many other factors cause water to predictably bulge in different places on earth at different times. The Rainier crew works 24 hours a day and 7 days a week, so they must find a way to measure depth throughout the days and month, by taking into account the tide. Arthur Doodson, who was profoundly deaf, invented the Doodson Numbers a system taking into account the factors influencing tide in 1921. Flash forward to the 21st century, our Commanding Officer, Commander Rick Brennan worked with a team of NOAA scientists to develop a software program called TCARI, as an alternate method to do tide adjustments, taking into account 38 factors, even the moon’s wobble. Inventions abound at NOAA.

The Rainier crew worked for 14 hours today to set up a tide gauge station, an in depth study of how the tide affects our survey area.  On this map, there is a Red X for each tide gauge we will install.  This process only happens at the beginning of the season, and I feel fortunate to have been here–the work we did was….amazing.


Each Red X is approximately where a tide gauge will be installed.  The one we installed today in Diver's Bay is in the north west corner of the sheet map.

Each Red X is approximately where a tide gauge will be installed. The one we installed today in Driver Bay is in the north west corner of the sheet map.

You can see an animation here that shows the combined effect of two sine waves that produce a signal like our tide data.  Just imagine what it looks like when you factor in 38 different variables.

The earth goes around the sun in 24 hours and moon goes around the earth in a little more than 12 hours, much like these two gray sine waves. Interestingly, when you add two different waves, you get the wonky blue sine wave, with ups and downs. This combined effect of the sun and the moon (two dots) causes the ups and downs of the tide (blue wave). Graph taken from Russell, D. Acoustics and Vibration Animation, PSU, http://www.acs.psu.edu/drussell/demos/superposition/superposition.html.


Low tide is the best time to see sea stars, mussels and barnacles, but it is also a more hazardous time in the tidal cycle for mariners to travel. Therefore, navigational charts use the mean lower low water level, low tide, for the soundings, or depth measurements on a chart.  The black numbers seen on a nautical chart, or soundings, represent depth measurements relative to mean lower low tide. Driver Bay, the area on the chart where we installed the tide gauge today, is the crescent shaped bay at the northwest end of Raspberry Island.

This is a nautical chart used to help mariners navigate safely.

This is a nautical chart used to help mariners navigate safely.

Installing Tide Gauge Stations

Before gathering sonar data, ground and boat crews install a tide gauge to measure changes in water level and to determine the mean lower low water level datum. A tide gauge is a neat device that has air pumped into it, and uses air pressure, to determine how deep the water is.   The tide gauge uses a formula of (density of sea water)(gravity)(height) = pressure.  The gauge measures pressure, and we apply factors for gravity and sea water.  The only missing factor is height, which is what we learn as the gauge collects data.  This formula and nuances for particular locations is a fascinating topic for a blog or master’s thesis.  Scientists are looking for tidal fluctuations and other location specific variances. Then, by computer they determine the mean lower low tide depth, factoring in the tidal fluctuations.

There are permanent tide gauge stations all over the world.  The nearest permanent tide gauge station to our study area is in Kodiak and Seldovia.  These permanent gauges take into account many factors that affect tides over a 19 year period of time, not just the gravitational pull of the moon.

The tide gauge stays in place for at least 28 days (one full tidal cycle).  During the month, data of the tides is collected and can be compared to the other tide gauges we install.

Installing the Tide Gauges and Benchmarks

Excitement built as the crew prepared for the “Tide Party,” packing suitcases full of gear and readying the launches.  Installing Tide Gauges signals the beginning of the season and is one of the few times crew gets paid to go on shore.


Why Bench Mark?

There are three reasons I have figured out after many discussions with patient NOAA crew as to why we put in bench marks.


I installed this benchmark by having a hole drilled in bedrock and affixing the benchmark with concrete if anyone ever returns and needs to know their exact location.

I installed this benchmark in Driver Cove by having a hole drilled in bedrock and affixing the benchmark with concrete if anyone ever returns and needs to know their exact location. Photo by Barry Jackson

The first reason we install benchmarks is to provide a reference framework to ensure both our tide staff and the tide gauge orifice are stable and not moving relative to land.  The second reason is if we ever come back here again to gather or compare data to previous years, we will know the elevation of the tidal datum at this location relative to these benchmarks and can easily install a new tide gauge.  The third reason is that the earth and ocean floor changes constantly.  As scientists, we need to make sure the survey area is “geologically stable.”  We acquire several hours of GPS measurements on the primary benchmark to measure both its horizontal and vertical position relative to the earth’s  reference frame.  Should there ever be an earthquake here, we can come back afterwards and measure that benchmark again and see how much the position of the Earth’s crust has changed.  After the last big earthquake in Alaska, benchmarks were found to move in excess of a meter in some locations!

Teacher on Land Polishing Her Benchmark Photo by Brandy Geiger

Teacher on Land
Polishing Her Benchmark
Photo by Brandy Geiger

Installing the Benchmark

Today, our beach party broke into two groups.  We located stable places, at about 200 foot intervals along the coastline.  We drilled 5 holes on land and filled them with concrete.  A benchmark is a permanent marker you may have seen at landmarks such as a mountain peak or jetty that will remain in place for 100 years or more.  We stamped the benchmark by hand with a hammer and letter stamps with our station identification.   If we chose a good stable spot, the benchmark should remain in the same location as it is now.

Tide Gauge

As one group sets up benchmarks, another group installed the tide gauge.


Here, Chief Jim Jacobson, Lead Survey Technician, sets up a staff, or meter stick, I used to measure the change in water depth and others used for leveling.

Here, Chief Jim Jacobson, Lead Survey Technician, sets up a staff, or meter stick, I used to measure the change in water depth and others used for leveling.  Photo by Barry Jackson

To install the tide gauge, you must have at least three approved divers who install the sensor in deep water so that it is always covered by water.  Because there were only two crew on board trained to dive, Lieutenant Bart Buesseler, who is a dive master, was called in to assist the team.   The dive team secured a sensor below the water.  The sensor measures the water depth with an air pressure valve for at least 28 days.  During this time there is a pump on shore that keeps the tube to the orifice pressurized and a pressure sensor in the gauge that records the pressure. The pressure is equal to the number of feet of sea water vertically above the gauge’s orifice. An on-board data logger records this data and will transmit the data to shore through a satellite antenna.

Divers install the tide gauge, and spent most of the day in the cold Alaska waters.  Good thing they were wearing dive suits!  Photo by Barry Jackson

Divers install the tide gauge, and spent most of the day in the cold Alaska waters. Good thing they were wearing dive suits! Photo by Barry Jackson

Leveling Run

After the gauge and benchmarks are in place, a group does a leveling run to measure the benchmark’s height relative to the staff or meter stick.  One person reads the height difference between 5 different benchmarks and the gauge. Then they go back and measure the height difference a second time to “close” the deal.  They will do the same measurements again at the end of the survey in the fall to make sure the survey area has not changed geographically more than ½ a millimeter in height!  Putting the bubble in the middle of the circle and holding it steady, leveling, was a highlight of my day.

Observation

Finally, a person–me– watches the staff (big meter stick above the sensor) and takes measurements of the water level with their eyes every six minutes for three hours.  Meanwhile, the sensor, secured at the orifice to the ocean floor by divers, is also measuring the water level by pressure. The difference between these two numbers is used to determine how far below the water’s surface the orifice has been installed and to relate that distance to the benchmarks we have just leveled to.  If the numbers are consistent, then we know we have reliable measurements.  I won’t find out if they match until tomorrow, but hope they do.  If they don’t match, I’ll have to go back to Driver Bay and try again.

As we finished up the observations, we had a very exciting sunset exit from Raspberry Island.  I was sad to leave such a beautiful place, but glad to have the memories.

Last minute update: word just came back from my supervisor, Ensign J.C. Clark, that my tidal data matches the gauge’s tidal data, which he says is “proof of my awesomeness.” Anyone who can swim with a car battery in tow is pretty awesome in my book too.

The data Starla Robinson and I collected is represented by the red line and the data the gauge collected is represented by the blue line.  The exact measurements we collected are on the table.

The data Starla Robinson and I collected is represented by the red line and the data the gauge collected is represented by the blue line. The exact measurements we collected are on the table.

Spotlight on a Scientist

Lieutenant Bart Buesseler came to us straight from his family home in the Netherlands, and before that from his research vessel, Bay Hydro II.  The main reason our CO asked him to leave his crew in Chesapeake Bay, Maryland, and join us on the Rainier is because he is a dive master, capable of installing our sensors under water, and gifted at training junior officers.


Lieutenant Beusseler knows he needs to be particularly nice to  Floyd Pounds, an amazing cook from the south who cooks food from every corner of our ocean planet.

Lieutenant Beusseler knows he needs to be particularly nice to the amazing chefs aboard Rainier, including Floyd Pounds, who cooks food from every corner of our ocean planet with a hint of a southern accent.

During his few years of service, LTJG Buesseler adventured through the Panama Canal, along both coasts of North America, and has done everything from repairing gear to navigating the largest and smallest of NOAA vessels through very narrow straits.  He loves the variety: “if I get tired of one task, I rotate on to another to keep engaged and keep my mind sharp.”  He explains that on a ship, each person is trained to do most tasks.  For example, he says, “during our fast rescue boat training today, Cal led several rotations. But what if he is gone? Everyone needs to be ready to help in a rescue.”  Bart says at NOAA people educate each other, regardless of their assignments, “cultivating information” among themselves. Everyone is skilled at everything aboard Rainier.
In the end, he says that all the things the crew does are with an end goal of making a chart.   His motto? Do what you love to do and that is what he’s doing.

Personal Log

Today was a special day for me for many reasons.  It is majestic here: the stark Alaskan peninsula white against the changing color of the sky, Raspberry Island with its brown, golden, crimson and forest green vegetation, waterfalls and rocky outcroppings.  I’m seeing whales, Puffins, Harlequin Ducks and got up close with the biggest red fox ever.  Most importantly, I felt useful and simultaneously centered myself by doing tide observations, leveling and hiking.  I almost dove through the surf to make it “home” to the ship just in time for a hot shower. Lieutenant Buesseler’s reference to “cultivating information” rings very true to me.  In writing these blogs, there is virtually nothing I came up with independently.  All that I have written is a product of the patient instruction of Rainier crew, especially Commander Brennan. Each day I feel more like I am a member of the NOAA crew here in Alaska.


Susy Ellison: There’s a Volcano Outside My Window, September 10, 2013

NOAA Teacher at Sea
Susy Ellison
Aboard NOAA Ship Rainier
September 9-26, 2013

Mission:  Hydrographic Survey
Geographic Area: South Alaska Peninsula and Shumagin Islands
Date:  September 10, 2013

Weather:
Partly cloudy
GPS Coordinates   540 49.627’  N ,   159o 46.421’  W
Temp. 10.3C
Wind Speed 10-14 kts
Barometer 1008.49 mb

Science and Technology Log

You never know what you might see first thing in the morning! When I awoke and looked out my porthole I saw this in the distance.

The volcano has been active for the past few months, but I saw no smoke today.  You can check out volcanic activity at  http://www.avo.alaska.edu/activity/Veniaminof.php

The volcano has been active for the past few months, but I saw no smoke today. You can check out volcanic activity at http://www.avo.alaska.edu/activity/Veniaminof.php


We  are scheduled to leave Kodiak at 1000 Hrs, RST

We are scheduled to leave Kodiak at 1000 Hrs, RST


We cast off yesterday morning at 1000 hrs, RST—Rainier Ship Time.  Although we are still in the Alaska Daylight Savings time zone, our time on the ship has been adjusted backwards 1 hour to give us more daylight during ‘working hours’.  Since the ship is its own floating universe, time that is referenced to a specific time zone is not as important as time that is referenced to our day and the work that needs to be completed.  Einstein would be pleased to see that time is, indeed, relative here aboard the Rainier!

There is science involved just to leave port and set forth on this cruise.  There’s data to be collected, such as a weather forecast—and decisions to be made based on that data.  Today’s weather report called for rain and high winds.  That data input resulted in a travel plan including taking a more protected route north of Kodiak Island instead of heading out to more open water right away.  We didn’t reach the wide-open spaces until evening, and I was lulled to sleep by the endless rocking and rolling of the boat.

We need to take out the trash before we leave.

We needed to take out the trash before we left.

Heading into the Shelikof Strait

Heading into the Shelikof Strait

Science can also include the protocols needed to keep everyone on board safe and healthy during a cruise.  With that in mind, I spent part of the day learning about the ship and the safety routines we need to follow.  Ensign Wall gave me my survival suit, aka Gumby Suit and showed me how to don that lifesaving apparel.  The suit is a foam-filled drysuit, providing insulation and floatation in one handy, non-form-fitting package.  They are, apparently, one size fits none, but when it’s a matter of survival, I doubt that style counts for too many points!

Each person aboard is assigned stations to report to in case of fire or in case it becomes necessary to abandon ship.  I found out that I go to the Boat Shop near the stern in case of fire, and that I head to Station 1 near the bridge.  We had a fire drill in the afternoon, followed by an abandon ship drill.  Much like fire drills at school, it’s a good time to practice and figure out the best way to get to where you need to go.  Since I’m still learning my way around the ship, it was especially important to figure out where I needed to go and how to get there.

Where do I go?

Where do I go?

Trying on my Gumby suit

Trying on my Gumby suit

Then there’s the ‘real’ science—the science of hydrography and the point of this entire venture.  The NOAA Ship Rainier has been tasked with charting (creating maps) of the Shumagin Islands and Cold Bay areas. It’s amazing to think that there are still some parts of our coastline that haven’t been charted.  I spent much of this afternoon talking with the scientists who are making these maps and came away with the overwhelming sense that this is, indeed, a complicated and multi-faceted process. I’ll be writing separate journals on all the science that goes into creating these detailed maps of the ocean floor.  If you just can’t wait and need to know more right now, check out the blogs from previous TAS teachers on the Ship Rainier.

Personal Log

Much of my first day at sea was spent getting used to being aboard a large floating object on a rather bumpy sea.   Our day was spent in transit, from Kodiak to the Shumagin Islands, around 28 hours away.

My very first rainbow at sea!

My very first rainbow at sea!

There’s a lot to learn about life on board the Rainier.  Most important has been orienting myself and figuring out where everything is located.  Decks are labeled from ‘A’, the lowest, to ‘G’, the uppermost deck area. My quarters are on the ‘E’ deck.  The Galley, where food is prepared and served, is on the ‘D’ deck below me, and the Bridge (steering and control of the ship) is above me on the ‘F’ deck.

I have my own room—kind of luxurious living!  There’s a bunk, the head (bathroom), a couple of closets, drawers, and even a small fold-down desk area so that I can write my journals.  Every drawer latches tightly to minimize the chance of unidentified flying objects if we hit some rough weather.

Home, sweet home.

Home, sweet home.

I took a short tour of some of the more esoteric parts of the ship, including a visit to the cofferdam, whose access was through a hatch and down a ladder hidden in one of the heads (bathrooms).  This is sort of like accessing the crawl space under your house through a small tunnel in your bathroom.  While we speculated on just what purpose this area served (storage, poor planning in designing the hull and layout, a random skinny place to hang out?), it turns out that it is a watertight compartment that separates the contact between liquids that might be in the bow area and those in the stern area of the ship.

Starla Robinson leads us down the hatch into the cofferdam

Starla Robinson leads us down the hatch into the cofferdam

Lt. Quintero in the cofferdam.

Lt. Quintero in the cofferdam.

There was also an escape hatch that was incredibly heavy to lift—but I am sure you could lift it if your life depended on it!  I don’t plan on having to test this thing out!!

Just in case you need to get out in a hurry!

Just in case you need to get out in a hurry!