Did You Know?
El Niño 2015/16: A Historical Perspective
- Intro
- About El Niño
- Time Series
- Temp and Precip Maps
- Frequency Maps
- Haywood Plots
- Data Files
Introduction
This page was created to provide data and information to users based on historical El Niño events. This is not a prognostic tool, but a resource to help understand potential impacts of the current El Niño across the United States based on past events. This website and the resources provided will be continually updated throughout the cool season, so please bookmark this page for future reference to ensure you are accessing the most up-to-date information.
- To help understand the potential impacts of this El Niño event, six analog events were chosen due to their similarities in magnitude (as measured by the Oceanic Niño Index), duration, and atmospheric coupling that is forecast for this event. Those previous El Niño events include: 1957-58, 1965-66, 1972-73, 1982-83, 1991-92, and 1997-98.
- Individual and composite temperature and precipitation maps were created based on these six events. Historical comparisons are based on data back to 1950.
-
For some months and seasons, temperature and precipitation varied greatly across the country among these six events, highlighting that no two El Niño events are the same.
- For example, the composite December-February precipitation maps show that northern California has tended to be wetter than average during strong El Niño events, but that was not the case for the specific El Niño events of 1965/66 and 1991/92. The El Niño events during 1957/58, 1982/83 and 1997/98 were exceptionally wet for northern California, which boosted the six event composite values.
- According to the temperature and precipitation outlooks from NOAA's Climate Prediction Center, the seasonal forecast resembles the six strong El Niño event composites. While the above-average precipitation forecast is good news for drought conditions in California, the state would need close to twice its normal October-May rainfall for the drought to completely end and that is unlikely.
- Other factors and teleconnections often play a role in winter weather. Their influence can impact seasonal temperature and precipitation outcomes in the United States. They include:
- The Arctic Oscillation, which influences the number of arctic air masses that penetrate into the South and nor'easters on the East Coast.
- The Madden-Julian Oscillation, which can impact the number of heavy rain storms in the Pacific Northwest.
- In addition to general El Niño information, static maps, GIS shapefiles, and climate division timeseries and data are available. Additional El Niño monitoring products will be added in the coming months.
For the most up-to-date information on current El Niño conditions, please visit the Climate Prediction Center's ENSO page and NCEI's ENSO monitoring teleconnections page.
About El Niño
El Niño is characterized by unusually warm ocean temperatures in the Equatorial Pacific, as opposed to La Niña, which is characterized by unusually cold ocean temperatures in the Equatorial Pacific. El Niño and the Southern Oscillation, also known as ENSO, is a periodic fluctuation in sea surface temperature (El Niño) and the air pressure of the overlying atmosphere (Southern Oscillation) across the equatorial Pacific Ocean. ENSO has important consequences for weather in the U.S. and around the globe. El Niño conditions are typically experienced every two-to-five years.
El Niño was originally recognized by fisherman off the coast of South America as the appearance of unusually warm water in the Pacific Ocean, occurring near the beginning of the year. El Niño means The Little Boy or Christ child in Spanish. This name was used for the tendency of the phenomenon to arrive around the Christmas holiday.
To provide necessary data, NOAA operates a network of buoys which measure temperature, currents and winds in the equatorial band of the Pacific Ocean. These buoys transmit daily data which are available to researchers and forecasters around the world in real time. The strength of each El Niño event can be measured in several ways, but NOAA uses the Oceanic Niño Index (ONI). The ONI is the three-month running mean of sea surface temperature departures from average in the Niño 3.4 region. The Niño 3.4 region is a defined as an area in the central Pacific Ocean bounded by 5°N-5°S, 120°W-170°W. When the ONI exceeds +0.5°C for five consecutive overlapping three-month periods, we are considered to be in an El Niño, or warm phase of ENSO. The strength of an El Niño event is determined by how much above zero the ONI is. If the ONI exceeds 0.5°C, it is considered weak, 1.0°C moderate, 1.5°C strong, and 2.0°C very strong. In the 1950-present record, the ONI has only exceeded 2.0°C twice, during the El Niño events of 1982-82 and 1997-98. The ONI is forecasted to exceed 2.0°C with this current El Niño event during the Northern Hemisphere winter of 2015/16. In terms of climatology, the stronger the El Niño event, the stronger the impacts tend to be. However, not all El Niño events are the same, with other atmospheric and oceanic phenomenon also influencing weather outcomes in the U.S. and around the globe.
El Niño events can directly and indirectly impact the weather pattern across the United States. The impacts of El Niño are typically largest in the U.S. during the cool months from October through May. During an El Niño event, the subtropical jet stream, which is defined as a belt of strong upper-level winds located near latitude 30°N, tends to become stronger and stretch across the southern U.S. and the Gulf of Mexico. Storm systems tend to follow the subtropical jet, bringing above-average precipitation to the southern United States. Once these storms tap into the Gulf of Mexico moisture, they often move up the East Coast. The southern storm track typically results in above-average precipitation for the southern half of the country, from California to the Southern Plains, as well as along the East Coast. This storminess also suppresses temperatures, with below-average temperatures accompanying the above-average precipitation. Across the northern half of the country, the winter season tends to be warmer and drier than average, particularly in the Northwest, Northern Plains, and Ohio Valley.
A considerable amount of attention has been given to this El Niño and what it will mean for the drought impacting the West, particularly in California which has been dealing with a devastating drought for four years. The climatological signal favors above-average precipitation for Southern California and the Southwest, with below-average precipitation for the Northwest. This is optimistic for the locations where above-average precipitation is expected, but not for the locations where below-average precipitation is expected. Northern and central California falls into the area between where above-average and below-average precipitation is expected. During some strong El Niño events, this part of the West has been dry and during others it was been wet, creating a great deal of uncertainty for what this El Niño will mean for the region. This also happens to be the location of California's largest reservoirs, which were at their second lowest water storage levels on record during the autumn of 2015.
For the most up-to-date information on current El Niño conditions, please visit the Climate Prediction Center's ENSO page and NCEI's ENSO monitoring teleconnections page.
Time Series
Climate Division Composite Data
These timeseries show, for states and for the climate divisions within states, how the precipitation that resulted during individual strong El Niño events compares to the long-term historical (1950-spring 2015) baseline, and to the average for strong El Niños.

Temperature and Precipitation Maps
The maps below are temperature and precipitation composites based on six strong historical El Niño events (1957-58, 1965-66, 1972-73, 1982-83, 1991-92, and 1997-98). El Niño impacts are typically strongest during the cold season in the United States. For some months and seasons, temperature and precipitation varied greatly across the country among these six events, highlighting that no two El Niño events are the same. Maps for different timescales from October through May are available.
Note: 5 km gridded maps are not available for Alaska.

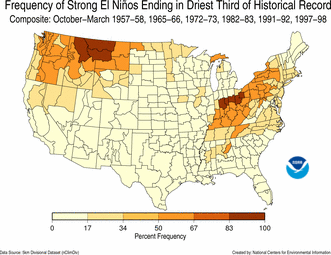
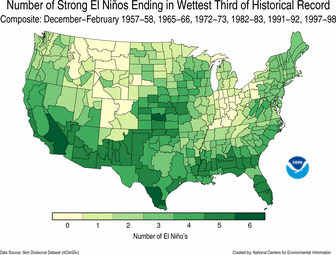
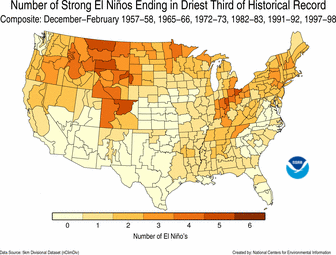
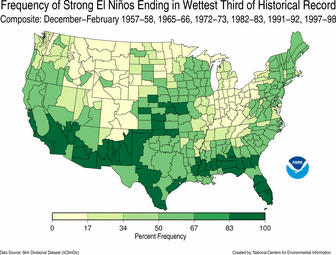
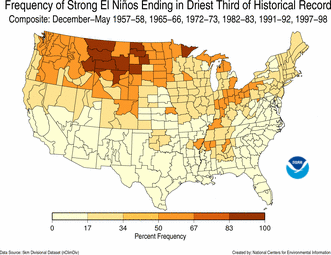
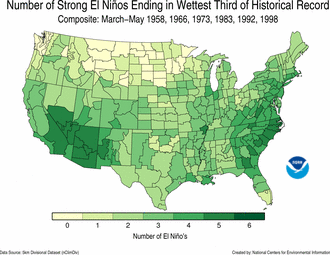
Frequency Maps
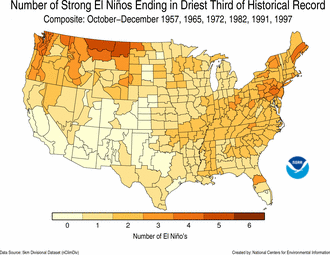
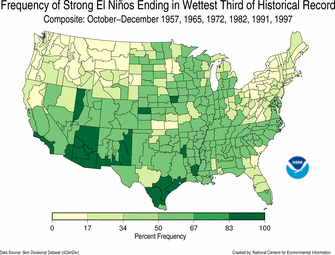
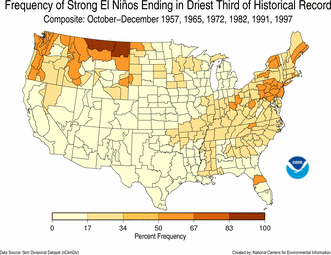
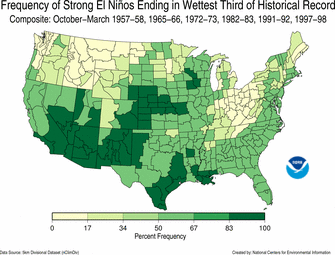
The following maps identify the variability of precipitation outcomes of the six strong El Niño events. The maps show the frequency of the precipitation falling in the wettest or driest third of the 1950 through spring 2015 historical record. For example, California Climate Division 7 (Southeast Desert Basins) was wetter than the 1950-2015 average (its own average) for each of the six winter seasons (December-February) when a strong El Niño was present.
Haywood Plots
The plots below, for about 200 locations in the United States, depict accumulated rainfall from October 1 through May 31 for each year on record as "threads" extending upward and rightward from zero. These plots, commonly known as "Haywood" plots, are useful to track the current season's rainfall compared to the seasonal results from the past. The current season, 2015-16, is colored darkest blue. The previous seasons that occurred during strong El Niño events are shown in light blue. The average of these strong El Niño seasons is also shown in a bold blue thread. Other seasons are shown in light gray. These plots are updated weekly. Click on the plots for a larger version.

GIS Shapefiles
The following GIS shapefile contains monthly and seasonal composite temperature anomalies, precipitation, and precipitation percent of average for the six historical strong El Niño events (1957-58, 1965-66, 1972-73, 1982-83, 1991-92, and 1997-98). Anomalies are provided with respect to the 1981-2010 base period. Data are available for each month from October through May and for the following multi-month periods: October-December, January-March, October-March, December-February, March-May, and December-May.
Divisional Data Files
The following .csv files contain monthly and seasonal composite temperature anomalies, precipitation, and precipitation percent of average for the six historical strong El Niño events (1957-58, 1965-66, 1972-73, 1982-83, 1991-92, and 1997-98). Anomalies are provided with respect to the 1981-2010 base period. Data are available for each month from October through May and for the following multi-month periods: October-December, January-March, October-March, December-February, March-May, and December-May.


