|
Download Data (XLS File) |
|
||||||||
|
||||||||
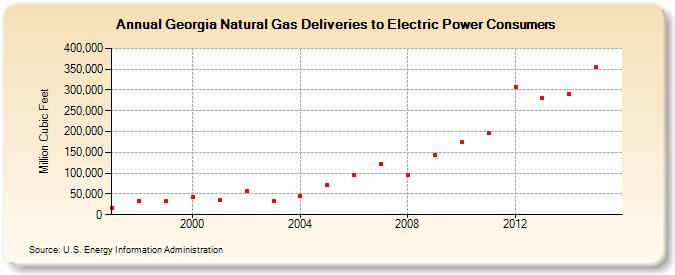
| Georgia Natural Gas Deliveries to Electric Power Consumers (Million Cubic Feet) | ||||||||
| Decade | Year-0 | Year-1 | Year-2 | Year-3 | Year-4 | Year-5 | Year-6 | Year-7 | Year-8 | Year-9 |
|---|---|---|---|---|---|---|---|---|---|---|
| 1990's | 17,054 | 33,351 | 32,505 | |||||||
| 2000's | 42,034 | 34,666 | 56,588 | 32,258 | 45,926 | 72,267 | 95,407 | 121,726 | 96,316 | 142,467 |
| 2010's | 175,082 | 196,492 | 308,096 | 279,506 | 289,972 | 354,090 |
| - = No Data Reported; -- = Not Applicable; NA = Not Available; W = Withheld to avoid disclosure of individual company data. |
| Release Date: 12/30/2016 |
| Next Release Date: 01/31/2017 |